. 2021 Mar 22;11(1):6568.
doi: 10.1038/s41598-021-85928-6.

Low soil moisture predisposes field-grown chickpea plants to dry root rot disease: evidence from simulation modeling and correlation analysis

Affiliations

Low soil moisture predisposes field-grown chickpea plants to dry root rot disease: evidence from simulation modeling and correlation analysis

Ranjita Sinha et al. Sci Rep. .

Abstract

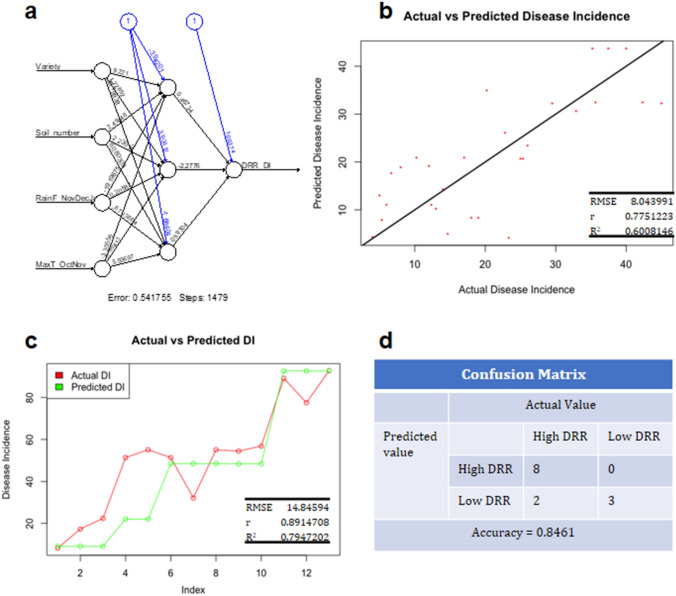
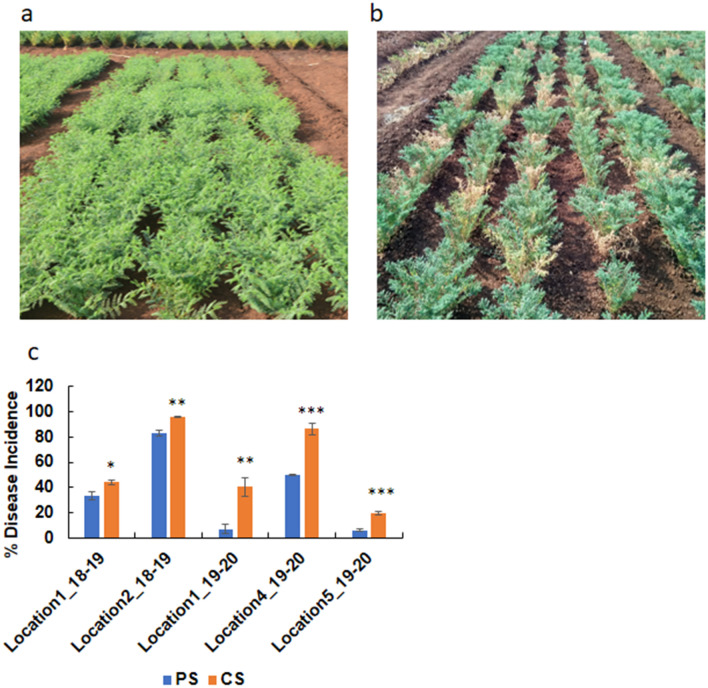
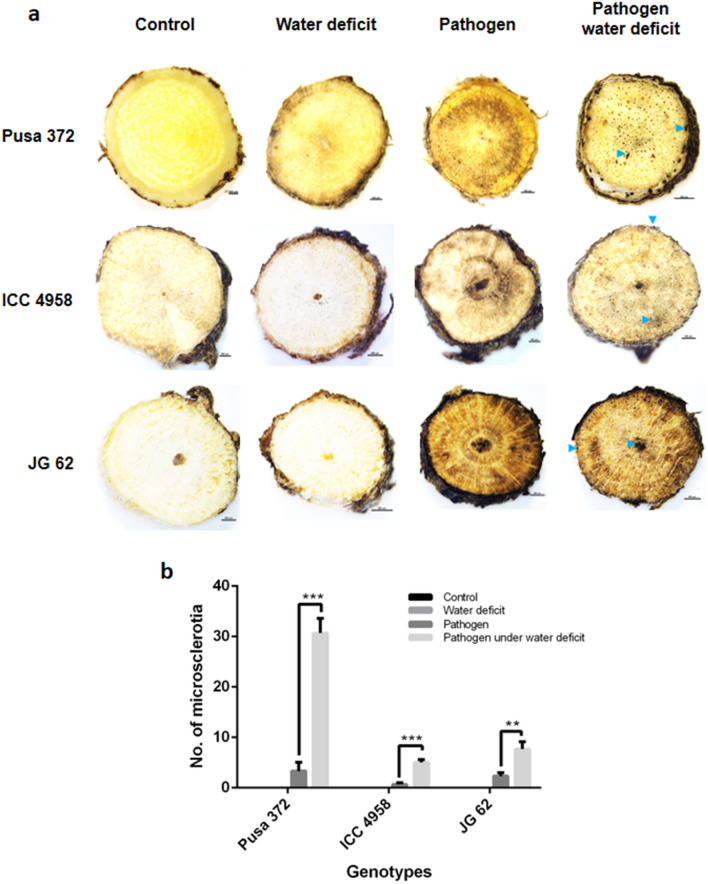
Rhizoctonia bataticola causes dry root rot (DRR), a devastating disease in chickpea (Cicer arietinum). DRR incidence increases under water deficit stress and high temperature. However, the roles of other edaphic and environmental factors remain unclear. Here, we performed an artificial neural network (ANN)-based prediction of DRR incidence considering DRR incidence data from previous reports and weather factors. ANN-based prediction using the backpropagation algorithm showed that the combination of total rainfall from November to January of the chickpea-growing season and average maximum temperature of the months October and November is crucial in determining DRR occurrence in chickpea fields. The prediction accuracy of DRR incidence was 84.6% with the validation dataset. Field trials at seven different locations in India with combination of low soil moisture and pathogen stress treatments confirmed the impact of low soil moisture on DRR incidence under different agroclimatic zones and helped in determining the correlation of soil factors with DRR incidence. Soil phosphorus, potassium, organic carbon, and clay content were positively correlated with DRR incidence, while soil silt content was negatively correlated. Our results establish the role of edaphic and other weather factors in chickpea DRR disease incidence. Our ANN-based model will allow the location-specific prediction of DRR incidence, enabling efficient decision-making in chickpea cultivation to minimize yield loss.


Conflict of interest statement

The authors declare no competing interests.

Figures

Figure 1
Figure 1
Correlation analyses between DRR disease incidence and weather parameters. Correlation analyses was performed using publicly available DRR disease incidence data to study the relation between DRR disease incidence and weather components; rainfall and temperature. DRR disease incidence data was gathered from published research articles and theses (Supplementary file S1, Supplementary Table S1). Weather data for the respective locations were acquired from Indian Meteorological Department. Weather data for the field trial season mentioned in the source was acquired, and the monthly average for the months from October to February for maximum and minimum temperature was calculated. Total monthly rainfall and total rainfall for the two and three consecutive months were also calculated. A correlation was performed using Pearson’s correlation method for all the possible weather factors and DRR Disease incidence (a). Correlation analyses was performed for complete DRR data set, and data set for the A1 genotype, JG11 genotype, red soil type and black soil type. Red boxes represents significant positive correlation, and blue boxes represent significant negative correlation, empty boxes represent no significant correlation. Correlation with p < 0.05 was taken as statistically significant. A negative correlation exists between DRR disease incidence and rainfall, while a positive correlation exists between disease incidence and minimum and maximum temperature. RainF = rainfall, MinT = minimum temperature, MaxT = Maximum temperature, DRR DI = DRR disease incidence, Oct = October, Nov = November, Dec = December, Jan = January, Feb = February, Mar = March.
Figure 2
Figure 2
Training, testing, and validation of neural network. Neural network was trained using total rainfall from November to January (RainF_NovDecJan), an average of maximum temperature for the October and November months (MaxT_JanFeb) along with information about variety (Variety) and soil type (Soil_number) as input, and DRR disease incidence data (Supplementary File S1) as output. The entire dataset was divided into 70% training set and 30% testing set. Neural network (NN) was trained in R using neuralnet algorithm with backpropagation method. The best fit in NN training was obtained with one hidden layer having three nodes. Network topology for the training and linear regression between actual and predicted for the training set are shown in (a) and (b), respectively. Numbers in connecting lines from input layer to hidden layer and from hidden layer to output layer represent weights used in the model and number connecting blue circles are biases. Linear activation function was used for the network training. Validation of the trained neural network was performed with DRR disease incidence from the current (2019–2020) field experiment study and with DRR incidence data of location-2 from Sinha et al. (2019) research article. Validation data set included DRR disease incidence data from severe combined stress treatment plots. Input and output data used for validation is in Supplementary File S1. A comparison between actual (red) and predicted DRR disease incidence (green) is shown as line graph (d). RMSE, r and R2 is showing root mean square error, correlation coefficient and coefficient of determination, respectively. DRR incidence was categorized into High DRR (disease incidence > 30%) and Low DRR (disease incidence < 30%) and confusion matrix was created with actual and predicted DRR incidence for the validation set. The prediction accuracy was calculated.
Figure 3
Figure 3
Correlation between DRR disease incidence and various edaphic factors. DRR disease incidence data from the field trial year 2018–19 and 2019–20 were analyzed for correlation (Pearson) with the edaphic factors for the respective trials. Red circles in correlation matrix represent significant positive correlation, and blue circles represent significant negative correlation, empty circles represent no significant correlation. Correlation with p < 0.05 was taken as statistically significant. Data used for the analyses along with correlation matrix with p-value is in Supplementary Table S3. DRR-DI = DRR disease incidence, EC = electrical conductivity of soil, organic C = organic carbon of soil.
Figure 4
Figure 4
Dry root rot disease incidence under pathogen, and combined stress treatments in field trials. Field experiment was conducted at three different geographical locations during 2018–2019 and seven different geographical locations during 2019–2020 in India (Supplementary Fig. S5) with control, PS, LSM, and CS (Supplementary Fig. S6). The experiment was conducted with four replicates in RCB design. The results from PS and CS treatments were analysed to understand the impact of low soil moisture on DRR incidence. The field trial layout (representative) for PS treatment and CS treatment are shown in figure (a) and (b), respectively. Percent DRR disease incidence calculated during the field trial period are shown for five field trial location in the graph (c). All the DRR disease incidence is an average of three to four RCB replicates with Standard error of mean. Significance difference between means were analysed by Student’s t test. *p < 0.05, **p < 0.005, ***p < 000.5. PS, pathogen stress; CS, combined low soil moisture and pathogen stress.
Figure 5
Figure 5
Low soil moisture aggravates the DRR incidence in various chickpea genotypes. Chickpea genotypes PUSA 372, ICC 4958 and JG 62 were used to explore the impact of soil water deficit stress on DRR disease incidence. The experiment was conducted during the rabi season (October to March, 2019–2020). Plants were imposed with LSM, PS, and CS treatments and along with control. Plants were uprooted at the time of maturity and examined for the presence of microsclerotia in the root. Handmade root sections were made at 2 cm from the point of seed attachment. Microsclerotia present on the root was counted. Images (a) show the transverse section of three genotypes in all the treatments and control. Graph (b) shows the number of microsclerotia in the root sections. Images were captured under the 0.5X objective lens of the research stereo microscope SMZ25. Scale bar is 500 µm. N = 3. Significance difference was determined using one-way ANOVA (p < 0.0001) and the asterisk represents the significance. Blue arrows show the microsclerotia. LSM, low soil moisture; PS, pathogen stress; CS, combined low soil moisture and pathogen stress.

References

    1. Bostock RM, Pye MF, Roubtsova TV. Predisposition in plant disease: Exploiting the nexus in abiotic and biotic stress perception and response. Annu. Rev. Phytopathol. 2014;52:517–549. doi: 10.1146/annurev-phyto-081211-172902. - DOI - PubMed
    1. Suzuki N, Rivero RM, Shulaev V, Blumwald E, Mittler R. Abiotic and biotic stress combinations. New Phytol. 2014;203:32–43. doi: 10.1111/nph.12797. - DOI - PubMed
    1. Kissoudis C, et al. Responses to combined abiotic and biotic stress in tomato are governed by stress intensity and resistance mechanism. J. Exp. Bot. 2016;67:5119–5132. doi: 10.1093/jxb/erw285. - DOI - PMC - PubMed
    1. Pandey P, Irulappan V, Bagavathiannan MV, Senthil-Kumar M. Impact of combined abiotic and biotic stresses on plant growth and avenues for crop improvement by exploiting physio-morphological traits. Front. Plant Sci. 2017;8:1–15. - PMC - PubMed
    1. Sinha R, Irulappan V, Mohan-Raju B, Suganthi A, Senthil-Kumar M. Impact of drought stress on simultaneously occurring pathogen infection in field-grown chickpea. Sci. Rep. 2019;9:1–15. - PMC - PubMed

Publication types

LinkOut - more resources