. 2021 Mar 22;11(1):6558.
doi: 10.1038/s41598-021-85919-7.

Developmental exposure to silver nanoparticles leads to long term gut dysbiosis and neurobehavioral alterations

Affiliations

Developmental exposure to silver nanoparticles leads to long term gut dysbiosis and neurobehavioral alterations

Zhen Lyu et al. Sci Rep. .

Abstract

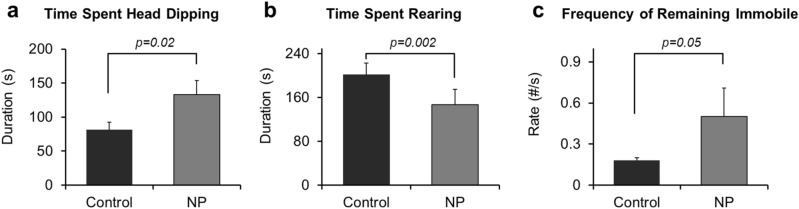
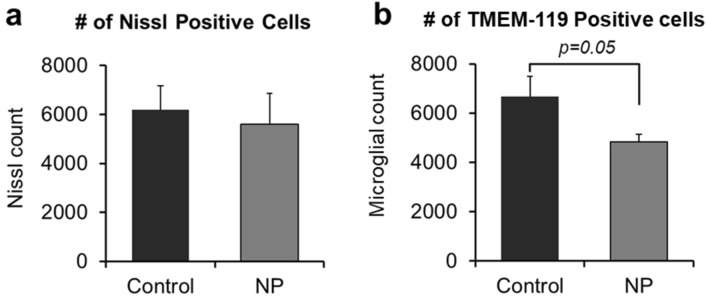
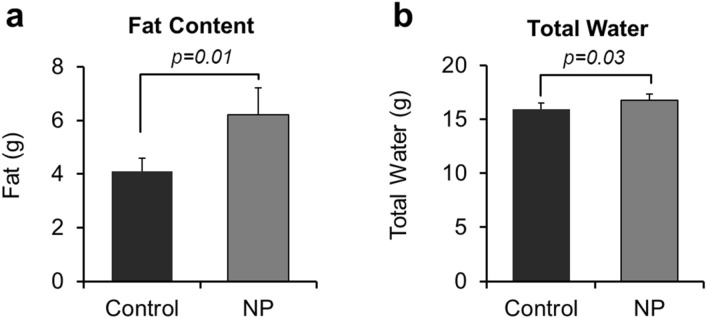
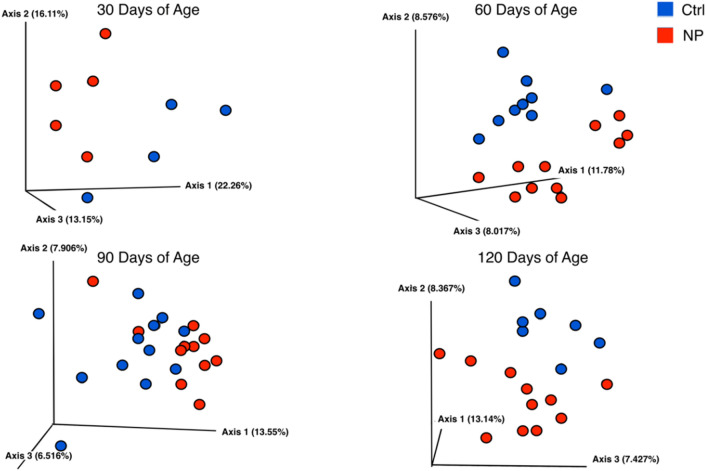
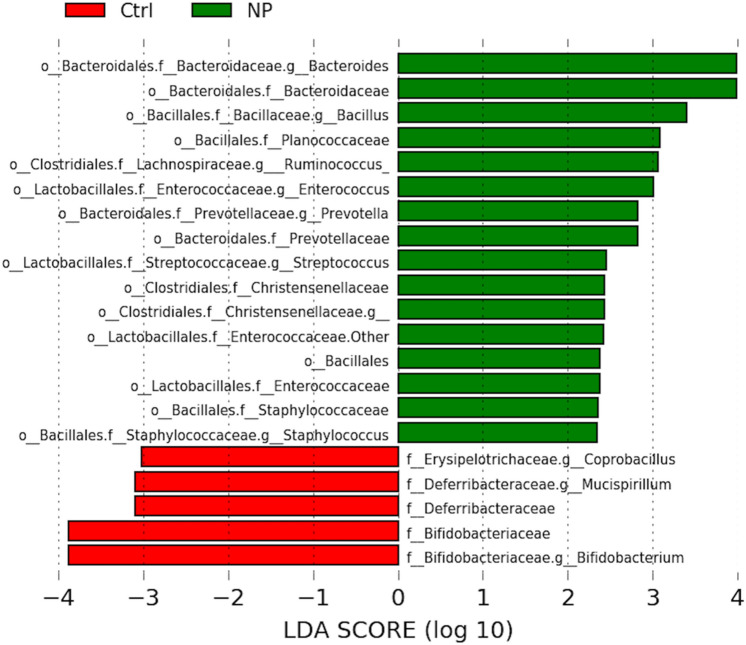
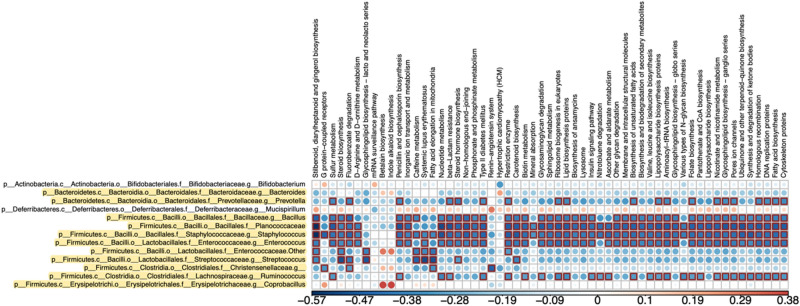
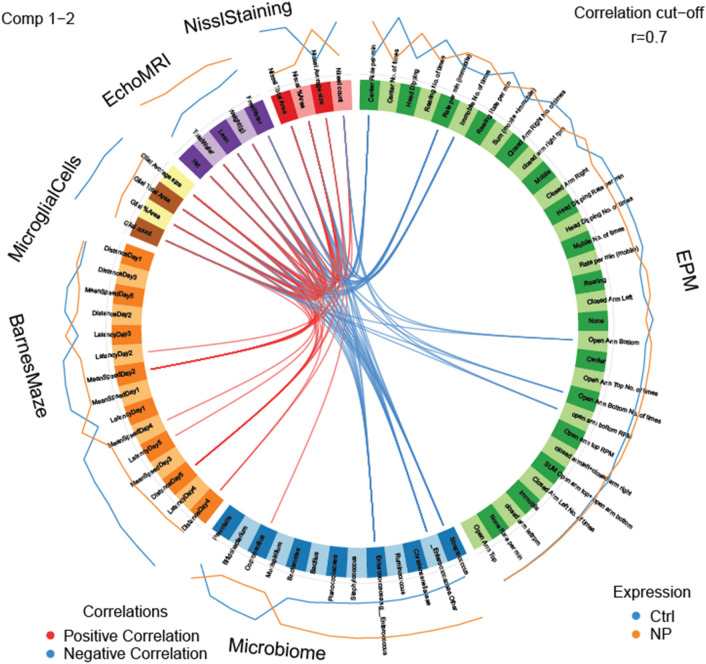
Due to their antimicrobial properties, silver nanoparticles (AgNPs) are used in a wide range of consumer products that includes topical wound dressings, coatings for biomedical devices, and food-packaging to extend the shelf-life. Despite their beneficial antimicrobial effects, developmental exposure to such AgNPs may lead to gut dysbiosis and long-term health consequences in exposed offspring. AgNPs can cross the placenta and blood-brain-barrier to translocate in the brain of offspring. The underlying hypothesis tested in the current study was that developmental exposure of male and female mice to AgNPs disrupts the microbiome-gut-brain axis. To examine for such effects, C57BL6 female mice were exposed orally to AgNPs at a dose of 3 mg/kg BW or vehicle control 2 weeks prior to breeding and throughout gestation. Male and female offspring were tested in various mazes that measure different behavioral domains, and the gut microbial profiles were surveyed from 30 through 120 days of age. Our study results suggest that developmental exposure results in increased likelihood of engaging in repetitive behaviors and reductions in resident microglial cells. Echo-MRI results indicate increased body fat in offspring exposed to AgNPs exhibit. Coprobacillus spp., Mucispirillum spp., and Bifidobacterium spp. were reduced, while Prevotella spp., Bacillus spp., Planococcaceae, Staphylococcus spp., Enterococcus spp., and Ruminococcus spp. were increased in those developmentally exposed to NPs. These bacterial changes were linked to behavioral and metabolic alterations. In conclusion, developmental exposure of AgNPs results in long term gut dysbiosis, body fat increase and neurobehavioral alterations in offspring.


Conflict of interest statement

The authors declare no competing interests.

Figures

Figure 1
Figure 1
EPM results: (a) Time spent head dipping, (b) Time spent rearing and, (c) Frequency of remaining immobile. p value differences are designated above the graphs. Replicates tested include n = 11 for Ctrl; n = 12 for NP (AgNP).
Figure 2
Figure 2
Nissl and Glial staining results: (a) Nissl positive cells and (b) Microglial positive cells. p value differences are designated above the graphs. Replicates tested include; n = 11 for Ctrl; n = 12 for NP (AgNP).
Figure 3
Figure 3
Echo-MRI results for: (a) Total fat content and (b) Total water. p value differences are designated above the graphs. Replicates tested include n = 11 for Ctrl; n = 12 for NP (AgNP).
Figure 4
Figure 4
3D PCA plots to show β-diversity. Figure shows results for Control and NP (AgNP) groups at 30, 60, 90, and 120 days of age. PERMANOVA values: Replicates tested include Ctrl and NP (AgNP) groups respectively at 30 (n = 10 and n = 9), 60 (n = 11 and n = 11), 90 (n = 12 and n = 10), and 120 (n = 10 and n = 12) days of age. 30 days of age p = 0.027, 60 days of age p = 0.001, 90 days of age p = 0.002, and 120 days of age p = 0.006. Each circle represents a single replicate.
Figure 5
Figure 5
LEfSe analyses for bacterial differences at 120 days of age. Bacteria shown in green bars are greater in NP (AgNP) group; whereas those shown in red are greater in control (Ctrl) group. Replicates tested include n = 10 for Ctrl; n = 12 for NP (AgNP).
Figure 6
Figure 6
Bacterial metabolic and other pathway differences in the fecal microbiome of NP vs. Ctrl. As described in Fig. 7 of Ma et al., correlations between the PICRUS t-generated functional profile and QIIME-generated genus level bacterial abundance were calculated and plotted against treatment group. Those genera that were identified by LEfSe as being different between the two groups are depicted. Bacteria that are highlighted had increased relative amounts in NP (AgNP) group. Metabolic pathway designations are delineated at the top of the figure. Shading intensity and size of the circles indicates the Kendall rank correlation coefficient between matrices. Red indicates a positive correlation; whereas blue designates a negative correlation. Red squares surrounding the circles are indicative of a P value ≤ 0.05. Legend for the quantitative scores associated with the range of blue to red colors is listed below the figure.
Figure 7
Figure 7
Circos plot correlations between gut bacterial, brain histological analyses, and behavioral parameters in NP vs. Ctrl. Red lines in the center indicate a positive correlation. In contrast, blue lines indicate a negative correlation. Results for AIN females are indicated with a blue line outside of the circle. Orange line indicates results for GEN females. The color of the line further from the circle indicates the group where these results are greater.

References

    1. Castriciano, M. A., Functional nanostructures for sensors, optoelectronic devices, and drug delivery. Nanomaterials (Basel)10(6), 1195 (2020). - PMC - PubMed
    1. Liu J, Sonshine DA, Shervani S, Hurt RH. Controlled release of biologically active silver from nanosilver surfaces. ACS Nano. 2010;4(11):6903–6913. doi: 10.1021/nn102272n. - DOI - PMC - PubMed
    1. Chen X, Schluesener HJ. Nanosilver: A nanoproduct in medical application. Toxicol. Lett. 2008;176(1):1–12. doi: 10.1016/j.toxlet.2007.10.004. - DOI - PubMed
    1. Chaudhry Q, Scotter M, Blackburn J, Ross B, Boxall A, Castle L, Aitken R, Watkins R. Applications and implications of nanotechnologies for the food sector. Food Addit. Contam. Part A Chem. Anal. Control Expo Risk Assess. 2008;25(3):241–258. doi: 10.1080/02652030701744538. - DOI - PubMed
    1. Loeschner K, Hadrup N, Qvortrup K, Larsen A, Gao X, Vogel U, Mortensen A, Lam HR, Larsen EH. Distribution of silver in rats following 28 days of repeated oral exposure to silver nanoparticles or silver acetate. Part Fibre Toxicol. 2011;8:18. doi: 10.1186/1743-8977-8-18. - DOI - PMC - PubMed

Publication types

LinkOut - more resources