. 2021 Jun;17(6):675-683.
doi: 10.1038/s41589-021-00765-y. Epub 2021 Mar 22.

Discovery and resistance mechanism of a selective CDK12 degrader

Affiliations

Discovery and resistance mechanism of a selective CDK12 degrader

Baishan Jiang et al. Nat Chem Biol. 2021 Jun.

Abstract

Cyclin-dependent kinase 12 (CDK12) is an emerging therapeutic target due to its role in regulating transcription of DNA-damage response (DDR) genes. However, development of selective small molecules targeting CDK12 has been challenging due to the high degree of homology between kinase domains of CDK12 and other transcriptional CDKs, most notably CDK13. In the present study, we report the rational design and characterization of a CDK12-specific degrader, BSJ-4-116. BSJ-4-116 selectively degraded CDK12 as assessed through quantitative proteomics. Selective degradation of CDK12 resulted in premature cleavage and poly(adenylation) of DDR genes. Moreover, BSJ-4-116 exhibited potent antiproliferative effects, alone and in combination with the poly(ADP-ribose) polymerase inhibitor olaparib, as well as when used as a single agent against cell lines resistant to covalent CDK12 inhibitors. Two point mutations in CDK12 were identified that confer resistance to BSJ-4-116, demonstrating a potential mechanism that tumor cells can use to evade bivalent degrader molecules.


Figures
Extended Data Figure 1.
Extended Data Figure 1.. Development of CDK12 degraders BSJ-4-23 and BSJ-4-116.
(a) Chemical structures of THZ531 and its 3 fragments with ligand efficiency values. (b) In vitro CDK12 kinase assay. Assays were performed at an ATP concentration of 30 μM (apparent Km). Data are presented as mean ± s.d. of n = 3 biologically independent samples. (c) Preliminary screening immunoblots for CDK12, CDK13 and β-Actin in Jurkat cells after 6 h treatment with DMSO or different CDK12 degraders at the indicated concentrations. (d) Binding groove for BSJ-4-23 in modeled ternary complex of CDK12/BSJ-4-23/CRBN (CDK12 in blue, PDB ID: 5ACB, CRBN in orange, PDB ID: 4TZ4, BSJ-4-23 carbons in light grey). (e) Time-dependent effect of BSJ-4-116 (50 nM) on CDK12, CDK13 and cyclin K protein levels after 2 h, 4 h, 8 h, 16 h and 24 h treatment in Jurkat cells. (f) Left: Immunoblots for CDK12, CRBN and β-Actin in WT and CRBN null Jurkat cells after 6 h treatment with DMSO, BSJ-4-23 (250 nM) and BSJ-4-116 (50 nM); Right: Immunoblots for CDK12 and α-tubulin in Jurkat cells following 2 h pre-treatment with DMSO, Carfizomib (400 nM), MLN4924 (1000 nM), Thalidomide (1000 nM) and THZ531 (250 nM) followed by 6 h co-treatment with DMSO or BSJ-4-116 (50 nM). (g) KinomeScan kinase selectivity profile for BSJ-4-116. BSJ-4-116 was profiled at a concentration of 1 μM against a panel of 468 human kinases. The results for the binding interactions are reported as a percent of the DMSO control (% control), where larger red circles indicate stronger binding hits. The selectivity score was defined as the ratio of the number of kinases inhibited to a specified percentage versus the total number of kinases. (h) Degradation effect of BSJ-4-116 and BSJ-4-116NC at indicated doses prechecked by western blots for the proteomics experiment in Jurkat cells. (i) NanoBRET live cell ternary complex assays performed in MOLT-4 cells co-expressing HaloTag-CRBN and one of the following C-terminal NanoLuc fusions: CDK12, CDK12 (K745R), CDK12 (L752M), CDK12 (K745R/L752M) or CDK13, CDK13 (R723K), CDK13 (M730L), CDK13 (R723K/M730L). The fold increase in NanoBRET signal relative to BSJ-4-116NC was plotted after 3 h treatment with the indicated compounds with n=6 biologically independent samples.
Extended Data Figure 2.
Extended Data Figure 2.. CDK12 degradation preferentially leads to premature cleavage and polyadenylation (PCPA) of long genes enriched with DDR genes.
(a) Genome-wide correlation analysis for replicates from each condition showing significant correlation between BSJ-4-116 vs THZ531, and DMSO vs BSJ-4-116NC. (b) Immunoblots for CDK12 and α-tubulin in Jurkat cells treated with DMSO or BSJ-4-116 (50 nM) for indicated hours. (c) Fisher exact test showing significant overlap in genes downregulated by BSJ-4-116 vs THZ531 (p=0). There was also significant overlap in the small numbers of gene upregulated (p=1.42e-136). (d) GSEA of downregulated genes in Jurkat cells treated with BSJ-4-116 and THZ531. (e) Additional enriched GSEA signatures enriched by BSJ-4-116 treatment. (f) Left: qRT-PCR analysis of the indicated DDR gene expression in Jurkat and MOLT4 cells treated with BSJ-4-116 (50 nM) or BSJ-4-116NC (100 nM) for 10 h. Data were normalized to GAPDH and compared to DMSO-treated controls (n=3). Right: Immunoblots for indicated DDR and cell death markers in Jurkat and MOLT4 cells treated with DMSO or BSJ-4-116 (50 nM) for indicated hours. (g) Bar plot showing the frequency of retrieved polyadenylation site (PAS) motifs 100bp upstream of the poly(A) 3’-seq peaks. (h) Average metagene profiles of normalized poly(A) 3’-seq reads over gene bodies and extending –2 to +2 kb of all detected genes in Jurkat cells treated with BSJ-4-116 (50 nM) or THZ531 (250 nM) vs DMSO for 8 h. Sense and antisense reads are depicted by solid and dashed lines, respectively. (i) Boxplots showing the differential usage (log2 fold-change) of polyadenylation sites at three different genomic locations. The comparison BSJ-4-116 vs. BSJ-4-116NC is shown in red and THZ531 vs. DMSO is shown in green. (j) Schematic illustration of PCPA caused by CDK12 inhibition or degradation. Data in (b) and (f) are representative of n=2 independent experiments.
Extended Data Figure 3.
Extended Data Figure 3.. BSJ-4-116 inhibits the growth of T-ALL cells and sensitizes them to PARP inhibition.
(a) Cell-cycle analysis of Jurkat and MOLT4 cells treated with BSJ-4-116 (50 nM) and BSJ-4-116NC (100 nM) for 24 h. DNA was stained with propidium iodide (PI) before flow cytometry analysis. G/M% values are presented as mean ± s.d. of n=2 biologically independent samples and are representative of n=2 independent experiments. (b) Excess over Bliss synergy plots for serial dilutions of BSJ-4-116 in combination with Olaparib in CRBN null Jurkat (top) and MOLT4 (bottom) cells. (n=3).
Extended Data Figure 4.
Extended Data Figure 4.. Chronic exposure leads to acquired resistance to BSJ-4-116 mediated by G-loop mutations.
(a) Dose response curves for parental and resistant Jurkat and MOLT4 cells treated with BSJ-4-23 at indicated dose range for 72 h. Percent cell growth relative to DMSO-treated was analyzed using growth rate inhibition assay method. Data are presented as mean ± s.d. of n=3 biologically independent samples. (b) Detection of heterozygous G739S mutation in Jurkat resistant cells. DNA chromatograms of sanger sequencing shows region of mutation from PCR-amplified CDK12 cDNA. (c) Immunoblots for CDK12, CDK9 and GAPDH in parental and resistant Jurkat and MOLT4 cells treated with DMSO, BSJ-4-23 (250 nM), BSJ-4-116 (50 nM) or THAL-SNS-032 (250 nM) for 8 h. Data represent n=2 independent experiments. (d) CDK12 kinase domain structure (PDB code: 5ACB) showing the locations of G-loop mutations I733 and G739
Figure 1.
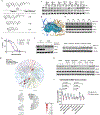
Figure 1.. Development and characterization of CDK12 degrader BSJ-4-116.
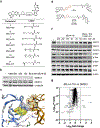
(a) Chemical structures of CDK12 degraders derived from fragment 5 (Extended Data Figure 1). (b) Immunoblots for CDK12, CDK13 and α-tubulin in Jurkat cells after 6 h treatment with DMSO and BSJ-4-23 at indicated concentrations in nanomolar. Data represent n=2 independent experiments. (c) Superposition of CDK13 with modeled CDK12/BSJ-4-23/CRBN ternary complex (CDK12 in blue, PDB ID: 5ACB; CDK13 in grey, PDB ID: 5EFQ; BSJ-4-23 carbons in light grey; CRBN in orange, PDB ID: 4TZ4). The gray and yellow transparent surfaces are for R723 and M730 of CDK13, respectively. The orange mesh is for CRBN Q325 and C394. (d) Chemical structures of a promiscuous kinase degrader TL12–186, a CDK12 degrader BSJ-4-116 (R=H) and its negative control BSJ-4-116NC (R=Me). (e) Immunoblots for CDK12, CDK13, Cyclin K, p-Ser2, p-Thr4, p-Ser5, p-Ser7, Pol II and β-actin in Jurkat cells after 6 h treatment with DMSO, BSJ-4-116, BSJ-4-116NC and THZ531 at the indicated concentrations. Data represent n=2 independent experiments. (f) Proteome-wide selectivity of BSJ-4-116. Quantitative proteomics showing relative abundance of proteins measure by multiplexed quantitative-mass spectrometry-based proteomics in Jurkat cells treated for 8 h with BSJ-4-116 (50 nM) or vehicle (DMSO). CDK12 and CDK13 are marked in red. Proteins marked in blue are a group of non-kinases affected by BSJ-4-116. Dotted lines indicate the threshold for statistically significantly degraded proteins (Log10 (p value) <−2 and Log2 (fold change) <−1). Data are from n = 3 biologically independent samples.
Figure 2.
Figure 2.. CDK12 degradation preferentially leads to premature cleavage and polyadenylation (PCPA) of long genes enriched with DDR genes.
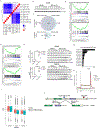
(a) Scatter plot showing log2 fold-changes in gene expression in Jurkat cells treated with BSJ-4-116 (50 nM) vs. THZ531 (250 nM) for 8 h. BSJ-4-116 and THZ531 datasets were normalized to BSJ-4-116NC and DMSO, respectively. Red dot indicated CDK12. (b) Quantification of significantly up- and down-regulated genes in conditions illustrated in panel (a). (c) Scatter plot showing log2 fold-changes in gene expression vs gene length in log2 scale for each protein coding gene in cells treated as in panel (a). (d) Left panel, average metagene profiles of normalized poly(A) 3’-seq reads at the TES (–1 to +4 kb) for all detected in cells treated as in panel (a). Right panel, Wilcoxon test showing significant shift in reads towards in BSJ-4-116- and THZ531-treated (p=0). (e) Left panel, average metagene profiles of normalized poly(A) 3’-seq reads at the TSS (–1 to +10 kb) for all detected in cells treated as in panel (a). Right panel, Wilcoxon test showing significant shift in reads distribution towards positive in BSJ-4-116- and THZ531-treated (p=0).
Figure 3.
Figure 3.. BSJ-4-116 inhibits the growth of T-ALL cells and sensitizes them to PARP inhibition.
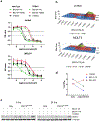
(a) Dose response curves for wild type and CRBN null Jurkat (top) and wild type and CRBN null MOLT4 (bottom) cells treated with BSJ-4-116, BSJ-4-116NC or thz531 at indicated dose range for 72 h. Percent cell growth relative to DMSO-treated was analyzed using growth rate inhibition assay method (see Methods and Materials for details). Data are presented as mean ± s.d. of n=3 biologically independent samples and are representative of n=2 independent experiments. (b) Excess over Bliss synergy plots for serial dilutions of BSJ-4-116 in combination with Olaparib in Jurkat (top) and MOLT4 (bottom) cells. Excess of Bliss score sum >0 indicates synergistic interaction. n=3 replicates. (c) Immunoblots for CDK12 and GAPDH in parental and CDK12C1039F (KellyCDK12CF) expressing Kelly cells treated with DMSO or BSJ-4-23 (250 nM) or BSJ-4-116 (50 nM) for 6 h and 24 h. Data are representative of n=2 independent experiments. (d) Dot plot depicting relative antiproliferative activity of BSJ-4-116, BSJ-4-23 and THZ531 in parental Kelly and KellyCDK12CF cells. GR50 values were obtained using the same protocol as in (a).
Figure 4.
Figure 4.. Chronic exposure leads to acquired resistance to BSJ-4-116 mediated by G-loop mutations.
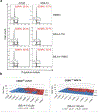
(a) Immunoblots for CDK12 and GPADH in parental and resistant Jurkat and MOLT4 cells treated with BSJ-4-116 and BSJ-4-23 at indicated concentrations for 6 h. Data represent n=2 independent experiments. (b) Dose response curves for parental and resistant Jurkat and MOLT4 cells treated with BSJ-4-116 at indicated dose range for 72 h. Data are presented as mean ± s.d. of n=3 biologically independent samples and are representative of n=2 independent experiments. (c) Detection of heterozygous I733V mutation in MOLT4 resistant cells. DNA chromatograms of sanger sequencing shows region of mutation from PCR-amplified CDK12 cDNA.
Figure 5.
Figure 5.. Chronic exposure leads to acquired resistance to BSJ-4-116 mediated by G-loop mutations.
(a) (b) 32P-labeled ATP CDK12WT/Mut kinase assay. CDK12I733V displayed increased kinase activity (a) and were less efficiently targetable with all compounds tested compared to wild type CDK12 (b). (c) Pulldown assays for CDK12 or cyclin K (Cyc K) and CDK7 with Biotin-THZ1 at indicated doses from parental or resistant Jurkat and MOLT4 cells. Immunoblots showing the relative capacity of THZ1 to enrich CDK12 (or Cyc K as a common surrogate) and CDK7 in parental and resistant cells. 25 μg total protein was loaded as controls for basal expression of CDK12, Cyc K, CDK7 and GAPDH expression. Data represent n=2 independent experiments. (d) NanoBRET live cell ternary complex assays performed in MOLT-4 cells co-expressing HaloTag-CRBN and one of the following C-terminal NanoLuc fusions: CDK12, CDK12 (I733V) or CDK12 (G739S). The fold increase in NanoBRET signal relative to BSJ-4-116NC was plotted after 3hr treatment with the indicated compounds. Data in (a), (b) and (d) are presented as mean ± s.d. of n=6 biologically independent samples and are representative of n=2 independent experiments.

References

    1. Hydbring P, Malumbres M & Sicinski P Non-canonical functions of cell cycle cyclins and cyclin-dependent kinases. Nat Rev Mol Cell Biol 17, 280–292, doi:10.1038/nrm.2016.27 (2016). - DOI - PMC - PubMed
    1. Shiekhattar R et al. Cdk-activating kinase complex is a component of human transcription factor TFIIH. Nature 374, 283–287, doi:10.1038/374283a0 (1995). - DOI - PubMed
    1. Fisher RP Secrets of a double agent: CDK7 in cell-cycle control and transcription. J Cell Sci 118, 5171–5180, doi:10.1242/jcs.02718 (2005). - DOI - PubMed
    1. Galbraith MD, Bender H & Espinosa JM Therapeutic targeting of transcriptional cyclin-dependent kinases. Transcription 10, 118–136, doi:10.1080/21541264.2018.1539615 (2019). - DOI - PMC - PubMed
    1. Gajduskova P et al. CDK11 is required for transcription of replication-dependent histone genes. Nat Struct Mol Biol, doi:10.1038/s41594-020-0406-8 (2020). - DOI - PMC - PubMed

METHODS ONLY REFERENCES

    1. Song Y et al. A dynamic view of the proteomic landscape during differentiation of ReNcell VM cells, an immortalized human neural progenitor line. Sci Data 6, 190016, doi:10.1038/sdata.2019.16 (2019). - DOI - PMC - PubMed
    1. Wessel D & Flügge UI A method for the quantitative recovery of protein in dilute solution in the presence of detergents and lipids. Analytical Biochemistry 138, 141–143, doi:10.1016/0003-2697(84)90782-6 (1984). - DOI - PubMed
    1. Ting L, Rad R, Gygi SP & Haas W MS3 eliminates ratio distortion in isobaric multiplexed quantitative proteomics. Nat Methods 8, 937–940, doi:10.1038/nmeth.1714 (2011). - DOI - PMC - PubMed
    1. McAlister GC et al. MultiNotch MS3 enables accurate, sensitive, and multiplexed detection of differential expression across cancer cell line proteomes. Anal Chem 86, 7150–7158, doi:10.1021/ac502040v (2014). - DOI - PMC - PubMed
    1. Paulo JA et al. Quantitative mass spectrometry-based multiplexing compares the abundance of 5000 S. cerevisiae proteins across 10 carbon sources. J Proteomics 148, 85–93, doi:10.1016/j.jprot.2016.07.005 (2016). - DOI - PMC - PubMed

Publication types