. 2021 Apr;53(4):529-538.
doi: 10.1038/s41588-021-00819-w. Epub 2021 Mar 22.

A first-generation pediatric cancer dependency map

Affiliations

A first-generation pediatric cancer dependency map

Neekesh V Dharia et al. Nat Genet. 2021 Apr.

Abstract

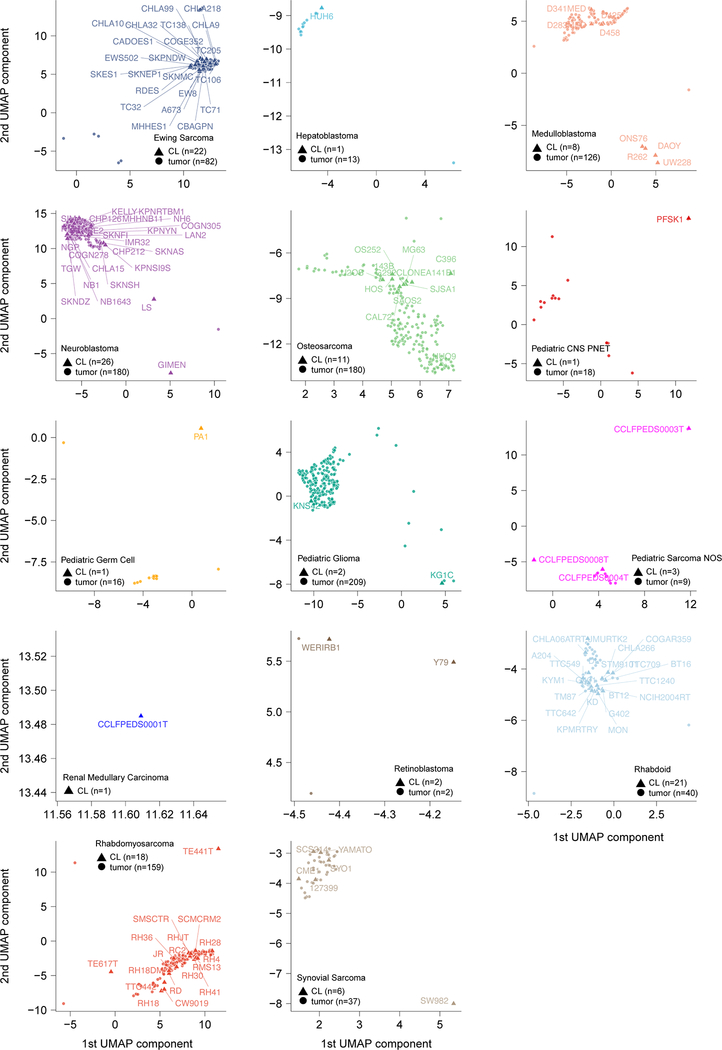
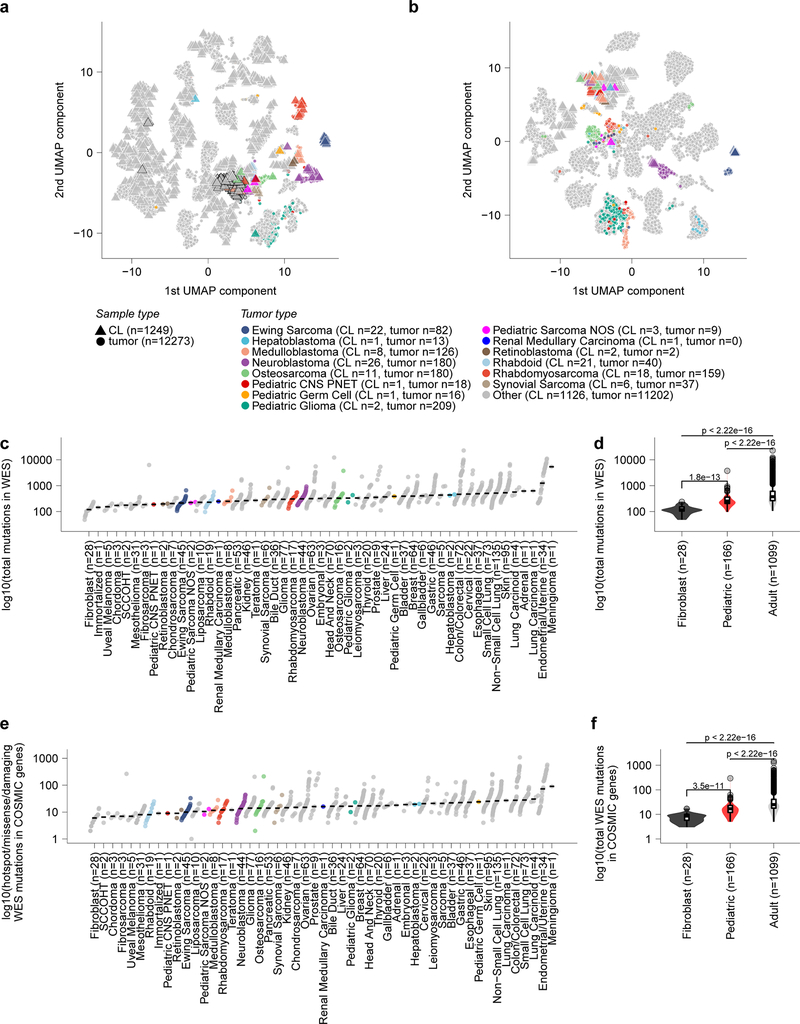
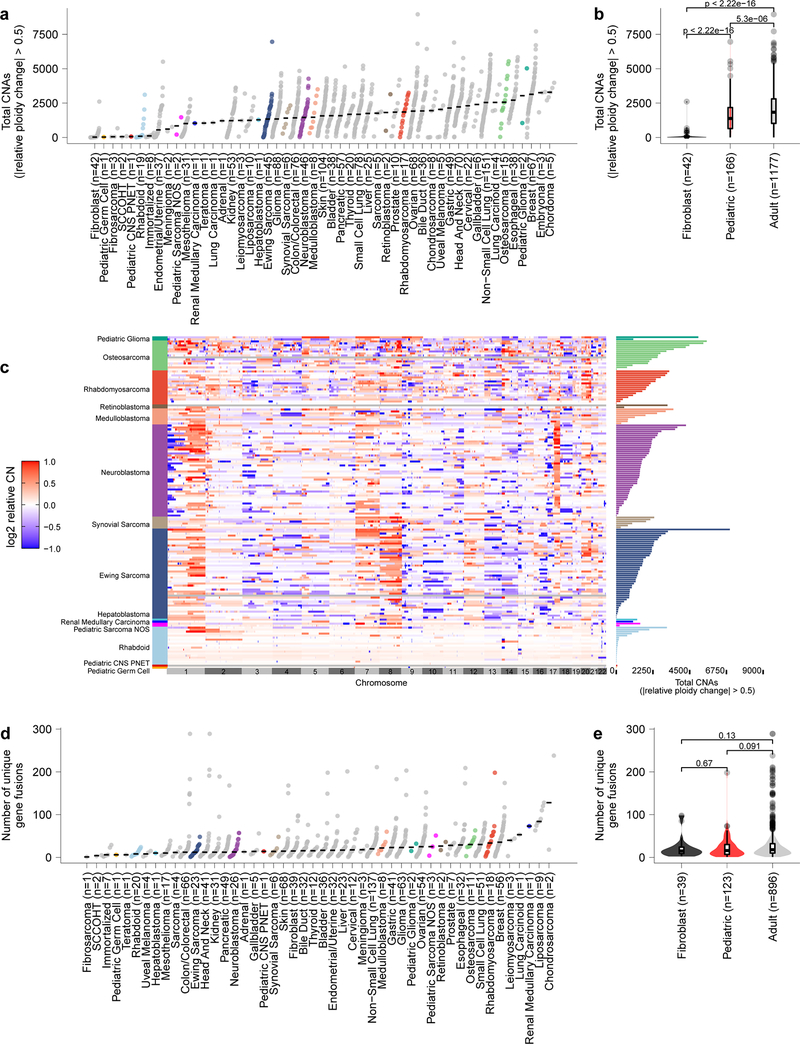
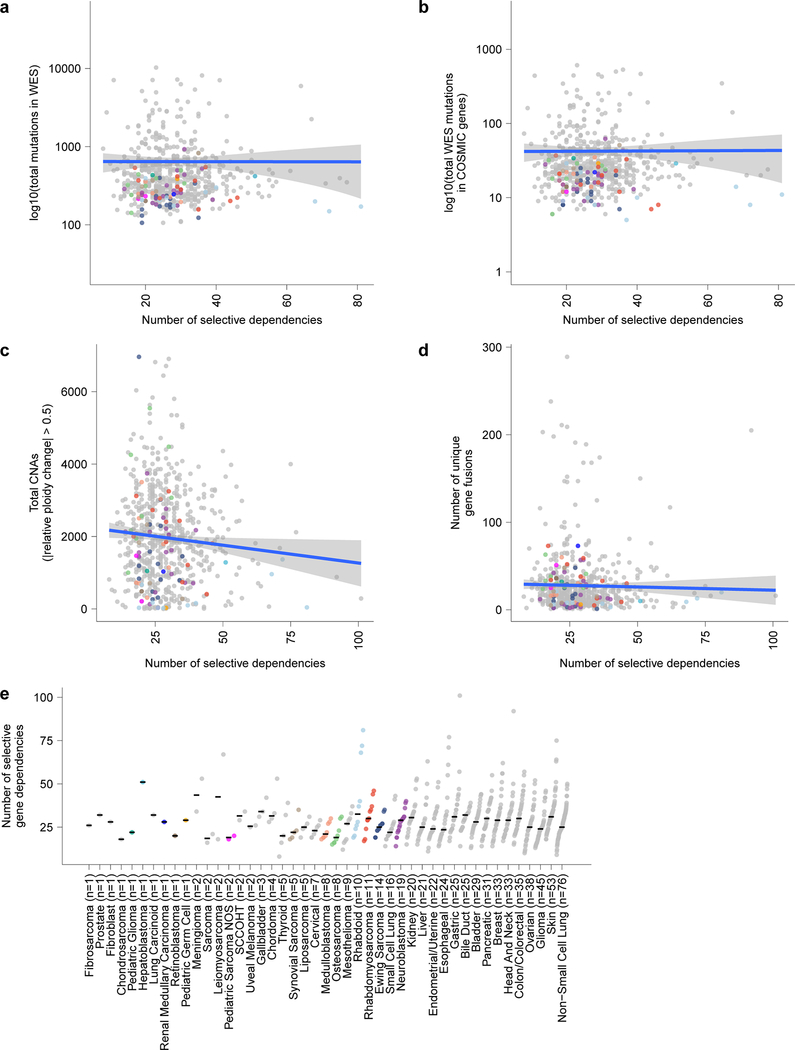
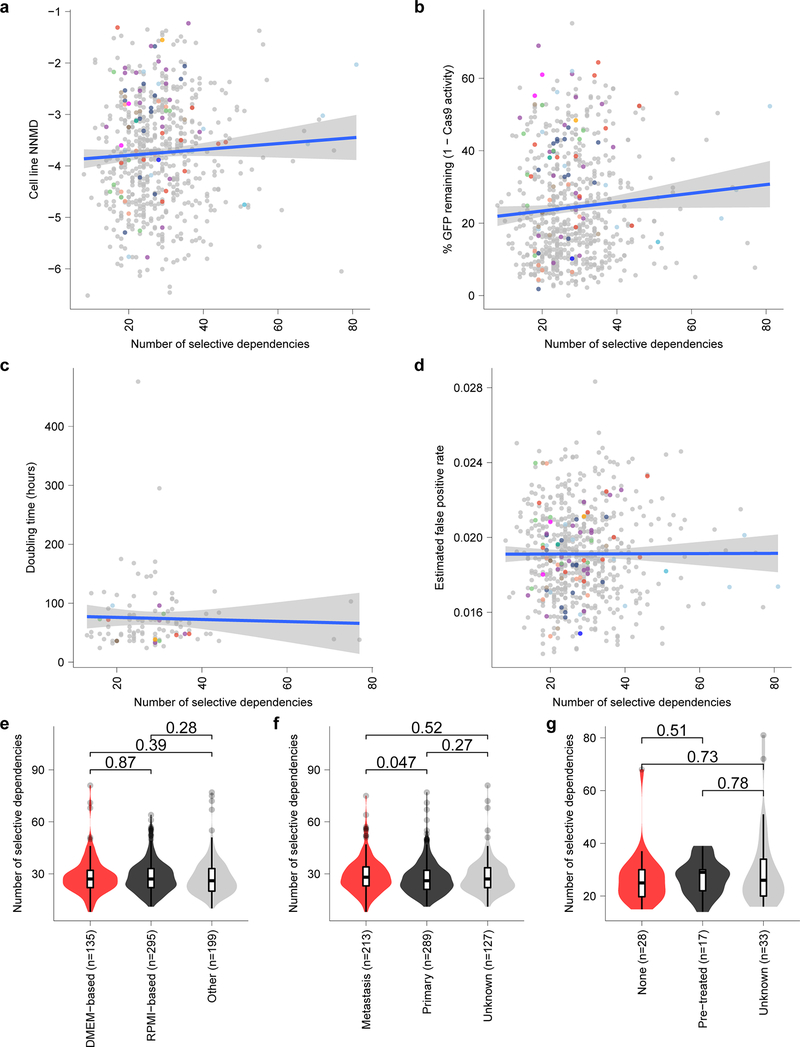
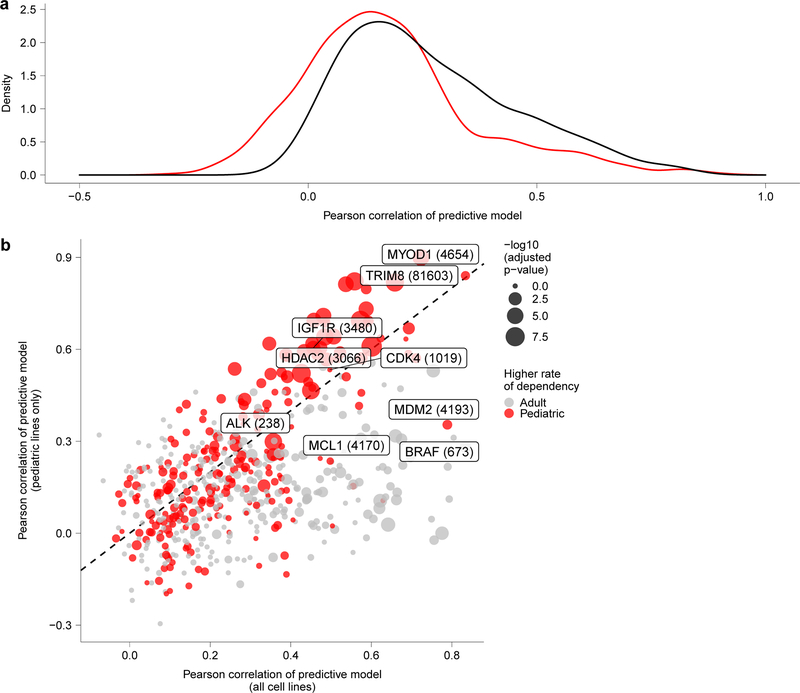
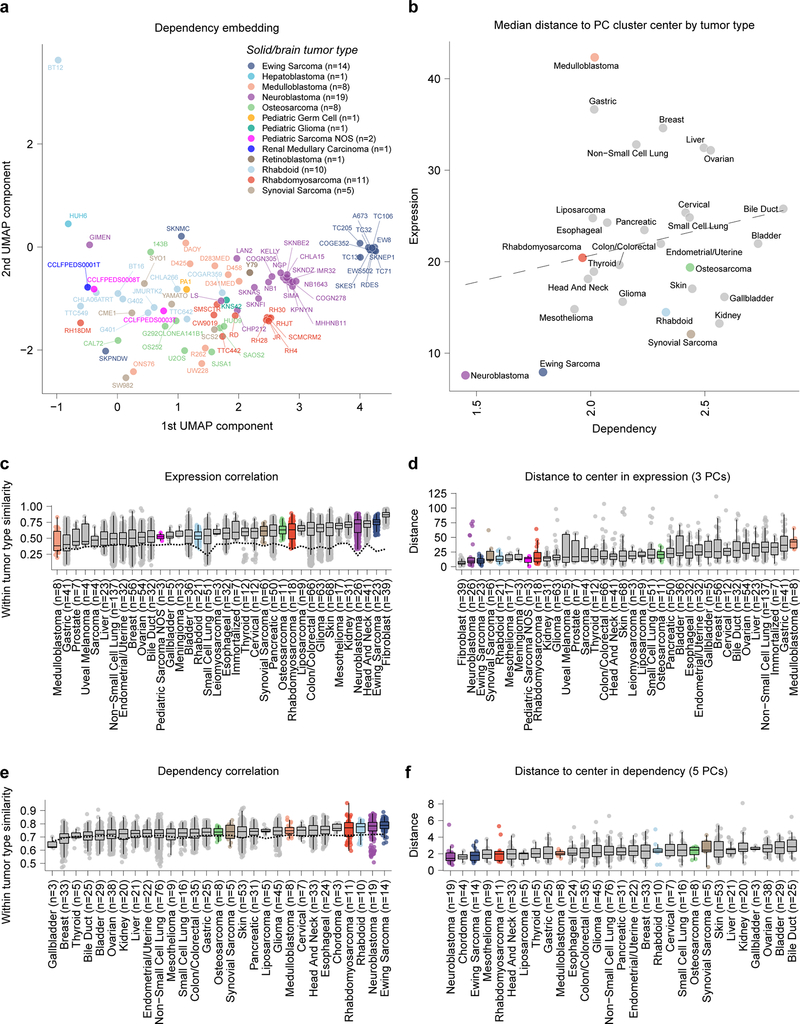
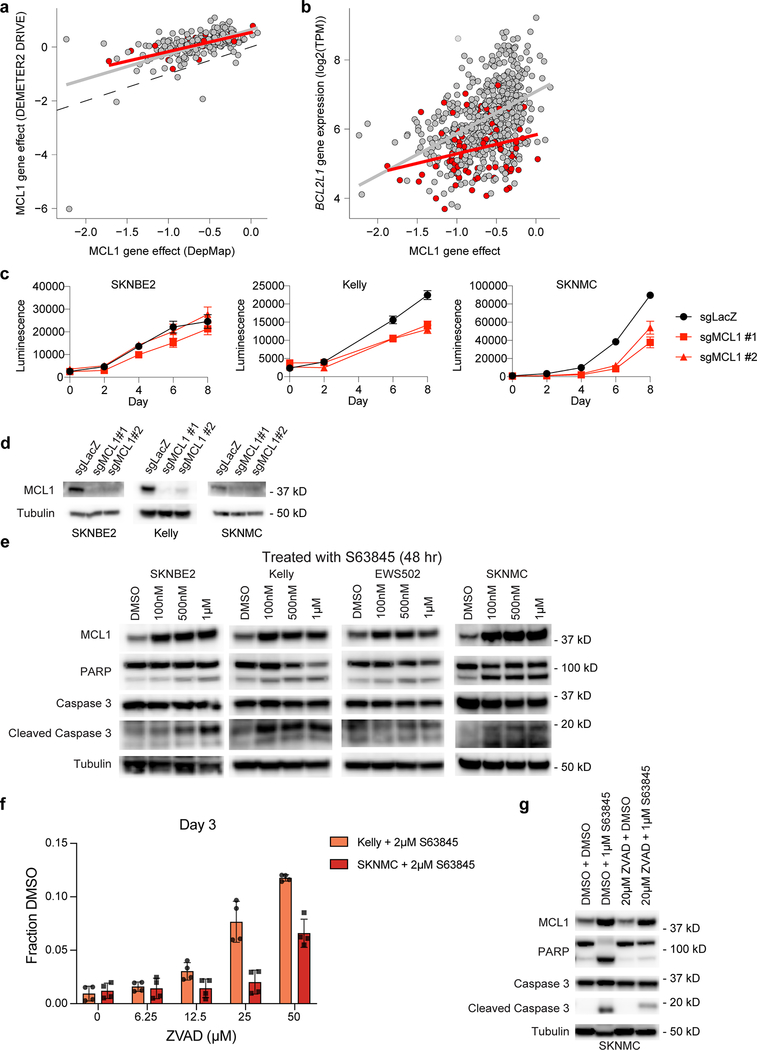
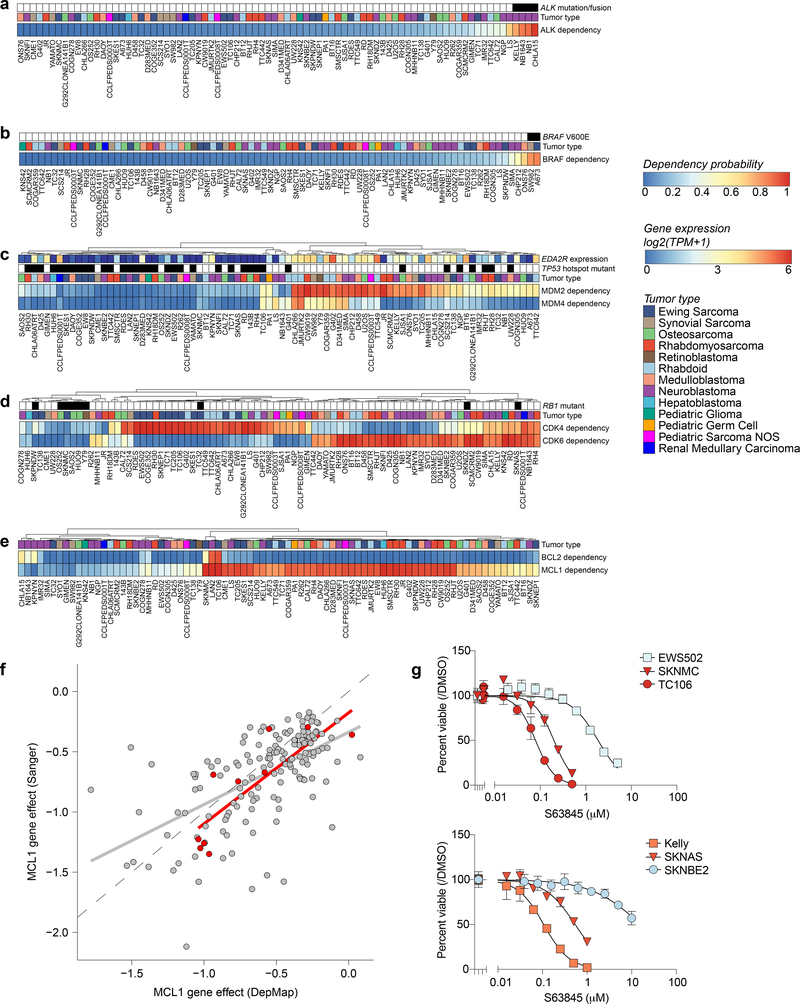
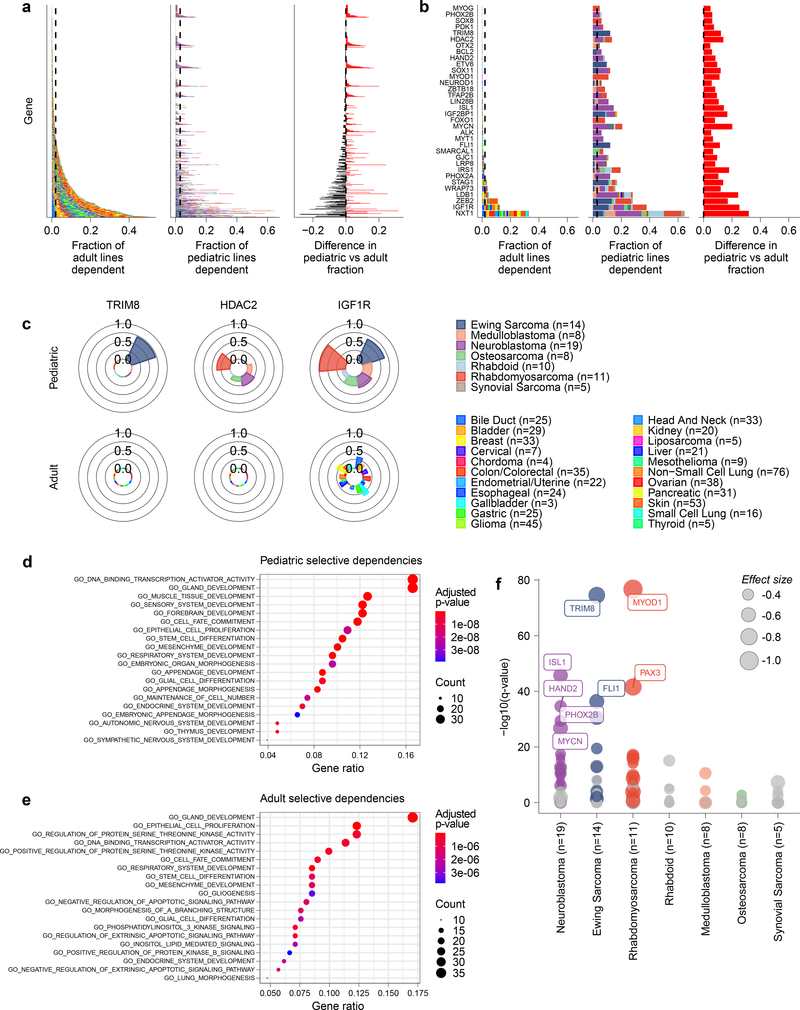
Exciting therapeutic targets are emerging from CRISPR-based screens of high mutational-burden adult cancers. A key question, however, is whether functional genomic approaches will yield new targets in pediatric cancers, known for remarkably few mutations, which often encode proteins considered challenging drug targets. To address this, we created a first-generation pediatric cancer dependency map representing 13 pediatric solid and brain tumor types. Eighty-two pediatric cancer cell lines were subjected to genome-scale CRISPR-Cas9 loss-of-function screening to identify genes required for cell survival. In contrast to the finding that pediatric cancers harbor fewer somatic mutations, we found a similar complexity of genetic dependencies in pediatric cancer cell lines compared to that in adult models. Findings from the pediatric cancer dependency map provide preclinical support for ongoing precision medicine clinical trials. The vulnerabilities observed in pediatric cancers were often distinct from those in adult cancer, indicating that repurposing adult oncology drugs will be insufficient to address childhood cancers.


Figures

Extended Data Fig 1.
Extended Data Fig 1.. Pediatric solid tumor cancer models represent primary tumors.
Two-dimensional representation of RNA-sequencing data using uniform manifold approximation and projection (UMAP) following alignment by Celligner for all primary tumors (triangles) and cancer cell lines (circles) with each cancer type separated for clarity. Cell line names are labelled.
Extended Data Fig 2.
Extended Data Fig 2.. Pediatric solid tumor cancer models represent high-risk disease.
a, Two-dimensional representation of RNA-sequencing data using uniform manifold approximation and projection (UMAP) after alignment by Celligner for primary tumors (triangles) and cancer cell lines (circles). Cell lines and primary tumors that were classified as belonging to the undifferentiated cluster are outlined by a black border. b, Two-dimensional representation of RNA-sequencing data using UMAP prior to alignment by Celligner for primary tumors (triangles) and cancer cell lines (circles). c, The total count of mutations in whole exome sequencing (WES) (y-axis) grouped by solid tumor type (x-axis) with diseases ordered by median burden. d, Number of mutations in WES (y-axis) of pediatric solid tumor cell lines (red, n=166 biologically independent cell lines) compared to adult solid tumor (gray, n=1099 biologically independent cell lines) (p<2.22e−16 by two-sided Wilcoxon test) and fibroblast cell lines (black, n=28 biologically independent cell lines) (p=1.8e−13). e, The count of mutations in WES filtered to only include hotspot, missense or damaging mutations in COSMIC genes (y-axis) grouped by solid tumor type (x-axis) with diseases ordered by median burden. Each circle in panels (c, e) represents an individual cell line with pediatric tumors colored by type; the black line represents the median mutation burden per tumor type. f, Mutations in WES filtered to only include hotspot, missense or damaging mutations in COSMIC genes (y-axis) of pediatric solid tumor cell lines (red, n=166 biologically independent cell lines) compared to adult solid tumor (gray, n=1099 biologically independent cell lines) (p<2.22e−16 by two-sided Wilcoxon test) and fibroblast cell lines (black, n=28 biologically independent cell lines) (p=3.5e−11). Horizontal lines in panels (d, f) demonstrate the median (center) with minima and maxima box boundaries demonstrating the 25 and 75th percentiles. Upper and lower bounds (whiskers) in panels (d, f) represent the 10 and 90th percentiles respectively.
Extended Data Fig. 3.
Extended Data Fig. 3.. Pediatric solid tumors have fewer total copy number events and gene fusions than adult tumor cell lines with expected profiles for disease subtypes.
a, Total number of genes with copy number alterations (CNA) as identified by genes that had a relative change in ploidy of 0.5 is plotted on the y-axis with tumor types along the x-axis. Each circle represents an individual cell line with pediatric tumors colored by type; the black line represents the median number of CNAs per tumor type. Of note, rhabdoid tumors have very few CNAs, consistent with primary patient tumors. b, CNAs (y-axis) in pediatric solid tumor cell lines (red, n=166 biologically independent cell lines) compared to adult solid tumor (gray, n=1177 biologically independent cell lines) (p=5.3e−06 by two-sided Wilcoxon test) and fibroblast cell lines (black, n=42 biologically independent cell lines) (p<2.22e−16). c, Copy number heatmap across the genome for pediatric cancer cell lines demonstrates multiple CNAs in osteosarcoma as expected with few events in rhabdoid tumors. d, Total number of genes fusions per cell line from RNA sequencing is plotted on the y-axis with tumor types along the x-axis. Each circle represents an individual cell line with pediatric tumors colored by type; the black line represents the median number of gene fusions per tumor type. Of note, osteosarcoma cell lines have high numbers of gene fusions, consistent with primary patient tumors. e, Gene fusion calls from RNA sequencing (y-axis) in pediatric solid tumor cell lines (red, n=123 biologically independent cell lines) compared to adult solid and brain tumor (gray, n=896 biologically independent cell lines) and fibroblast cell lines (black, n=39 biologically independent cell lines) by two-sided Wilcoxon test. Horizontal lines in panels (b, e) demonstrate the median (center) with minima and maxima box boundaries demonstrating the 25 and 75th percentiles. Upper and lower bounds (whiskers) in panels (b, e) represent the 10 and 90th percentiles respectively.
Extended Data Fig. 4.
Extended Data Fig. 4.. Selective dependencies in pediatric cell lines and the relationship to mutation burden.
a, Mutational burden count of mutations in whole exome sequencing (WES) (y-axis) compared to the number of selective dependencies per cell line (x-axis) in the screen. b, Mutational burden count of mutations in WES filtered to only include hotspot, missense or damaging mutations in COSMIC genes (y-axis) compared to the number of selective dependencies per cell line (x-axis) in the screen. c, Total number of genes with copy number alterations (CNA) (y-axis) compared to the number of selective dependencies per cell line (x-axis) in the screen. d, Total number of unique gene fusions (y-axis) compared to the number of selective dependencies per cell line (x-axis) in the screen. The circles in panels (a-d) represent individual cell lines with tumor types colored as in panel (e). The blue lines in panels (a-d) represent a linear model fit to this data with the gray shaded area representing the 95% confidence interval around the fit. e, Number of selective dependencies per cell line (y-axis) grouped by tumor type ordered by number of cell lines (x-axis). Each circle represents an individual cell line with pediatric tumors colored by type; the black line represents the median number of selective dependencies per tumor type.
Extended Data Fig. 5.
Extended Data Fig. 5.. Selective dependencies in pediatric cell lines and the relationship to confounders.
a, Screen quality measured by null-normalized mean difference (NNMD) between positive and negative controls (y-axis) compared to number of selective dependencies per cell line (x-axis). b, Cas9 activity expressed as percent of GFP remaining after CRISPR-Cas9-mediated disruption of exogenous GFP (y-axis) compared to number of selective dependencies per cell line (x-axis). c, Cell line doubling time (y-axis) compared to number of selective dependencies per cell line (x-axis). d, Estimated false positive rate calculated as the fraction of genetic dependencies in a cell line that are not expressed in RNA sequencing data (y-axis) compared to the number of selective dependencies per cell line (x-axis). Circles in panels (a-d) represent individual cell lines with tumor types colored as in panel (Extended Data Fig. 4e). Blue lines in panels (a-d) represent a linear model fit to this data with gray shaded area representing the 95% confidence interval around the fit. e, Number of selective dependencies in cell lines cultured in DMEM-based media (red, n=135 biologically independent cell lines), RPMI-based media (black, n=295 biologically independent cell lines), or other media (gray, n=199 biologically independent cell lines). f, Number of selective dependencies per cell line annotated as derived from metastatic samples (red, n=213 biologically independent cell lines), primary tumors (black, n=289 biologically independent cell lines), or unknown (gray, n=127 biologically independent cell lines). g, Number of selective dependencies per pediatric cancer cell line annotated by literature search as derived from a patient with no pre-treatment (“none”, red, n=28 biologically independent cell lines), after treatment (“pre-treated”, black, n=17 biologically independent cell lines), or unknown (gray, n=33 biologically independent cell lines). Horizontal lines in panels (e-g) demonstrate the median (center) with minima and maxima box boundaries demonstrating the 25 and 75th percentiles. Upper and lower bounds (whiskers) in panels (e-g) represent 10 and 90th percentiles respectively.
Extended Data Fig. 6.
Extended Data Fig. 6.. Predictive modeling of dependencies.
a, Distribution of Pearson correlations of predictive modeling of all dependencies in the screen when using all solid or brain cancer cell lines (black) versus using only the pediatric solid or brain tumor cell lines (red) demonstrates better overall performance when considering all cell lines. b, Predictive modeling of selective dependencies across all solid and brain tumor cell lines versus pediatric solid and brain cancer cell lines. The y-axis depicts the Pearson correlation of the predictive model for dependency on a gene when only considering pediatric cancer cell lines, and the x-axis depicts the Pearson correlation of the predictive model for dependency on a gene when only considering all solid or brain cancer cell lines. The size of the points corresponds to the -log10(adjusted p-value) comparing the rates of dependency in pediatric versus adult cancer cell lines with the points colored by whether the rate is higher in pediatric or adult cancer cell lines for a particular genetic dependency.
Extended Data Fig. 7.
Extended Data Fig. 7.. Homogeneity of tumor type in expression space is correlated to homogeneity in dependency space.
a, Two-dimensional representation of selective dependencies using uniform manifold approximation and projection (UMAP) demonstrates clustering of cell lines by tumor type. Each circle represents a cell line with pediatric tumors colored by type and adult tumors not depicted for clarity. b, Median distance from panel (d) (y-axis) compared to median distance from panel (f) (x-axis) demonstrating a trend that tumor types with more homogeneity in expression tend toward more homogeneity in dependency. c, Pairwise Pearson correlation of gene expression of the top 2000 most variable genes across cell line pairs from the same tumor type (y-axis) versus tumor types ordered by median (x-axis). Dotted line represents the median correlation to cell lines not of the same tumor type. d, Distance between each cell line in a tumor type and the center of the tumor type cluster in the first 3 principle components of gene expression of the top 2000 most variable genes (y-axis) versus tumor types ordered by median (x-axis). e, Pairwise Pearson correlation of gene dependency of top 500 most variable dependencies across cell line pairs from the same tumor type (y-axis) versus tumor types ordered by median (x-axis). Dotted line represents median correlation to cell lines not of the same tumor type. f, Distance between each cell line in a tumor type and the center of the tumor type cluster in the first 5 principle components of gene dependency of the top 500 most variable dependencies (y-axis) versus tumor types ordered by median (x-axis). Horizontal lines in panels (c-f) demonstrate the median (center) with minima and maxima box boundaries demonstrating the 25 and 75th percentiles. Upper and lower bounds (whiskers) in panels (c-f) represent the 10 and 90th percentiles respectively.
Extended Data Fig. 8.
Extended Data Fig. 8.. Validation of MCL1 dependency in pediatric cell lines.
a, MCL1 gene effect scores for overlapping cell lines in DepMap 20Q1 (x-axis) and DRIVE RNAi (y-axis) for adult (gray) and pediatric cancer cell lines (red). b, MCL1 gene effect scores (x-axis) versus gene expression of BCL2L1 (y-axis) for adult (gray) and pediatric cancer cell lines (red). Gray and red lines in panels (a-b) represent linear model fits to adult or pediatric data, respectively. c, CRISPR-Cas9 mediated disruption of MCL1 by two independent sgRNAs reveals decreased cell growth in vitro as demonstrated by CellTiter-Glo luminescence (y-axis) versus time (x-axis), correlated with the larger screen. One representative experiment shown for each cell line; each time-point measured in replicate (n=8). Data presented as mean values +/− SEM. d, Western blotting after MCL1 disruption by CRISPR-Cas9 2 days post-selection (SKNBE2, SKNMC) or 3 days post-selection (Kelly). e, Western blotting after MCL1 inhibition with S63845 at 48 hours demonstrates increased protein expression of MCL1 after inhibition with S63845 at 48 hours with less induction of cleaved PARP or Caspase 3 at lower concentrations in SKNBE2 or EWS503 compared to the more sensitive neuroblastoma or Ewing cell lines, Kelly and SKNMC, respectively. f, Treatment with increasing concentrations of ZVAD, a pan-caspase inhibitor, reveals a concentration-dependent rescue of 2 μM S63845 treatment in Kelly and SKNMC at day 3 as demonstrated by the fraction of CellTiter-Glo luminescence compared to DMSO control (y-axis). One representative experiment shown for each cell line; each time-point measured in replicate (n=4). Data presented as mean values +/− SEM. g, Western blotting after one hour of pre-treatment with either DMSO or 20 μM ZVAD followed by either DMSO or 1 μM S63845 treatment at 48 hours show increased protein expression of MCL1 after inhibition with S63845 at 48 hours with decreased induction of cleaved PARP or Caspase 3 following pre-treatment with ZVAD in SKNMC. Experiments shown in panels (c-g) were performed independently at least in duplicate, with one representative experiment shown.
Extended Data Fig. 9.
Extended Data Fig. 9.. Selective and enriched dependencies in pediatric and adult solid tumor lines.
a, The frequency of dependency on the neuroblastoma core regulatory transcription factors (ISL1, HAND2, GATA3, PHOX2A, PHOX2B) and rhabdomyosarcoma regulatory transcription factors (MYOD1) are depicted in pediatric and adult solid tumor types with at least 3 cell lines screened per type in polar bar graphs. The tumor types are colored as in the legend. The neuroblastoma transcription factor dependencies were seen uniquely in neuroblastoma and MYOD1 dependency was seen in rhabdomyosarcoma. b, Feature importance for the predictive models of HDAC2 dependency using data from all solid and brain tumor cell lines (left) or pediatric solid and brain cancer cell lines only (right). The y-axis shows the feature importance as calculated by the predictive model with features listed on the x-axis. c, Feature importance for the predictive models of HDAC2 dependency using data from all solid and brain tumor cell lines (left) or pediatric solid and brain cancer cell lines only (right). The y-axis shows the feature importance as calculated by the predictive model with features listed on the x-axis.
Extended Data Fig. 10.
Extended Data Fig. 10.. Selective and enriched dependencies in pediatric and adult solid tumor lines.
a, Quantification of tumor type-enriched dependencies per tumor-type (y-axis) compared to number of cell lines screened per tumor type (x-axis). The number of enriched dependencies per tumor type with a q-value <0.05 was calculated by performing a two-class comparison between gene effect scores in each tumor type compared to all other cell lines screened using two-sided t-tests with Benjamini-Hochberg correction. b, Quantification of tumor type-enriched dependencies that are also classified as selective dependencies in the screen per tumor-type (y-axis) compared to number of cell lines screened per tumor type (x-axis). The number of enriched dependencies per tumor type with a q-value <0.05 was calculated by performing a two-class comparison between gene effect scores in each tumor type compared to all other cell lines screened using two-sided t-tests with Benjamini-Hochberg correction. Each circle in panels (a-b) represents a tumor type colored as in the legend. The blue lines in panels (a-b) represent a linear model fit to this data with the gray shaded area representing the 95% confidence interval around the fit. c, Tumor type-enriched dependencies in all solid and brain tumor types with more than 2 cell lines. Plotted on the y-axis is -log10 of the q-value of enrichment as calculated by performing a two-class comparison between gene effect scores in each tumor type compared to all other cell lines screened using two-sided t-tests with Benjamini-Hochberg correction. Tumor types are plotted along the x-axis. The size of the circles reflects the mean difference in dependency score between the tumor type and all other cell lines screened. Gray circles are enriched dependencies in a tumor type that are not classified as transcription factors and colored circles are transcription factor dependencies in the screen.
Fig 1.
Fig 1.. Pediatric solid tumor cancer models represent high-risk disease.
a, Overview of pediatric cancer cell line models screened in the Dependency Map project with genome-scale CRISPR-Cas9 with genomic characterization derived from whole exome and RNA sequencing. Genes and chromosomal arms highlighted are those that have been reported as commonly mutated or copy number altered in the pediatric tumor types shown,–. b, Two-dimensional representation of RNA-sequencing data (after removing systematic tumor/cell line differences using the Celligner method) using uniform manifold approximation and projection (UMAP) demonstrates high concordance between primary tumors (triangles) and cancer cell lines (circles) for pediatric tumor types. An interactive version of this plot is available at depmap.org/peddep. c, Mutational rates as mutations per megabase (MB) in whole exome sequencing as calculated using MutSig2CV (y-axis) grouped by solid tumor type (x-axis) with diseases ordered by median burden. Each circle represents an individual cell line with pediatric tumors colored by type; the black line represents the median mutation rate per tumor type. d, Pediatric solid tumor cell lines, including brain tumors (red, n=160 biologically independent cell lines), had significantly lower mutation rates (y-axis) as a whole compared to adult solid tumor lines (gray, n=1085 biologically independent cell lines) (p<2.22e−16) by two-sided Wilcoxon test, while fibroblast cell lines (black, n=28 biologically independent cell lines) had the lowest mutation rates compared to pediatric (p = 5.3e−13) or adult solid tumors (p<2.22e−16). Horizontal lines demonstrate the median (center) with minima and maxima box boundaries demonstrating the 25 and 75th percentiles. Upper and lower bounds (whiskers) represent the 10 and 90th percentiles respectively.
Fig 2.
Fig 2.. Cancer cell line selective dependencies are not correlated with mutation burden.
a, Example score distributions of genes that were non-essential (OR6S1), common essential (TOP2A), and a selective dependency (ISL1, with normLRT of 290) in the genome-scale CRISPR-Cas9 screen. The y-axis represents the cell line distribution with the x-axis representing CRISPR gene effect scores. Individual scores for cell lines screened (n=612) are indicated by the symbols depicted below the x-axis. b, Mutational burden as detected by whole exome sequencing by MutSig2CV in mutations per megabase (MB) compared to the number of selective dependencies per cell line in the screen. The y-axis depicts mutation rate per cell line and the x-axis the number of selective dependencies per cell line. The circles represent individual cell lines with type colored as in panel (c). The blue line represents a linear model fit to this data with Pearson correlation 0.01 with the gray shaded area representing the 95% confidence interval around the fit. c, Number of selective gene dependencies per cell line (on y-axis) grouped by tumor type ordered by median (x-axis). Each circle represents an individual cell line with pediatric tumors colored by type; the black line represents the median number of dependencies per tumor type. d, Pediatric solid and brain tumor cell lines (red, n=82 biologically independent cell lines) did not have a statistically different distribution of selective dependencies (y-axis) as a whole compared to adult solid tumor lines (gray, n=573 biologically independent cell lines) by two-sided Wilcoxon test. Horizontal lines demonstrate the median (center) with minima and maxima box boundaries demonstrating the 25 and 75th percentiles. Upper and lower bounds (whiskers) represent the 10 and 90th percentiles respectively. e, Predictive modeling of selective dependencies across all solid and brain tumor cell lines. The y-axis depicts the Pearson correlation of the predictive model for dependency on a gene, and the x-axis shows fraction of cancer cell lines that are dependent on a gene. The size of the points corresponds to the fraction of pediatric cancer cell lines that are dependent on a gene. The red color highlights examples of genes that pediatric cancers are frequently dependent on (MCL1, CDK4), genes with strong predictive models (BRAF, MDM2), or genes with low rates of dependency and poor predictive models (ALK). f, Two-dimensional representation of selective dependencies (removing genes that did not have dependency scores for all cell lines screened) using uniform manifold approximation and projection (UMAP) demonstrates strong clustering of Ewing sarcoma, neuroblastoma and rhabdomyosarcoma by tumor type. Each circle represents a cell line with pediatric tumors colored by type.
Fig 3.
Fig 3.. Genetic dependencies and potential therapeutic targeting.
For each genetic dependency, the heatmap indicates the probability of dependency of each cell line with a probability greater than 0.5 considered dependent. When multiple genes are plotted per heatmap, hierarchical clustering was performed. a, Three pediatric solid tumor cell lines demonstrate mutations or fusions in ALK and these cell lines are among the most dependent on ALK. Of note, the neuroblastoma cell line NB1 is also dependent on ALK and harbors an amplification of the gene. b, Two pediatric solid tumor cell lines demonstrate BRAF V600E mutations and these cell lines are BRAF dependent. c, Correlation between MDM2 and/or MDM4 dependency and TP53 hotspot mutations as well as EDA2R expression. d, RB1 mutation status is predictive of CDK4 or CDK6 dependency. Depicted here are all RB1 mutations. TC32 is known to have a heterozygous mutation in RB1 and thus has functional RB1. e, Neuroblastoma cell lines demonstrate dependency on BCL2 while the majority of pediatric solid tumor cell lines are dependent on MCL1. f, Correlation of MCL1 gene effect scores for overlapping cell lines DepMap 20Q1 and Sanger genome-scale CRISPR-Cas9 screen with an independent guide library. Adult cancer cell lines are colored gray while pediatric cancer cell lines are red. The gray and red line represent a linear model fit to the adult or pediatric data. g, Treatment with S63845, a selective MCL1 inhibitor, for four days in Ewing sarcoma (top) and neuroblastoma (bottom) cell lines demonstrates relative sensitivity consistent with dependency scores. The y-axis represents percent viable cells as compared to controls treated with DMSO for each experiment. The x-axis represents concentrations of inhibitor (μM). The data points for each cell line are colored by the probability of dependency on MCL1 with the same colors as the heatmap in (e). One representative experiment is shown for each cell line; each was performed in triplicate (n=3). Data are presented as mean values +/− standard error of mean (SEM).
Fig 4.
Fig 4.. Selective dependencies in pediatric and adult solid tumor lines.
a, Selective dependency genes demonstrate subsets that are more common in pediatric compared to adult cancer cell lines. Each row on the y-axis represents one of the selective dependencies (removing common essential and non-essential genes) ordered across the three subpanels by rate of dependency seen in adult cancer cell lines. The left subpanel shows the rate at which adult cell lines are dependent (x-axis) and the center subpanel shows the rate at which pediatric cancer cell lines are dependent (x-axis). The right subpanel demonstrates the difference in rate of dependency in pediatric versus adult cancer cell lines (x-axis) with dependencies seen at greater frequency in pediatric cell lines colored red and those seen more frequently in adult cell lines as black. The bars in the center and right panels are colored by the contribution of each tumor type as shown in the legend. b, Thirty-four selective dependencies were significantly more common in the pediatric cell lines compared to adult cell lines (adjusted p-value <0.05 by two-sided Fisher’s exact test with Benjamini-Hochberg correction). The subpanels are arranged and colored as in panel (a). Notably, several selective dependencies were not seen in adult solid tumor cell lines and were unique to pediatric solid tumors. c, The frequency of dependency on TRIM8, HDAC2 and IGF1R are depicted in pediatric and adult solid tumor types with at least 3 cell lines screened per type in polar bar graphs. The heights of the bars correspond to the fraction of cell lines of a particular tumor type that are dependent on the gene. The tumor types are colored as in the legend. TRIM8 dependency was seen uniquely in Ewing sarcoma and no other tumor types screened. HDAC2 dependency was seen only in pediatric cell lines but across several tumor types in contrast to none of the adult solid tumor lines. IGF1R dependency was seen across adult and pediatric solid tumors but with greater frequency in pediatric tumors. d, Gene set enrichment analysis (GSEA) of selective dependencies present in >2% of pediatric cell lines using the gene ontology C5 collection from MSigDB identifies enrichment of developmental pathways. On the y-axis are the 20 gene sets with the highest overlap with the query set, plotted on the x-axis. e, GSEA of selective dependencies present in >2% of adult cancer cell lines using the C5 collection demonstrates enrichment of several signaling pathways. On the y-axis are the 20 gene sets with the highest overlap with the query set, plotted on the x-axis. f, Tumor type-enriched dependencies in pediatric tumor types with more than 2 cell lines. Plotted on the y-axis is -log10 of the q-value of enrichment as calculated by performing a two-class comparison between gene effect scores in each tumor type compared to all other cell lines screened using two-sided t-tests with Benjamini-Hochberg correction. Pediatric tumor types are plotted along the x-axis. The size of the circles reflects the mean difference in dependency score between the tumor type and all other cell lines screened. Gray circles are enriched dependencies in a tumor type that are not classified as selective and colored circles are selective dependencies in the screen.

References

    1. Park JR et al. A phase III randomized clinical trial (RCT) of tandem myeloablative autologous stem cell transplant (ASCT) using peripheral blood stem cell (PBSC) as consolidation therapy for high-risk neuroblastoma (HR-NB): A Children’s Oncology Group (COG) study. JCO 34, LBA3–LBA3 (2016).
    1. Northcott PA et al. Medulloblastoma comprises four distinct molecular variants. J. Clin. Oncol 29, 1408–1414 (2011). - PMC - PubMed
    1. Cho Y-J et al. Integrative genomic analysis of medulloblastoma identifies a molecular subgroup that drives poor clinical outcome. J. Clin. Oncol 29, 1424–1430 (2011). - PMC - PubMed
    1. Dome JS et al. Children’s Oncology Group’s 2013 blueprint for research: renal tumors. Pediatr Blood Cancer 60, 994–1000 (2013). - PMC - PubMed
    1. Weigel BJ et al. Intensive Multiagent Therapy, Including Dose-Compressed Cycles of Ifosfamide/Etoposide and Vincristine/Doxorubicin/Cyclophosphamide, Irinotecan, and Radiation, in Patients With High-Risk Rhabdomyosarcoma: A Report From the Children’s Oncology Group. J. Clin. Oncol 34, 117–122 (2016). - PMC - PubMed

Online Methods References

    1. DepMap B DepMap 20Q1 Public. (2020). doi:10.6084/m9.figshare.11791698.v3 - DOI
    1. Cibulskis K et al. Sensitive detection of somatic point mutations in impure and heterogeneous cancer samples. Nature biotechnology 31, 213–219 (2013). - PMC - PubMed
    1. Cibulskis K et al. ContEst: estimating cross-contamination of human samples in next-generation sequencing data. Bioinformatics 27, 2601–2602 (2011). - PMC - PubMed
    1. Saunders CT et al. Strelka: accurate somatic small-variant calling from sequenced tumor-normal sample pairs. Bioinformatics 28, 1811–1817 (2012). - PubMed
    1. Costello M et al. Discovery and characterization of artifactual mutations in deep coverage targeted capture sequencing data due to oxidative DNA damage during sample preparation. Nucleic Acids Res 41, e67–e67 (2013). - PMC - PubMed

Publication types

MeSH terms

Substances