

Mutational spectrum and precision oncology for biliary tract carcinoma
- PMID: 33754015
- PMCID: PMC7978308
- DOI: 10.7150/thno.56539
Mutational spectrum and precision oncology for biliary tract carcinoma
Abstract
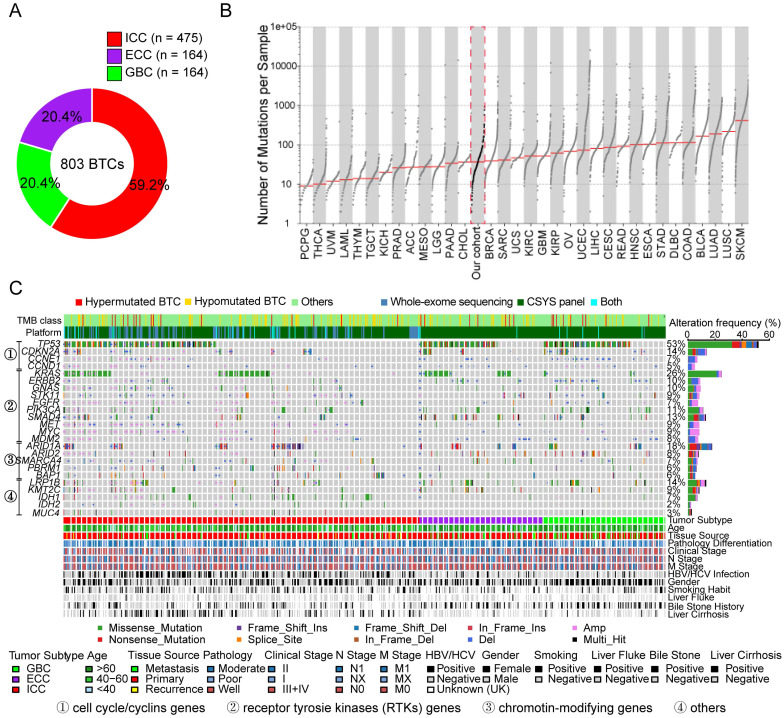
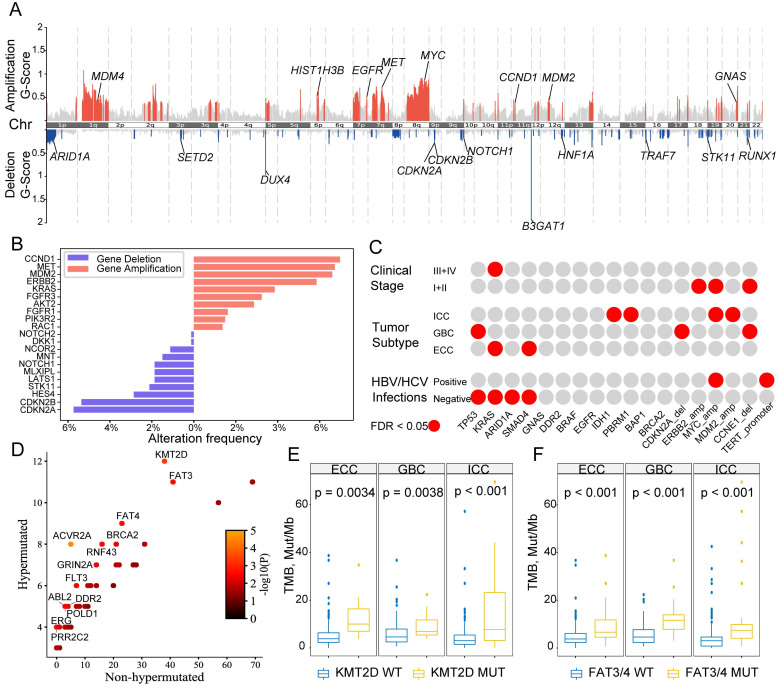
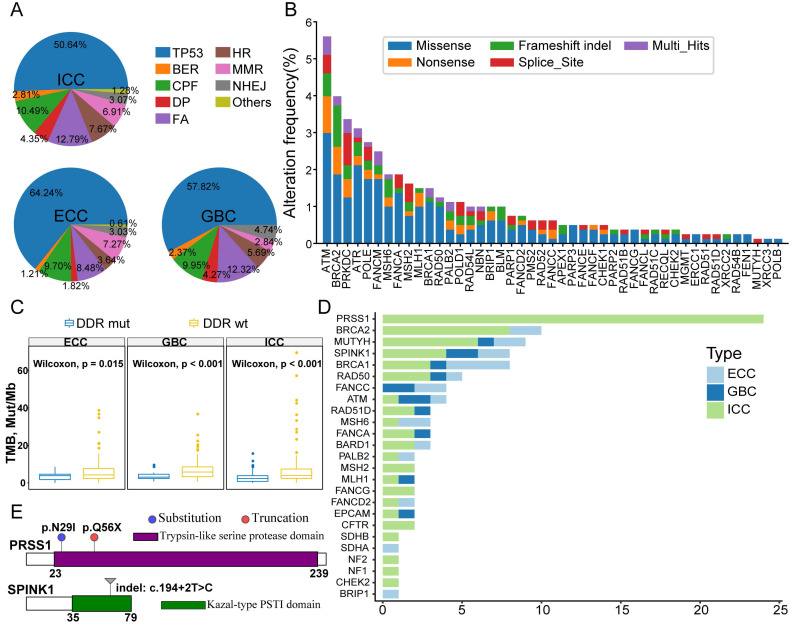
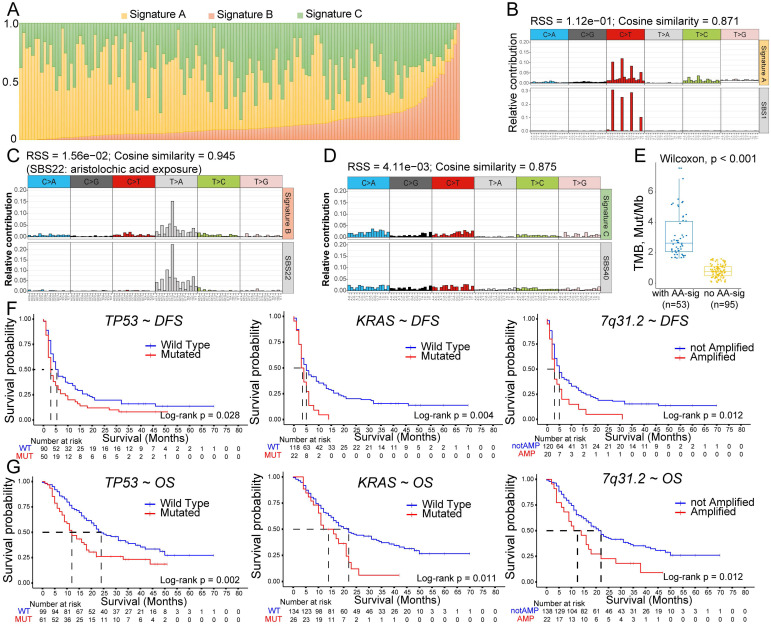
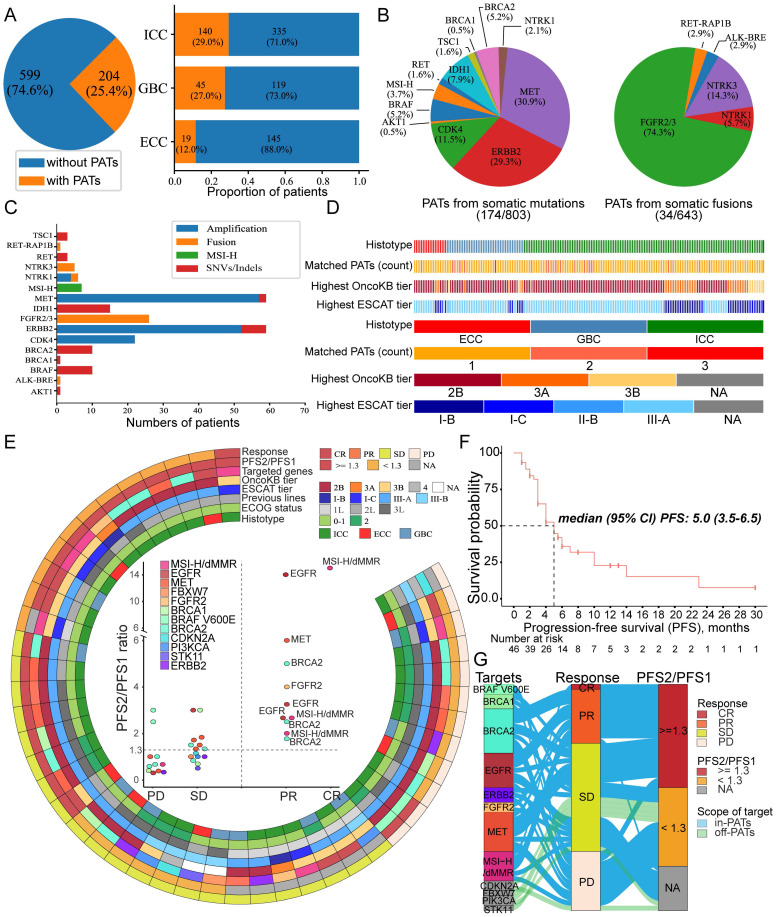
Background: The genomic spectrum of biliary tract carcinoma (BTC) has been characterized and is associated with distinct anatomic and etiologic subtypes, yet limited studies have linked genomic alterations with personalized therapies in BTC patients. Methods: This study analyzed 803 patients with BTC:164 with gallbladder cancer, 475 with intrahepatic cholangiocarcinoma (ICC) and 164 with extrahepatic cholangiocarcinoma. We determined genomic alterations, mutational signatures related to etiology and histopathology and prognostic biomarkers. Personalized targeted therapies for patients harboring potentially actionable targets (PATs) were investigated. Results: The median tumor mutation burden (TMB) was 1.23 Mut/Mb, with 4.1% of patients having hypermutated BTCs. Unlike the results obtained from the Western population, the most frequently altered cancer-related genes in our cohort included TP53 (53%), KRAS (26%), ARID1A (18%), LRP1B (14%) and CDKN2A (14%). Germline mutations occurred mostly in DNA damage repair genes. Notably, 35.8% of the ICCs harbored aristolochic acid related signatures and an elevated TMB. TP53 and KRAS mutations and amplified 7q31.2 were demonstrated to negatively affect patient prognosis. Moreover, 19 genes were proposed to be PATs in BTCs, with 25.4% of patients harboring these PATs. Forty-six patients received PAT-matched targeted therapies, achieving a 26.1% objective response rate; the median progression-free survival (PFS) was 5.0 months, with 56.8% of patients obtaining PFS benefits. Conclusions: Extensive genomic diversity and heterogeneity were observed among BTC patients, with contributions according to potential etiology exposures, anatomical subtypes and clinicopathological characteristics. We also demonstrated that patients with refractory BTCs who have PATs can derive considerable benefit from receiving a matched therapy, initiating further prospective clinical trials guided by molecular profiling among this aggressive cancer.
Keywords: biliary tract cancer; genomic alterations; molecular screening; precision medicine; targeted therapy.
© The author(s).
Conflict of interest statement
Competing Interests: Kai Wang has ownership interest (including stock, patents, etc.) in OrigiMed. Henghui Zhang has ownership interest (including stock, patents, etc.) in Genecast Precision Medicine Technology Institute. No potential conflicts of interest were disclosed by the other authors.
Figures
Similar articles
-
Clinical, Genomic, and Transcriptomic Data Profiling of Biliary Tract Cancer Reveals Subtype-Specific Immune Signatures.JCO Precis Oncol. 2022 Jun;6:e2100510. doi: 10.1200/PO.21.00510. JCO Precis Oncol. 2022. PMID: 35675577 Free PMC article.
-
Therapeutic relevance of targeted sequencing in management of patients with advanced biliary tract cancer: DNA damage repair gene mutations as a predictive biomarker.Eur J Cancer. 2019 Oct;120:31-39. doi: 10.1016/j.ejca.2019.07.022. Epub 2019 Aug 30. Eur J Cancer. 2019. PMID: 31476489
-
Genetic Determinants of Outcome in Intrahepatic Cholangiocarcinoma.Hepatology. 2021 Sep;74(3):1429-1444. doi: 10.1002/hep.31829. Hepatology. 2021. PMID: 33765338 Free PMC article.
-
Systemic treatment of advanced or recurrent biliary tract cancer.Biosci Trends. 2020 Nov 4;14(5):328-341. doi: 10.5582/bst.2020.03240. Epub 2020 Aug 24. Biosci Trends. 2020. PMID: 32830166 Review.
-
Targeted therapies in advanced biliary tract cancers-a narrative review.Chin Clin Oncol. 2023 Apr;12(2):14. doi: 10.21037/cco-22-93. Epub 2023 Mar 13. Chin Clin Oncol. 2023. PMID: 36946186 Free PMC article. Review.
Cited by
-
KRAS acting through ERK signaling stabilizes PD-L1 via inhibiting autophagy pathway in intrahepatic cholangiocarcinoma.Cancer Cell Int. 2022 Mar 19;22(1):128. doi: 10.1186/s12935-022-02550-w. Cancer Cell Int. 2022. PMID: 35305624 Free PMC article.
-
Current Status of Targeted Therapy for Biliary Tract Cancer in the Era of Precision Medicine.Cancers (Basel). 2024 Feb 22;16(5):879. doi: 10.3390/cancers16050879. Cancers (Basel). 2024. PMID: 38473240 Free PMC article. Review.
-
Genetic alterations of KRAS and TP53 in intrahepatic cholangiocarcinoma associated with poor prognosis.Open Life Sci. 2023 Jul 17;18(1):20220652. doi: 10.1515/biol-2022-0652. eCollection 2023. Open Life Sci. 2023. PMID: 37483430 Free PMC article.
-
Whole exome sequencing of multi-regions reveals tumor heterogeneity in Opisthorchis viverrini-associated cholangiocarcinoma.Sci Rep. 2025 Mar 29;15(1):10886. doi: 10.1038/s41598-025-95142-3. Sci Rep. 2025. PMID: 40157958 Free PMC article.
-
Immune-related RNA signature predicts outcome of PD-1 inhibitor-combined GEMCIS therapy in advanced intrahepatic cholangiocarcinoma.Front Immunol. 2022 Sep 9;13:943066. doi: 10.3389/fimmu.2022.943066. eCollection 2022. Front Immunol. 2022. PMID: 36159865 Free PMC article.
References
-
- Bertuccio P, Malvezzi M, Carioli G. et al. Global trends in mortality from intrahepatic and extrahepatic cholangiocarcinoma. J Hepatol. 2019;71:104–14. - PubMed
-
- Marinelli I, Guido A, Fuccio L. et al. Clinical Target Volume in Biliary Carcinoma: A Systematic Review of Pathological Studies. Anticancer Res. 2017;37:955–61. - PubMed
Publication types
MeSH terms
Substances
LinkOut - more resources
Full Text Sources
Other Literature Sources
Medical
Research Materials
Miscellaneous
