. 2021 Mar 4;11(10):4599-4615.
doi: 10.7150/thno.55655. eCollection 2021.

The histone acetyltransferase HBO1 functions as a novel oncogenic gene in osteosarcoma

Affiliations

The histone acetyltransferase HBO1 functions as a novel oncogenic gene in osteosarcoma

Yan-Yang Gao et al. Theranostics. .

Abstract

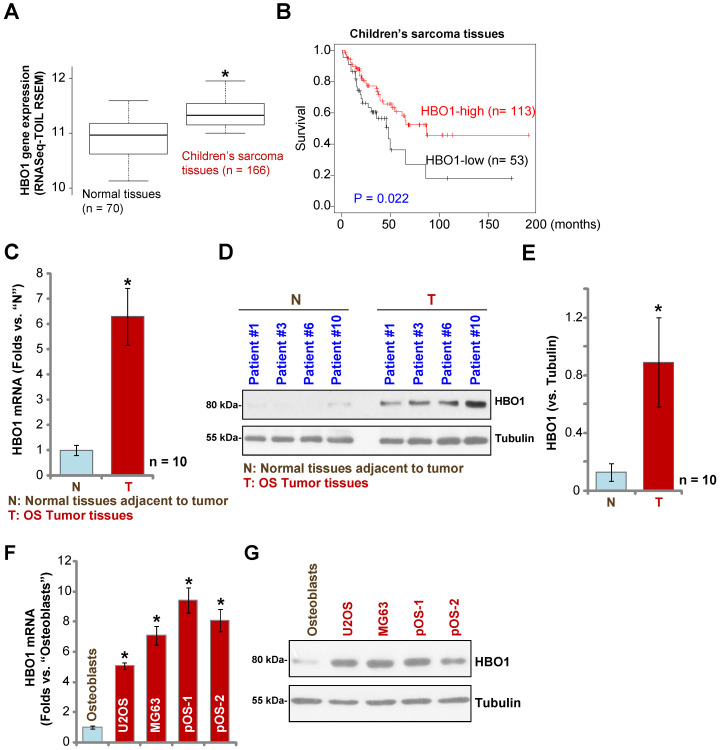
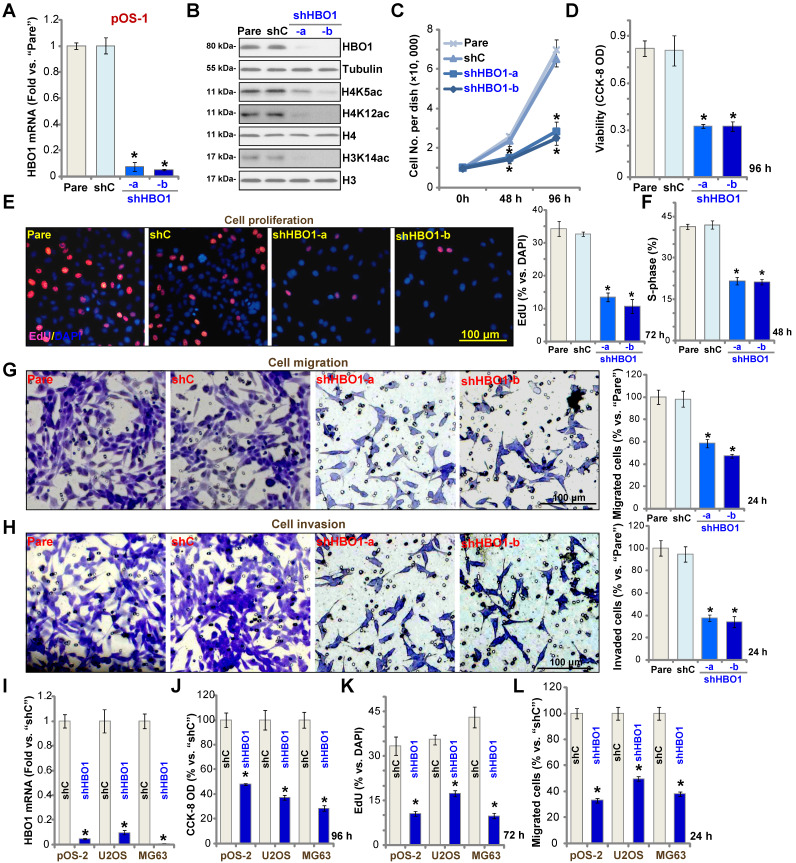
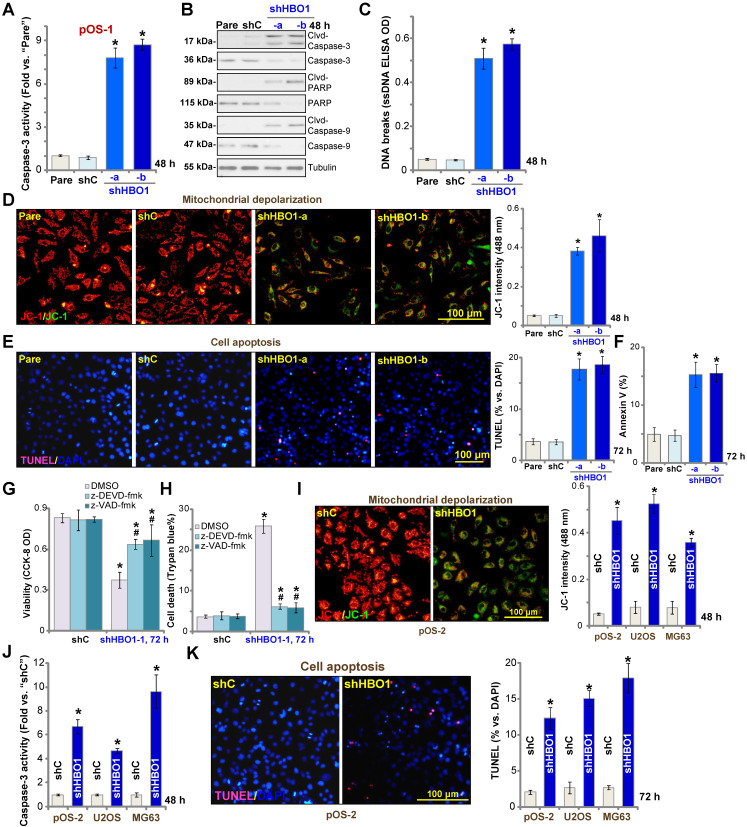
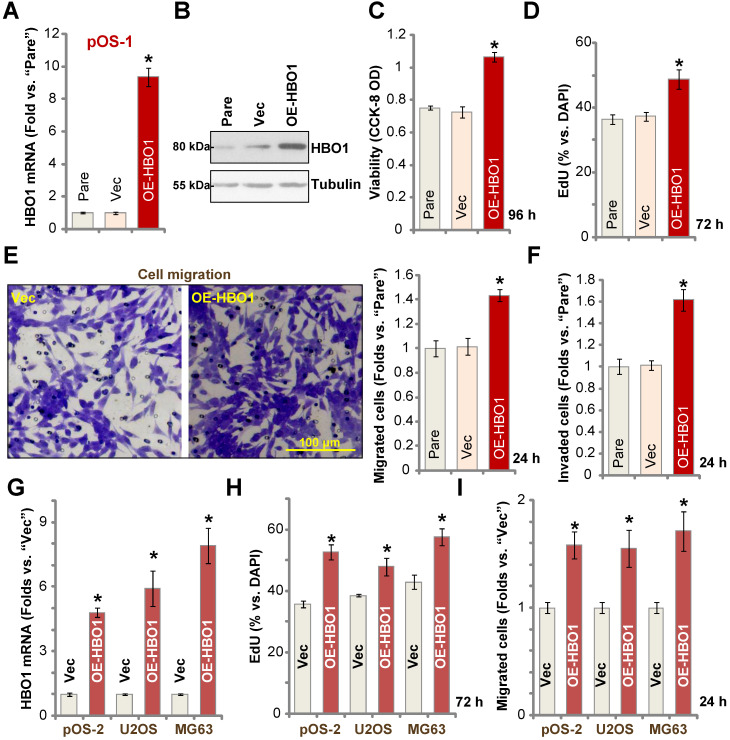
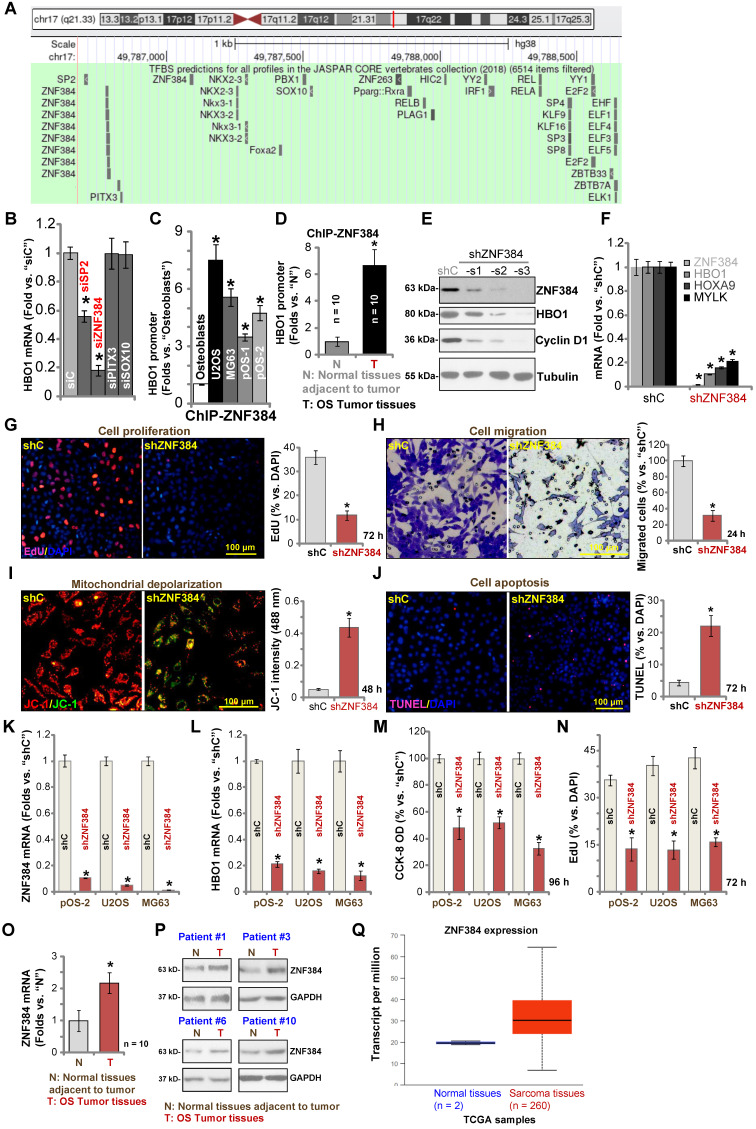
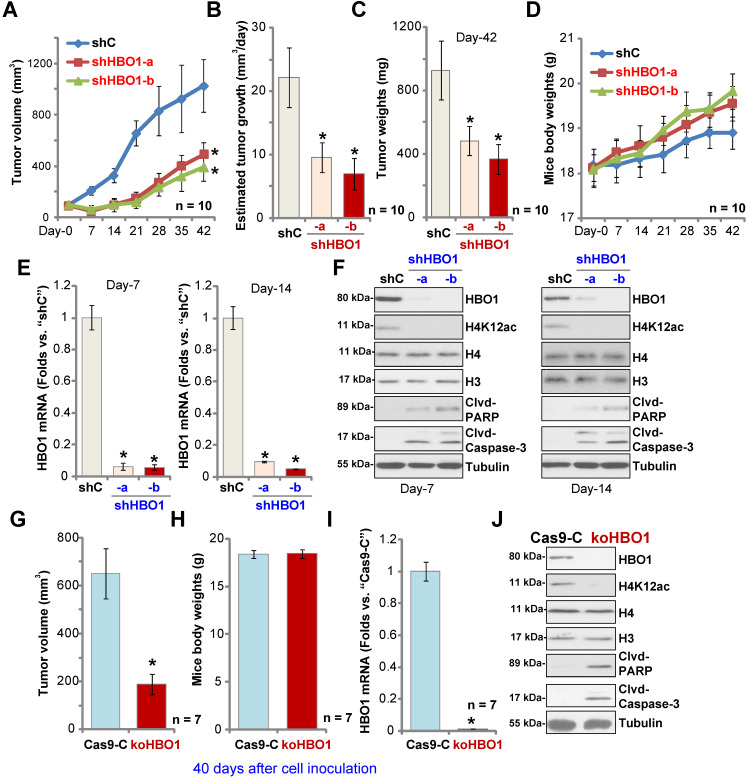
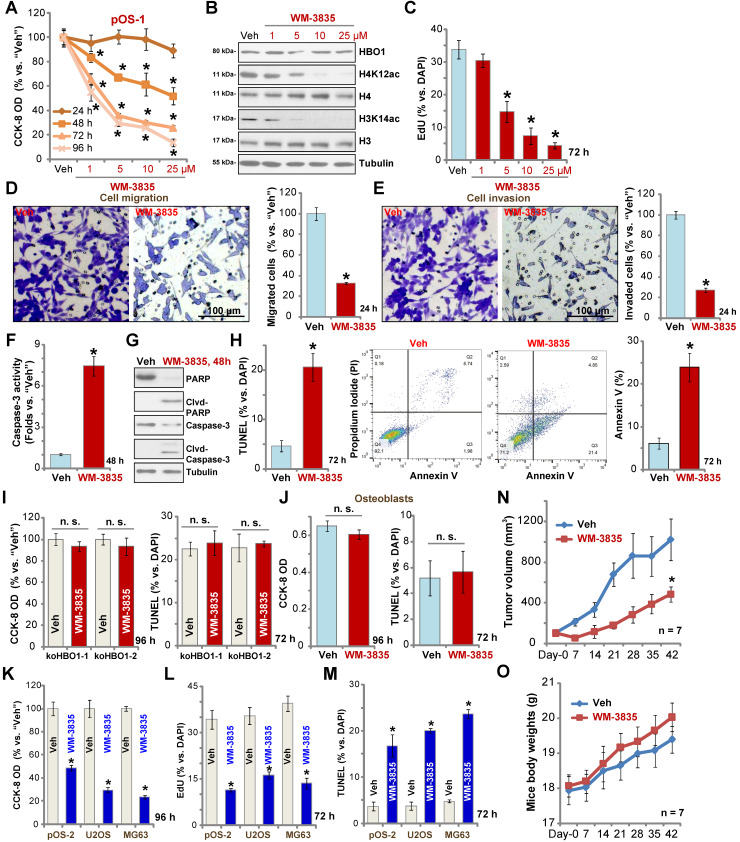
HBO1 (KAT7 or MYST2) is a histone acetyltransferase that acetylates H3 and H4 histones. Methods: HBO1 expression was tested in human OS tissues and cells. Genetic strategies, including shRNA, CRISPR/Cas9 and overexpression constructs, were applied to exogenously alter HBO1 expression in OS cells. The HBO1 inhibitor WM-3835 was utilized to block HBO1 activation. Results:HBO1 mRNA and protein expression is significantly elevated in OS tissues and cells. In established (MG63/U2OS lines) and primary human OS cells, shRNA-mediated HBO1 silencing and CRISPR/Cas9-induced HBO1 knockout were able to potently inhibit cell viability, growth, proliferation, as well as cell migration and invasion. Significant increase of apoptosis was detected in HBO1-silenced/knockout OS cells. Conversely, ectopic HBO1 overexpression promoted OS cell proliferation and migration. We identified ZNF384 (zinc finger protein 384) as a potential transcription factor of HBO1. Increased binding between ZNF384 and HBO1 promoter was detected in OS cell and tissues, whereas ZNF384 silencing via shRNA downregulated HBO1 and produced significant anti-OS cell activity. In vivo, intratumoral injection of HBO1 shRNA lentivirus silenced HBO1 and inhibited OS xenograft growth in mice. Furthermore, growth of HBO1-knockout OS xenografts was significantly slower than the control xenografts. WM-3835, a novel and high-specific small molecule HBO1 inhibitor, was able to potently suppressed OS cell proliferation and migration, and led to apoptosis activation. Furthermore, intraperitoneal injection of a single dose of WM-3835 potently inhibited OS xenograft growth in SCID mice. Conclusion: HBO1 overexpression promotes OS cell growth in vitro and in vivo.

Keywords: HBO1; WM-3835; histone acetylation; osteosarcoma.


Conflict of interest statement

Competing Interests: The authors have declared that no competing interest exists.

Figures

Figure 1
Figure 1
HBO1 upregulation in human OS. The TARGET Pan-Cancer (PANCAN) database shows HBO1 expression (RNASeq-TOIL RSEM) in 166 cases of children's sarcoma tissues and 70 cases of normal adjacent tissues (A). Kaplan Meier Survival analyses of HBO1-low (n = 53) and HBO1-high (n = 113) children's sarcoma patients (B). HBO1 mRNA and protein expression in OS tumor tissues (“T”) and in normal tissues adjacent to tumor (“N”) of ten (n = 10) primary human OS patients was shown (C-E). HBO1 mRNA and protein expression in established OS cell lines (U2OS and MG63), primary human OS cells (pOS-1 and pOS-2), as well as in primary human osteoblasts (“Osteoblasts”) were shown (F and G). Data were presented as mean ± standard deviation (SD). * P < 0.05 vs. “N” tissues/Osteoblasts (C-G).
Figure 2
Figure 2
HBO1 silencing inhibits OS cell progression in vitro. Stable primary OS cells (pOS-1 and pOS-2) and established OS cell lines (U2OS and MG63) that expressed the HBO1 shRNA (shHBO1-a/shHBO1-b) or the scramble control shRNA (“shC”) were established. After cultured for applied time periods, expression of HBO1 mRNA and listed proteins was shown (A, B, and I); Cell growth (C), viability (D and J), proliferation (E and K), S-phase cell percentage (F), cell migration (G and L) and invasion (H) were tested by the listed assays, with results quantified. For nuclear EdU staining, five random views (n = 5) of total 1, 000 cell nuclei per each condition were used to calculate the average EdU ratio (% vs. DAPI, same for all EdU studies). For “Transwell” and “Matrigel Transwell” assays, five random microscopy views were included to calculate the average number of migrated or invaded cells in each condition (same for all “Transwell” assays). For the in vitro cellular functional studies, the exact same number of viable cells with the applied genetic modifications was initially seeded into each well/dish (“Day-0”/“0h”, same for all figures), and cells were cultured for indicated time periods. “Pare” stands for the parental control OS cells. The data were presented as mean ± standard deviation (SD, n = 5). * P < 0.05 vs. “sh-C” cells. The experiments were repeated five times with similar results obtained. Scale bar = 100 µm (E, G and H).
Figure 3
Figure 3
HBO1 shRNA provokes OS cell apoptosis. Stable primary OS cells (pOS-1 and pOS-2), as well as the established OS cell lines (U2OS and MG63) that expressed HBO1 shRNA (shHBO1-a/shHBO1-b) or the scramble control shRNA (“shC”) were established and cultured for applied time periods, caspase activation (A, B and J), single strand DNA (ssDNA) contents (C), and mitochondrial depolarization (by recording JC-1 green monomers, D and I) were tested; Cell apoptosis was tested by nuclear TUNEL staining (E and K) and Annexin V FACS (F) assays. Stable pOS-1 cells with shHBO1-a or shC were treated with z-DEVD-fmk (50 μM), z-VAD-fmk (50 µM) or vehicle control (0.1% of DMSO), and cultured for 96h. Cell viability and death were tested by CCK-8 (G) and Trypan blue staining (H) assays, respectively. For nuclear TUNEL staining assays, five random views of a total 1, 000 cells per each condition were included to calculate the average TUNEL ratio (% vs. DAPI, same for all TUNEL assays). “Pare” stands for the parental control OS cells. The data were presented as mean ± standard deviation (SD, n = 5). *P < 0.05 vs. “sh-C” cells. #P < 0.05 vs.“DMSO” treatment (G and H). The experiments were repeated five times with similar results obtained. Scale bar = 100 µm (D, E, I and K).
Figure 4
Figure 4
Ectopic HBO1 overexpression promotes OS cell growth. Stable primary OS cells (pOS-1 and pOS-2) and established OS cell lines (U2OS and MG63) with lentiviral construct encoding full-length HBO1 cDNA (“OE-HBO1”) or the empty vector (“Vec”), were established and cultured for applied time periods; Expression of HBO1 mRNA and listed proteins was shown (A, B and G); Cell viability (CCK-8 OD, C), proliferation (by recording EdU-positive nuclei ratio, D and H), migration and invasion (“Transwell” assays, E, F and I) were tested by the listed assays, and results were quantified. “Pare” stands for the parental control OS cells. The data were presented as mean ± standard deviation (SD, n = 5). *P < 0.05 vs. “Vec” cells. The experiments were repeated five times with similar results obtained. Scale bar = 100 µm (E).
Figure 5
Figure 5
ZNF384 is a transcription factor of HBO1 in OS cells. JASPAR database predicted the potential transcription factors of HBO1 (A). pOS-1 cells were individually transfected with 200 nM of applied siRNAs or scramble control siRNA (“siC”) for 48h, and HBO1 mRNA expression was tested by qPCR (B). ChIP assay results demonstrated the direct binding between ZNF384 protein and HBO1 promoter in listed human cells and tissues, with results quantified (C and D). Stable OS cells, including pOS-1 cells, pOS-2 primary cells, as well as the established OS cell lines (U2OS and MG63) that expressed listed ZNF384 shRNAs (“shZNF384”) or the scramble control shRNA (“shC”), were established and expression of listed genes was shown (E, F, K, and L); Cells were cultured for applied time periods; cell proliferation (EdU staining assay, G and N), viability (CCK-8 OD, M), migration (H), mitochondrial depolarization (by recording JC-1 green monomers intensity, I), and apoptosis (nuclear TUNEL staining assay, J) were tested. ZNF384 mRNA and protein expressions in OS tumor tissues (“T”) and in normal tissues adjacent to tumor (“N”) were shown (O and P). TCGA database showed relative ZNF384 transcript expression in human sarcoma tissues and normal tissues (Q). The data were presented as mean ± standard deviation (SD, n = 5). *P < 0.05 vs. “siC”/“shC” cells (B, E, G-N).*P < 0.05 vs. “Osteoblasts” (C). *P < 0.05 vs. “N” tissues (D, O and P). The experiments were repeated five times with similar results obtained. Scale bar = 100 µm (G-J).
Figure 6
Figure 6
HBO1 is required for OS xenograft growth in mice. The pOS-1 xenografts-bearing SCID mice were subjected to intratumoral injection with HBO1 shRNA lentivirus (shHBO1-a/shHBO1-b) or scramble control shRNA lentivirus (“shC”); tumor volumes (A) and mice body weights (D) were recorded every seven days, and estimated daily tumor growth was calculated by using the described formula (B). At experimental Day-42, all tumors were separated through surgery and weighted individually (C). Expression of HBO1 mRNA (E) and listed proteins (F) in indicated OS xenograft tissues was shown. The stable pOS-1 cells expressing the CRISPR/Cas9-HBO1-KO construct (ko-HBO1 cells) or CRISPR/Cas9 control construct (“Cas9-C”) were s.c. injected to the flanks of SCID mice. Forty days after cell inoculation, tumors were separated and measured (G); Mice body weights were recorded (H); Expressions of HBO1 mRNA (I) and listed proteins (J) were shown. Data were presented as mean ± standard deviation (SD). *P < 0.05 vs. “shC”/“Cas9-C” tumors.
Figure 7
Figure 7
The anti-OS activity by a HBO1 inhibitor WM-3835. The pOS-1 cells were treated with WM-3835 (at 5 µM, expect for A-C) or vehicle control (“Veh”, 0.5% DMSO), and cells were further cultured in complete medium for indicated time periods. Cell viability (CCK-8 OD, A), expression of listed proteins (B), cell proliferation (by recording EdU-positive nuclei ratio, C), migration (D), and invasion (E) were tested; Caspase activation (F and G) and cell apoptosis (nuclear TUNEL staining and Annexin V FACS assays, H) were tested as well. The stable HBO1-KO pOS-1 cells, koHBO1-1 and koHBO1-2 (I) or the human osteoblasts (“Osteoblasts”, J) were treated with WM-3835 (5 µM) or vehicle control for applied time periods, cell viability and apoptosis were tested by CCK-8 and TUNEL staining assays, respectively. The pOS-2 primary cells, as well as the established OS cell lines, U2OS and MG63, were treated with WM-3835 (5 µM) or vehicle control for applied time periods, cell viability, proliferation and apoptosis were tested by CCK-8 (K), nuclear EdU staining (L) and TUNEL staining (M) assays, respectively. The pOS-1 xenografts-bearing SCID mice were subjected to i.p. injection of WM-3835 (10 mg/kg, daily for 21 days) or vehicle control (“Veh”); tumor volumes (N) and mice body weights (O) were recorded every seven days. The data were presented as mean ± standard deviation (SD). *P < 0.05 vs. “Veh” treatment. The in vitro experiments were repeated five times with similar results obtained. “n. s.” stands for no statistical difference (I and J). Scale bar = 100 µm (D and E).

Similar articles

Cited by

References

    1. Isakoff MS, Bielack SS, Meltzer P, Gorlick R. Osteosarcoma: Current Treatment and a Collaborative Pathway to Success. J Clin Oncol. 2015;33:3029–35. - PMC - PubMed
    1. Kansara M, Teng MW, Smyth MJ, Thomas DM. Translational biology of osteosarcoma. Nat Rev Cancer. 2014;14:722–35. - PubMed
    1. Ottaviani G, Jaffe N. The epidemiology of osteosarcoma. Cancer Treat Res. 2009;152:3–13. - PubMed
    1. Siegel RL, Miller KD, Jemal A. Cancer statistics, 2020. CA Cancer J Clin. 2020;70:7–30. - PubMed
    1. Siegel RL, Miller KD, Jemal A. Cancer statistics, 2019. CA Cancer J Clin. 2019;69:7–34. - PubMed

Publication types

MeSH terms