. 2021 Mar 4;11(10):4616-4636.
doi: 10.7150/thno.54210. eCollection 2021.

Decreased neuronal synaptosome associated protein 29 contributes to poststroke cognitive impairment by disrupting presynaptic maintenance

Affiliations

Decreased neuronal synaptosome associated protein 29 contributes to poststroke cognitive impairment by disrupting presynaptic maintenance

Weijie Yan et al. Theranostics. .

Abstract

Background: Poststroke cognitive impairments are common in stroke survivors, and pose a high risk of incident dementia. However, the cause of these cognitive impairments is obscure and required an investigation. Methods: Oxygen-glucose deprivation (OGD) model and middle cerebral artery occlusion (MCAO) model were used to imitate in vitro or in vivo acute cerebral ischemia, respectively. The differentially expressed synaptosome associated protein 29 (SNAP29)-interacting proteins upon ischemia and reperfusion were analyzed with bioinformatics analysis and the results indicated that the changes of SNAP29 after acute ischemia were mainly involved in the synaptic functions. The outcomes of SNAP29 reduction were assessed with SNAP29 knockdown, which mimicked the distribution of SNAP29 along neuronal processes after acute ischemia. Using the whole-cell patch clamp recording method and transmission electron microscope, the pre-synaptic function and readily releasable pool (RRP) were observed after SNAP29 knock down. Using photogenetic manipulations and behavioral tests, the neuronal projection and cognitive functions of mice with SNAP29 knock down in hippocampus CA1 region were evaluated. Results: It was found that SNAP29 protein levels decreased in both in vitro and in vivo ischemic models. Further, the SNAP29 reduction wasn't associated with impaired autophagy flux and neuronal survival. When SNAP29 was knocked down in primary cortical neurons, the frequency of AMPARs-mediated mEPSCs, but not the amplitude, significantly decreased. Meanwhile, the mice with SNAP29 knockdown at CA1 region of hippocampus developed an impairment in hippocampus-mPFC (middle prefrontal cortex) circuit and behavioral dysfunctions. Moreover, the size of RRP at presynaptic sites was diminished. Conclusion: Since SNAP29 protein levels didn't significantly influence the neuronal survival and its decrease was sufficient to disturb the neural circuit via a presynaptic manner, the SNAP29-associated strategies may be an efficient target against poststroke synaptic dysfunction and cognitive deficits.

Keywords: SNAP29; cognitive impairment; ischemic stroke; synaptic function; synaptic vesicle release.


Conflict of interest statement

Competing Interests: The authors have declared that no competing interest exists.

Figures
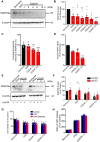
Figure 1
Figure 1
The SNAP29 protein levels significantly decreased after exposed to OGD. A. SNAP29 in neurons was detected following OGD exposure and during subsequent reperfusion (1, 2, 4, 6, and 12 h) with western blot assay, and quantitative analysis was shown in B (*p < 0.05, **p < 0.01, and ***p < 0.001 vs. normoxia group, n = 6 per group, one-way ANOVA; Bonferroni post-test). C. Immunofluorometric assay of SNAP29 levels following OGD/R exposure (**p < 0.01 and ***p < 0.001 vs. normoxia group, n = 6 per group, one-way ANOVA; Bonferroni post-test). D. RT-qPCR analysis of Snap29 mRNA in neurons following OGD/R exposure (**p < 0.01, n = 3 per group, one-way ANOVA; Bonferroni post-test). E. SNAP29 in neurons was detected after pretreatment of MG132 (10 µM for 6 h) and then OGD/R (0, 1 and 12 h) exposure using western blot, and quantitative analysis was shown in F (*p < 0.01, n = 6 per group, Studentʼs t-test; one-tailed). G. After over-expressed with SNAP29 plasmid, the survival of neurons upon OGD or during subsequent reperfusion were detected with CCK8 assay (n = 9 per group, one-way ANOVA; Bonferroni post-test). H. The survival of SNAP29 overexpressed neurons following OGD/R exposure were detected with LDH assay (n = 3 per group, one-way ANOVA; Bonferroni post-test). Data are shown as mean and SEM.
Figure 2
Figure 2
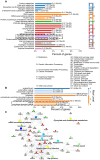
GO analysis of differentially expressed SNAP29-interacting proteins, using Database for Annotation, Visualization, and Integrated Discovery (DAVID). A. The most significantly enriched Kyoto Encyclopedia of KEGG pathway of the differentially expressed proteins was cytoplasm transportation. The synaptic vesicle cycle and glutamatergic transmission processes are particularly noteworthy, given the use of neurons. B. Differentially expressed SNAP29-interacting proteins mainly located in the cytoplasm or associated with vesicles. C. The identified SNAP29 interacting differentially expressed proteins in PPI network were involved in the splicesome, RNA transport, oocyte meiosis, phagosome, glyxylate and dicarboxylate metabolism, gap junction, protein export and synaptic vesicle cycle, which suggests that SNAP29-associated synaptic function may be of great importance in the OGD and/or reperfusion process.
Figure 3
Figure 3
SNAP29 reduction induced by OGD/R exposure or SNAP29 KD significantly decreased the SNAP29 distribution at the synaptic sites. A. The colocalization of SNAP29 and synaptophysin was presented in neurons following OGD/R exposure (Scale bar: 10 µm). B. The numbers of SNAP29 in per micron were expressed in neurons following OGD/R exposure (***p < 0.001 vs. normoxia group, ##p < 0.01 vs. OGD group, n = 6 per group, one-way ANOVA; Bonferroni post-test). C. The numbers of SNAP29 colocalizing with synaptophysion in per micron were expressed in neurons following OGD/R exposure (*p < 0.05 and ***p < 0.001 vs. normoxia group, ##p < 0.01 and ###p < 0.001 vs. OGD group, n = 6-8 per group, one-way ANOVA; Bonferroni post-test) D. The colocalization of SNAP29 and synaptophysin was present in neurons after shRNA transfection (Scale bar: 10 µm). E. The ratio of SNAP29 on synaptophysin were expressed in neurons after shRNA transfection (***p < 0.001 vs. WT group, #p < 0.01 vs. NC group, n = 12-13 per group, one-way ANOVA; Bonferroni post-test). F. Typical punctiform signals of synaptophysin puncta of cortical neurons are highlighted (red points in left panel). SNAP29 fluorescence intensity overlaid on a confocal image of the corresponding cortical neurons at presynaptic sites (right panel). G. Accumulation index plots for evaluating SNAP29 redistribution by heterogeneity of the fluorescence signal of SNAP29 and synaptophysin along the processes are presented. Data are shown as mean and SEM.
Figure 4
Figure 4
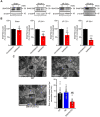
SNAP29 reduction contributed to the synaptic dysfunction of the cortical neurons in the pre-synaptic manner in neurons. A. Representative results from whole-cell recording method. B. The analysis of frequency and amplitude of AMPA-mediated mEPSCs in neurons after shRNA transfection were present (***p < 0.001 vs. normoxia group, n = 11 per group, one-way ANOVA; Bonferroni post-test). C. The images of synaptic ultrastructure of neurons were acquired with TEM in WT, NC and SNAP29 KD groups. D. The size of readily releasable pool was calculated (***p < 0.001 vs. WT group, ##p < 0.01 vs. NC group, n = 10-15 per group, one-way ANOVA; Bonferroni post-test). Data are shown as mean and SEM.
Figure 5
Figure 5
SNAP29 protein levels decreased in the ipsilateral cerebral regions after 1 h of acute ischemia followed by 24 h, 72 h and 28 days reperfusion in MCAO mice. A. SNAP29 in ipsilateral (I) or contralateral (C) cerebral regions of MCAO was detected with western blot assay, and quantitative analysis was shown in B (*p < 0.05 and ***p < 0.001 vs contralateral cerebral regions, n = 6 in Sham, 24 h and 72 h groups, n = 4 in 28 d group, Studentʼs t-test; one-tailed). C. The images of synaptic ultrastructure of neurons in brain slices were acquired with TEM in WT, NC and SNAP29 KD groups and the size of readily releasable pool was calculated (***p < 0.001 vs. WT group, ###p < 0.05, vs. NC group, n = 24 per group, one-way ANOVA; Bonferroni post-test). Data are shown as mean and SEM.
Figure 6
Figure 6
SNAP29 KD in hippocampus impaired the interactions between hippocampus and prefrontal cortex after AAVs simultaneously carrying Snap29 shRNA and hChR2 channels were injected into the CA1 region of hippocampus. A. Example spectrogram (top), raw traces (middle) and traces in different bands (bottom) before and during optogenetic stimulation (blue light) were present. Left panel: WT mouse without AAV transfection. Middle panel: hChR2/NC mouse with AAV transfection of hChR2 channels and shRNA vector. Right panel: hChR2/SNAP29 KD mouse with AAV transfection of hChR2 channels and Snap29 shRNA. B. Power spectra of the local field potential signals in the prefrontal cortex was present in WT, hChR2; NC and hChR2; SNAP29 KD groups. C. The delta, theta, beta and gamma band power were present before and during light stimulation in WT, hChR2; NC and hChR2; SNAP29 KD groups, and the power of them was shown in D (*p < 0.05, **p < 0.01, and ***p < 0.001, n = 8, one-way ANOVA; Bonferroni post-test). Data are shown as mean and SEM.
Figure 7
Figure 7
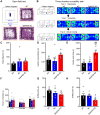
SNAP29 KD in the CA1 hippocampal region increased indifference to danger and caused social dysfunction. A. The diagrammatic sketch and representative results from the open field test. B. The schematic process diagram and representative results from the three-chamber social test were presented. The total distance traveled, the number of entries into the center and the spent time in the central area of the open field test were shown in C, D and E (***p < 0.001 vs. WT group, ###p < 0.001 vs. NC group, n = 8 per group, one-way ANOVA; Bonferroni post-test). The time in each chamber (Trial1), sniffing time for strange#1 (Trial 2) and sniffing time for strange#2 (Trial 3) of the three-chamber social test were present in F, G and H. (*p < 0.001 vs. control group, #p < 0.001 vs. NC group, n = 8 per group, one-way ANOVA; Bonferroni post-test). Data are shown as mean and SEM.
Figure 8
Figure 8
SNAP29 KD in the CA1 hippocampal region resulted in the memory defects in mice. A. A schematic of the novel object recognition test procedures and representative results were shown. B. The exploration time was present in WT, NC and SNAP29 KD groups (***p < 0.001 and **p < 0.01, n = 8 per group, one-way ANOVA; Bonferroni post-test). C. The discrimination indexes were present in WT, NC and SNAP29 KD groups (***p < 0.001 vs. WT group, ###p < 0.001 vs. NC group, n = 8 per group, one-way ANOVA; Bonferroni post-test). D. The schematic and representative navigation traces on Day 7 in the Morris water maze test were shown. E. The swimming speed was present. F. The average escape latencies were present in WT, NC and SNAP29 KD groups (*p < 0.05 vs. WT group, ##p < 0.01 and #p < 0.05 vs. NC group, n = 8-9 per group, one-way ANOVA; Bonferroni post-test). G, H and I. The number of entries to the plant zone, the number of entries to each quadrant, and the duration in each quadrant were presented in WT, NC and SNAP29 KD groups (***p < 0.001, n = 8-9 per group, one-way ANOVA; Bonferroni post-test). Data are shown as mean and SEM.

Similar articles

Cited by

References

    1. Feigin VL, Norrving B, Mensah GA. Global Burden of Stroke. Circ Res. 2017;120:439–48. - PubMed
    1. Tatemichi TK, Desmond DW, Stern Y, Paik M, Sano M, Bagiella E. Cognitive impairment after stroke: frequency, patterns, and relationship to functional abilities. J Neurol Neurosurg Psychiatry. 1994;57:202–7. - PMC - PubMed
    1. Mellon L, Brewer L, Hall P, Horgan F, Williams D, Hickey A. et al. Cognitive impairment six months after ischaemic stroke: a profile from the ASPIRE-S study. BMC Neurol. 2015;15:31. - PMC - PubMed
    1. Nys GM, van Zandvoort MJ, van der Worp HB, de Haan EH, de Kort PL, Jansen BP. et al. Early cognitive impairment predicts long-term depressive symptoms and quality of life after stroke. J Neurol Sci. 2006;247:149–56. - PubMed
    1. Sachdev PS, Chen X, Brodaty H, Thompson C, Altendorf A, Wen W. The determinants and longitudinal course of post-stroke mild cognitive impairment. J Int Neuropsychol Soc. 2009;15:915–23. - PubMed

Publication types

MeSH terms