. 2021 Mar 5;11(10):4945-4956.
doi: 10.7150/thno.55209. eCollection 2021.

Candida albicans disorder is associated with gastric carcinogenesis

Affiliations

Candida albicans disorder is associated with gastric carcinogenesis

Mengya Zhong et al. Theranostics. .

Abstract

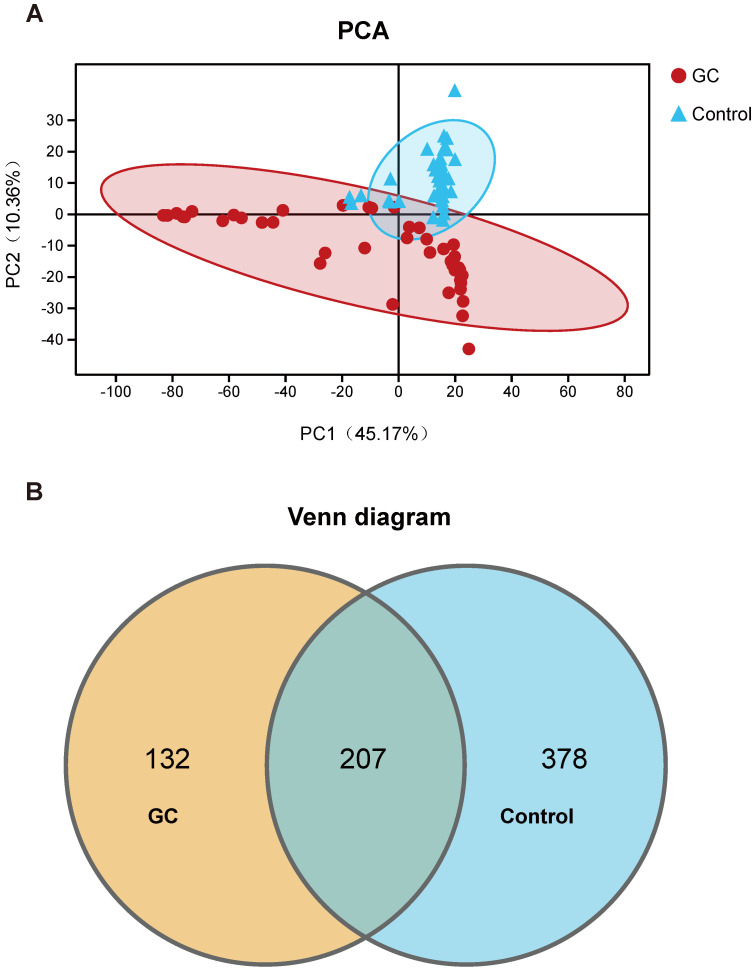
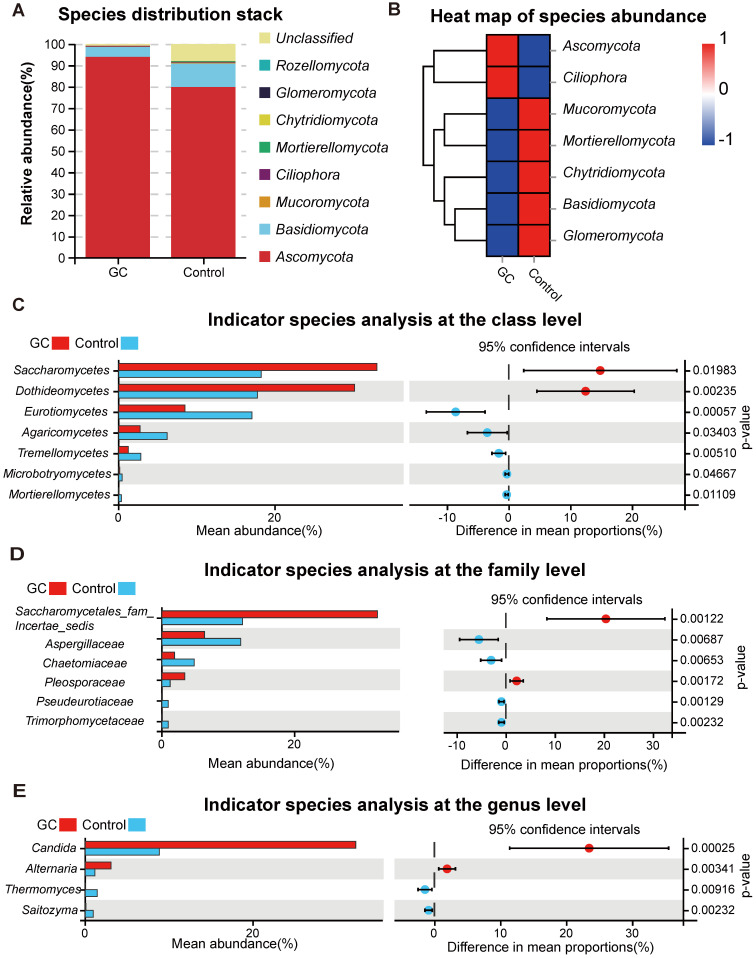
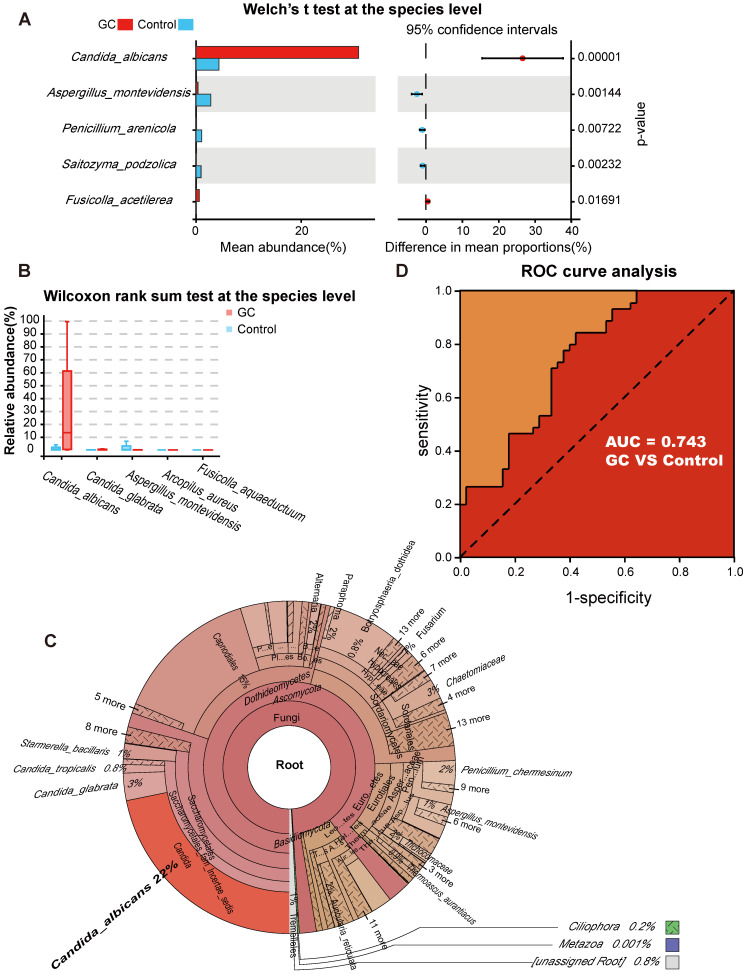
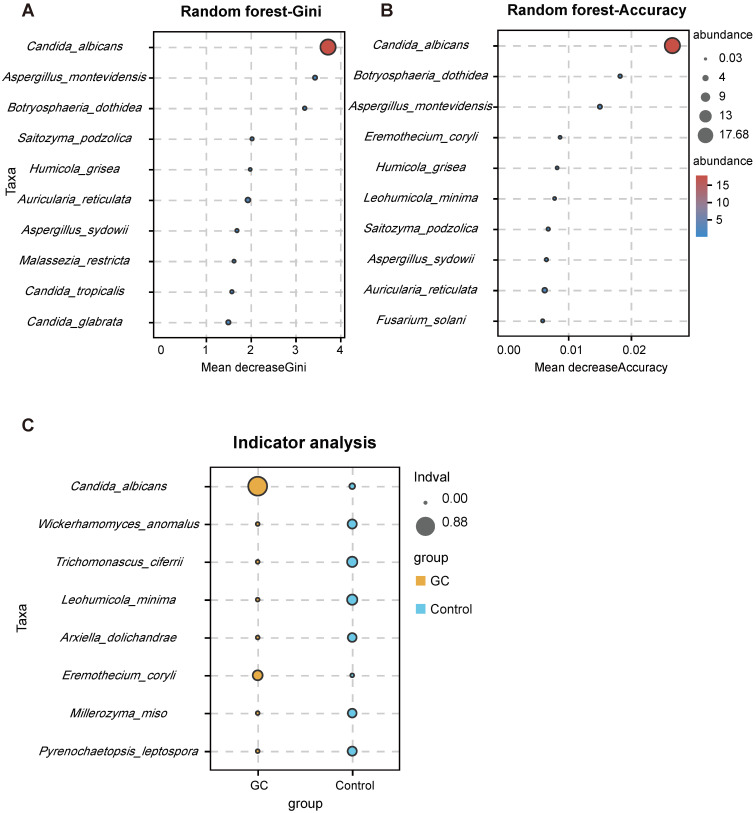
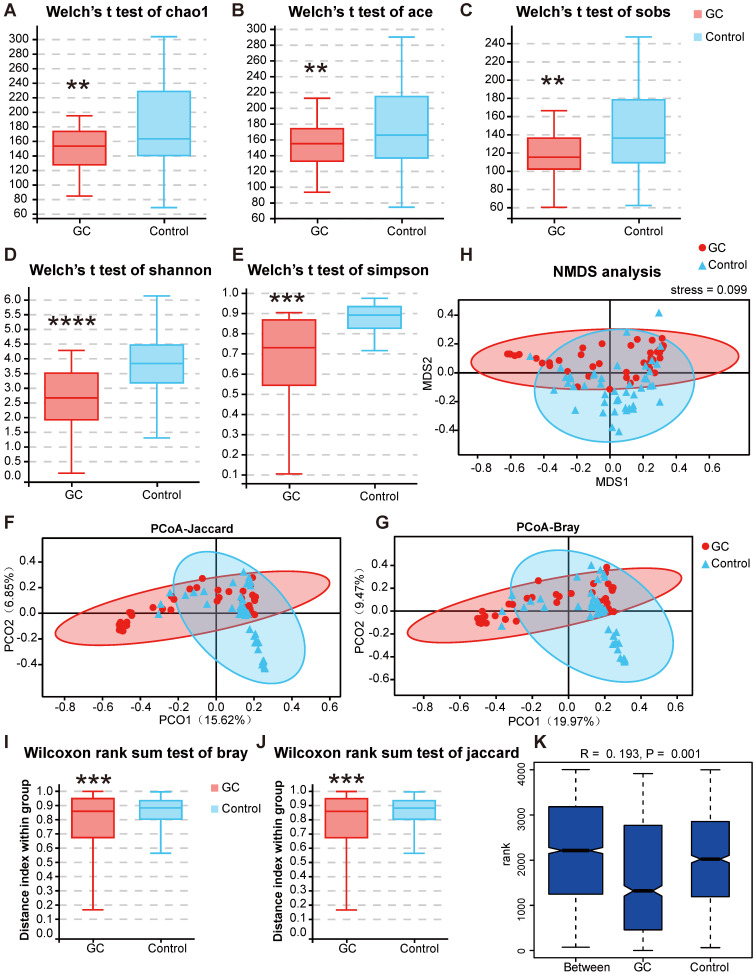
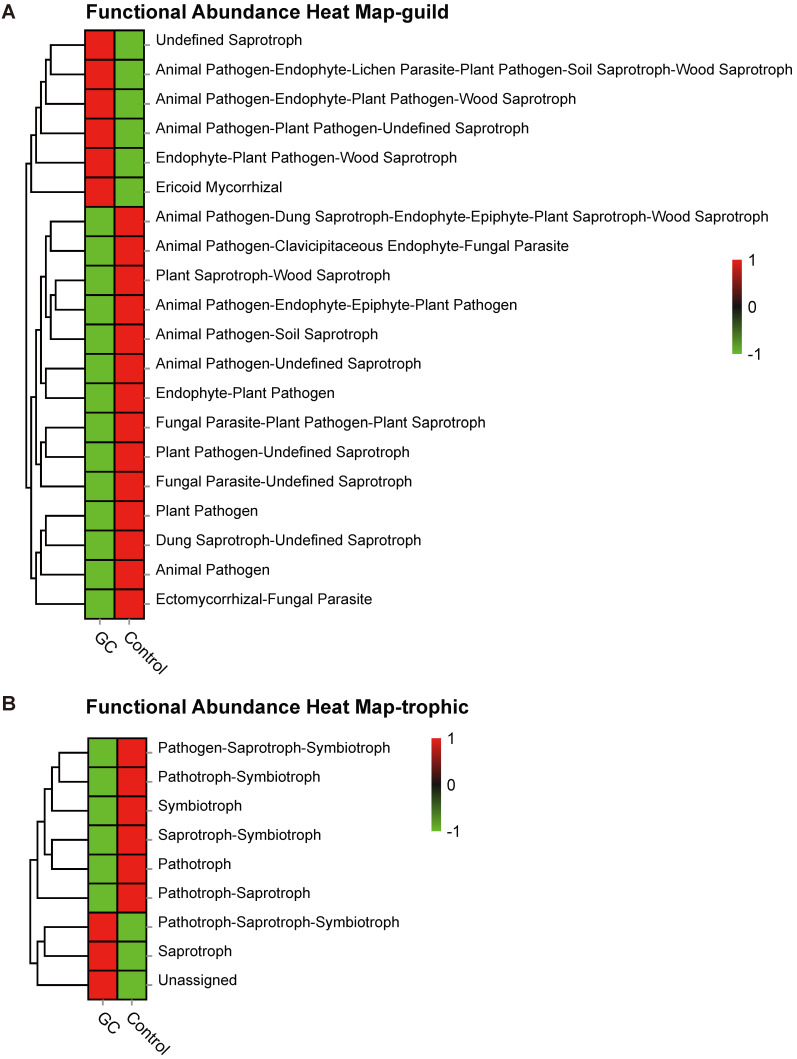
Background: Bacterial infection is associated with gastric carcinogenesis. However, the relationship between nonbacterial components and gastric cancer (GC) has not been fully explored. We aimed to characterize the fungal microbiome in GC. Methods: We performed ITS rDNA gene analysis in cancer lesions and adjacent noncancerous tissues of 45 GC cases from Shenyang, China. Obtaining the OTUs and combining effective grouping, we carried out species identifications, alpha and beta diversity analyses, and FUNGuild functional annotation. Moreover, differences were compared and tested between groups to better investigate the composition and ecology of fungi associated with GC and find fungal indicators. Results: We observed significant gastric fungal imbalance in GC. Principal component analysis revealed separate clusters for the GC and control groups, and Venn diagram analysis indicated that the GC group showed a lower OTU abundance than the control. At the genus level, the abundances of 15 fungal biomarkers distinguished the GC group from the control, of which Candida (p = 0.000246) and Alternaria (p = 0.00341) were enriched in GC, while Saitozyma (p = 0.002324) and Thermomyces (p = 0.009158) were decreased. Combining the results of Welch's t test and Wilcoxon rank sum test, Candida albicans (C. albicans) was significantly elevated in GC. The species richness Krona pie chart further revealed that C. albicans occupied 22% and classified GC from the control with an area under the receiver operating curve (AUC) of 0.743. Random forest analysis also confirmed that C. albicans could serve as a biomarker with a certain degree of accuracy. Moreover, compared with that of the control, the alpha diversity index was significantly reduced in the GC group. The Jaccard distance index and the Bray abundance index of the PCoA clarified separate clusters between the GC and control groups at the species level (p = 0.00051). Adonis (PERMANOVA) analysis and ANOVA showed that there were significant differences in fungal structure among groups (p = 0.001). Finally, FUNGuild functional classification predicted that saprotrophs were the most abundant taxa in the GC group. Conclusions: This study revealed GC-associated mycobiome imbalance characterized by an altered fungal composition and ecology and demonstrated that C. albicans can be a fungal biomarker for GC. With the significant increase of C. albicans in GC, the abundance of Fusicolla acetilerea, Arcopilus aureus, Fusicolla aquaeductuum were increased, while Candida glabrata, Aspergillus montevidensis, Saitozyma podzolica and Penicillium arenicola were obviously decreased. In addition, C. albicans may mediate GC by reducing the diversity and richness of fungi in the stomach, contributing to the pathogenesis of GC.

Keywords: Candida albicans; Gastric cancer; biomarker; fungal imbalance; mycobiome.


Conflict of interest statement

Competing Interests: The authors have declared that no competing interest exists.

Figures

Figure 1
Figure 1
Classification and distribution of fungi in the stomachs of gastric cancer (GC) patients. (A) Through the principal component analysis (PCA) dynamic display, GC (n=45) and control (n=45) samples showed clustering distributions. PC1 and PC2 represent the first two main components, and they reflect the contribution to the sample difference, expressed as a percentage. (B) Based on the OTU abundance, Venn diagram analysis was performed. Unique OTUs between the GC (orange) and control (blue) groups was found as well as common OTUs (lightcyan) between the two groups.
Figure 2
Figure 2
Changes in the fungal composition in the stomachs of gastric cancer (GC) patients. (A) Relative abundance of dominant gastric fungal phyla in the GC and control groups. The dominant phyla were Ascomycota and Basidiomycota in both groups. (B) The corresponding heatmap also shows changes in the fungal phyla in the GC and control groups. Differences in fungal composition and abundance between GC (n=45) and the control (n=45) were detected using Welch's t test. The variation in the relative abundance of species represented in different groups was demonstrated graphically. Differences in OTUs appear in the left rows, and the corresponding P values are shown in the right rows. (C) Differentially abundant fungal classes between the GC and control groups. OTUs and taxa differences are shown with p-values less than 0.05. Differentially abundant fungal families (D) or genera (E) between the GC and control groups. OTUs and taxa differences are shown with p-values less than 0.01.
Figure 3
Figure 3
Candida albicans as an indicator fungus for GC. Differences in fungal species abundance between the GC (n=45) and control (n=45) groups were detected using Welch's t test (A) or Wilcoxon rank sum test (B), and Candida albicans was significantly elevated in the GC group (p<0.0001). (C) Species annotation was performed based on the sequence information of the OTUs, a Krona pie chart was established at the species level, and the absolute abundance of C. albicans accounted for 22%. (D) The markers achieved an area under the receiver operating characteristic curve (AUC) of 0.743 for the classification of the GC group from the control group.
Figure 4
Figure 4
Candida albicans has a strong indication ability. Using the random forest algorithm to calculate the contribution of C. albicans to the grouping difference at the species level, it is found that the Gini index (A) and average accuracy (B) values were both largest for C. albicans. (C) The indicator analysis considers the frequency and abundance of C. albicans between groups.
Figure 5
Figure 5
Changes in fungal microbiome diversity in GC. Hypothesis tests of the alpha diversity index through Welch's t test, Chao1 (A), ACE (B), Sobs (C), Shannon (D) and Simpson (E) diversity indexes between the GC (n=45) and control (n=45) groups confirmed that there were significant differences in species diversity between groups. Principal coordinate analysis (PCoA) of Jaccard distances (F) or Bray-Curtis distances (G) showed the stratification of GC (n=45) from control (n=45) samples by their fungal compositional profiles. (H) Nonmetric multidimensional scaling (NMDS) analysis of the fungal compositional profiles stratified GC (n=45) from control (n=45) samples. A stress value less than 0.1 indicates that the model grouping is reliable. At the genus level, the Wilcoxon rank sum test was used to judge the significant difference between the Bray-Curtis distance (I) and Jaccard distance (J), and the degree of difference in fungal microbiome structure within the groups was compared. (K) Based on the distance index ranking, ANOSIM (analysis of similarities) confirmed that the distance between groups was significantly greater than the distance within groups, indicating that the microbiome structure of different groups was significantly different. **P<0.01, ***P<0.001, ****P<0.0001.
Figure 6
Figure 6
Saprotrophs are the most common functional category associated with GC. Based on the OTU abundance, fungal functional annotation was carried out using FUNGuild. Using functional groups (guilds), fungi were divided into categories based on their absorption and utilization of environmental resources. The three major categories and twelve subcategories of fungi distinguished the GC (n=45) and control groups (n=45) at the guild (A) and trophic (B) levels.

Similar articles

Cited by

References

    1. Siegel RL, Miller KD, Jemal A. Cancer statistics, 2019. CA Cancer J Clin. 2019;69:7–34. - PubMed
    1. Park YH, Kim N. Review of atrophic gastritis and intestinal metaplasia as a premalignant lesion of gastric cancer. J Cancer Prev. 2015;20:25–40. - PMC - PubMed
    1. Amieva M, Peek RM Jr. Pathobiology of Helicobacter pylori-Induced Gastric Cancer. Gastroenterology. 2016;150:64–78. - PMC - PubMed
    1. Stewart OA, Wu F, Chen Y. The role of gastric microbiota in gastric cancer. Gut Microbes. 2020;11:1220–30. - PMC - PubMed
    1. Peek RM Jr, Crabtree JE. Helicobacter infection and gastric neoplasia. J Pathol. 2006;208:233–48. - PubMed

Publication types

MeSH terms