. 2021 Mar 5;11(10):4957-4974.
doi: 10.7150/thno.55075. eCollection 2021.

Single-cell transcriptome analysis of the heterogeneous effects of differential expression of tumor PD-L1 on responding TCR-T cells

Affiliations

Single-cell transcriptome analysis of the heterogeneous effects of differential expression of tumor PD-L1 on responding TCR-T cells

Renpeng Ding et al. Theranostics. .

Abstract

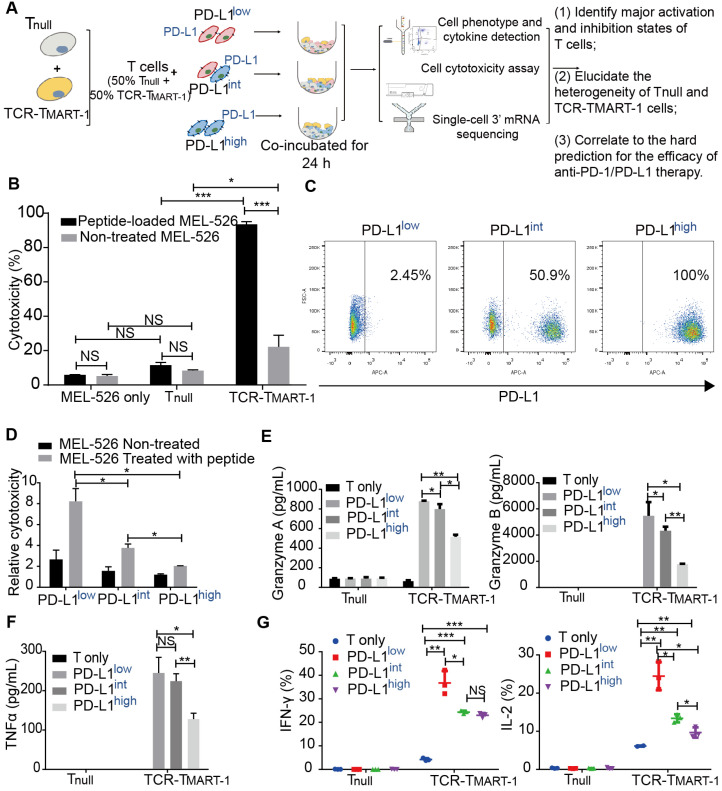
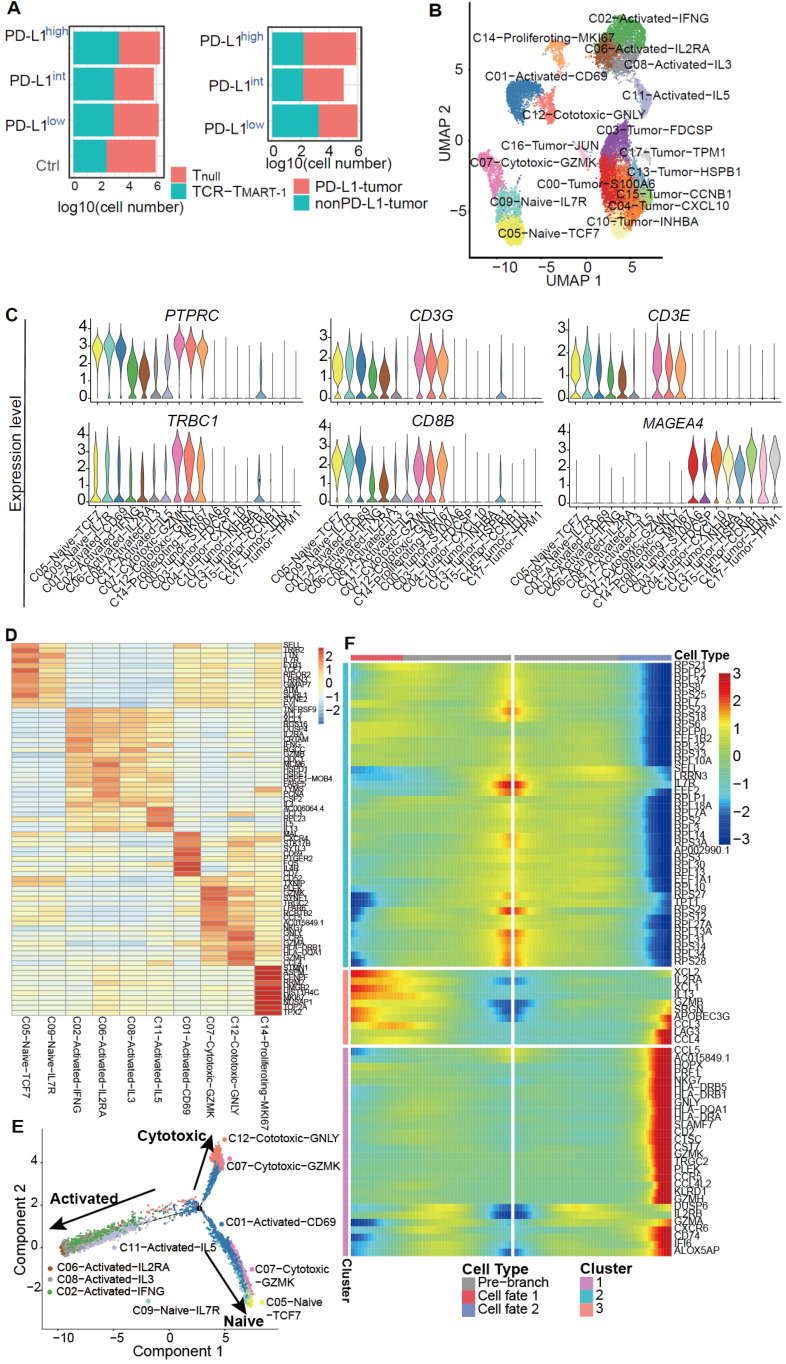
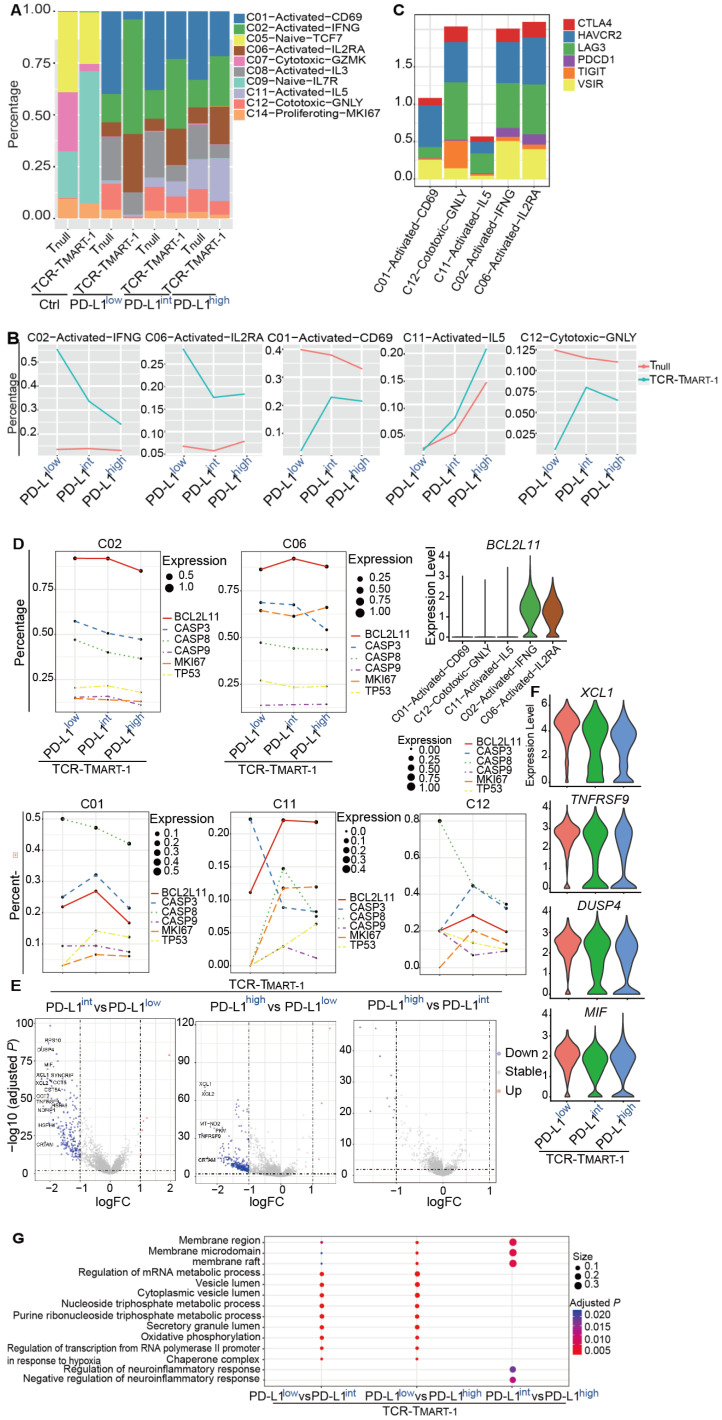
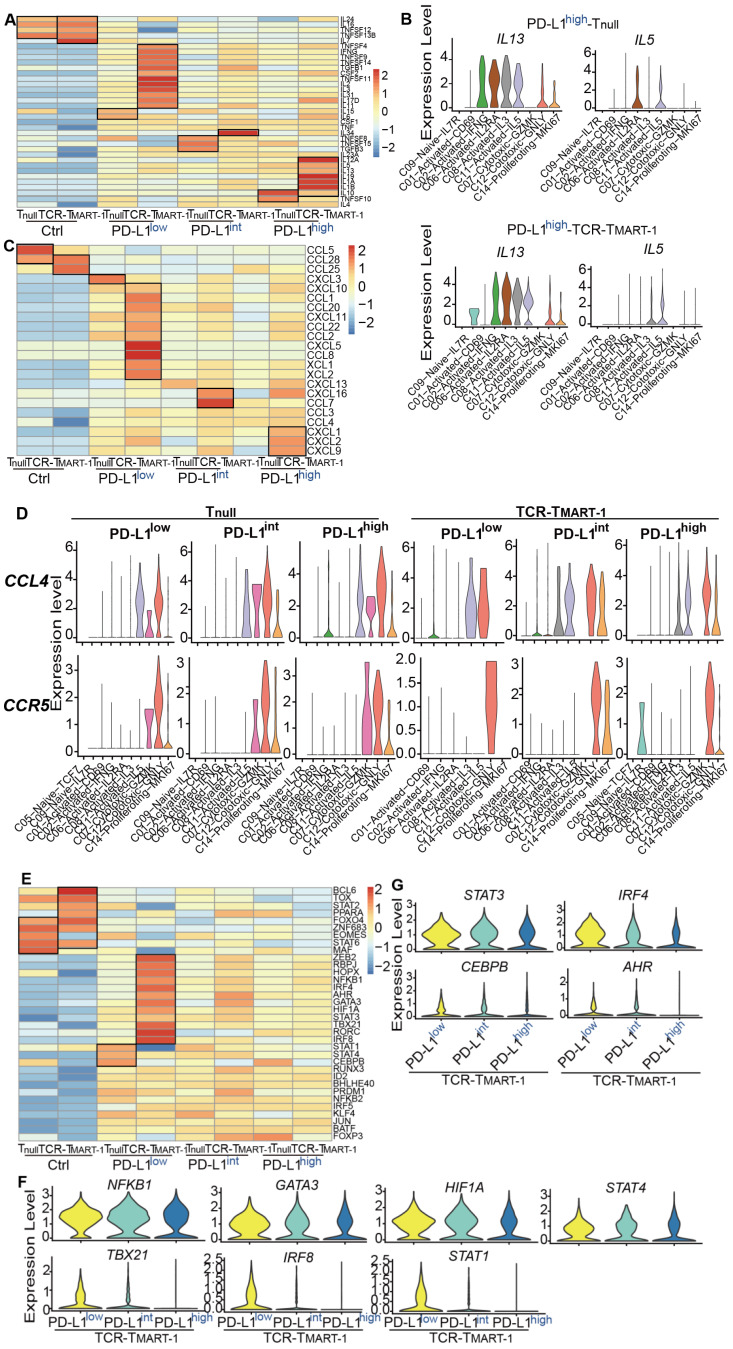
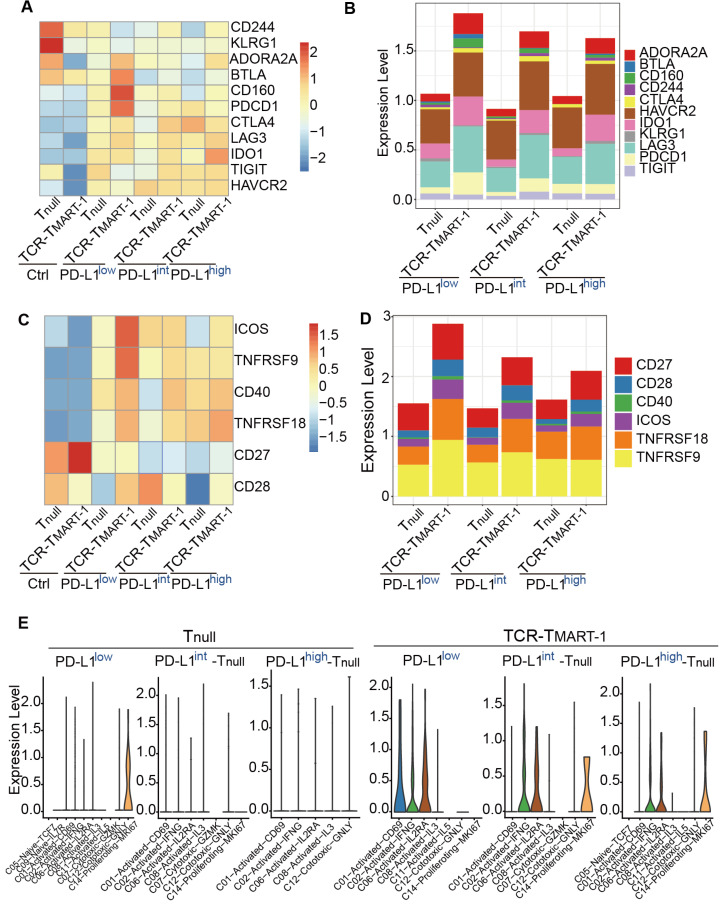
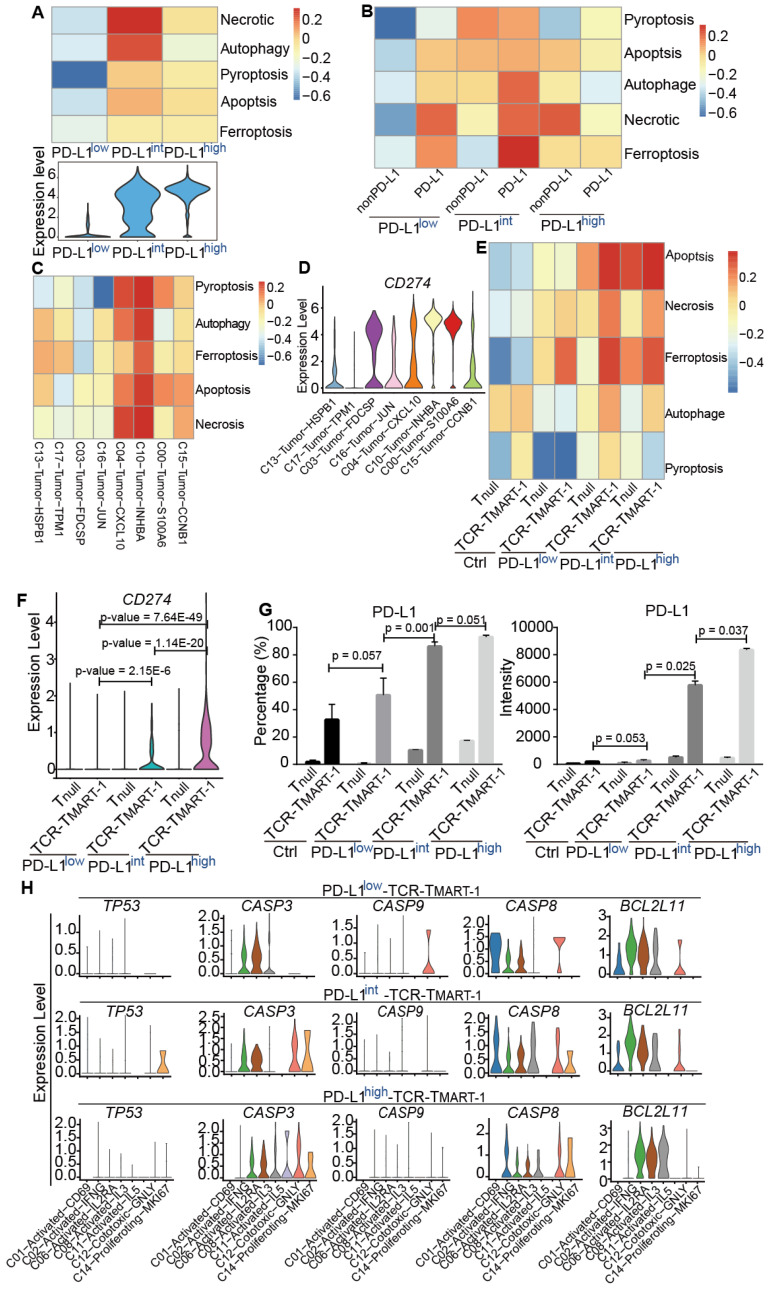
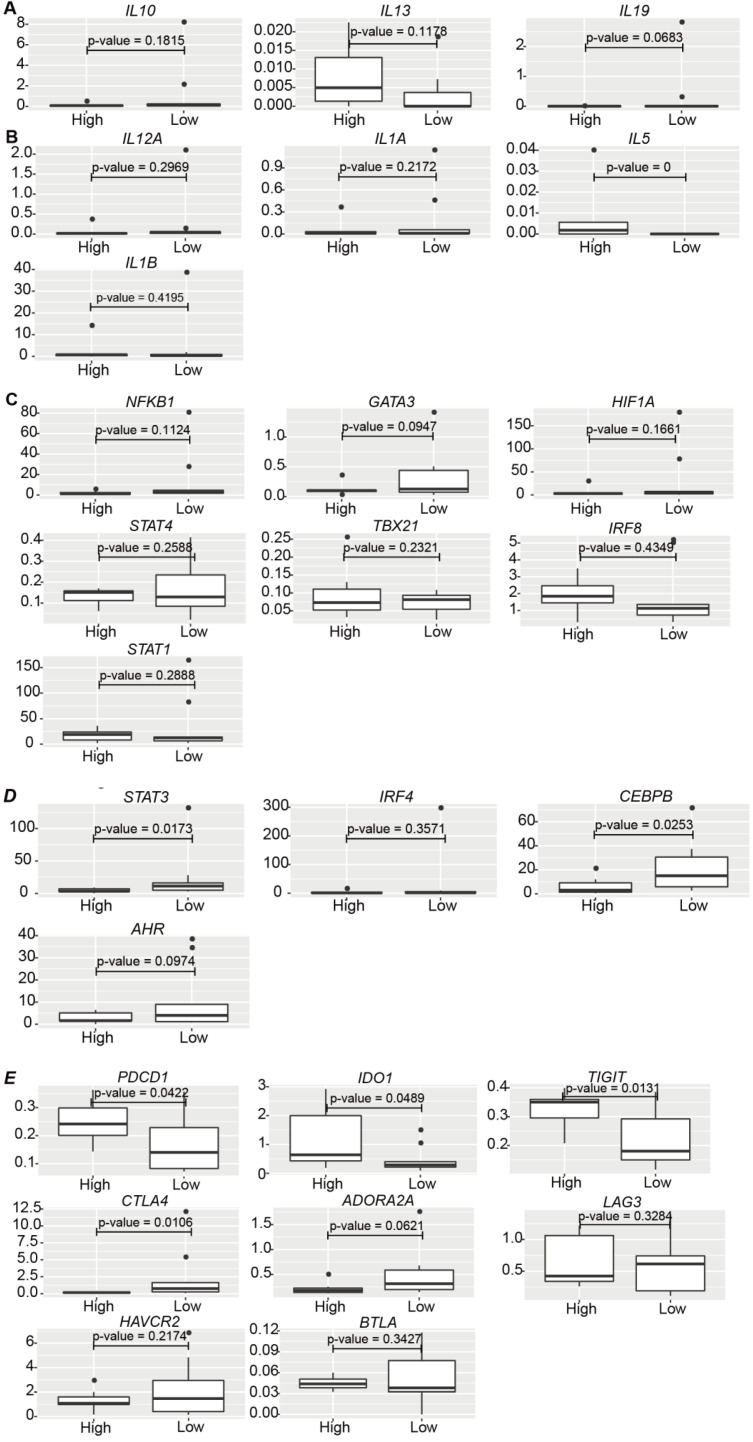
Rationale: TCR-T cell therapy plays a critical role in the treatment of malignant cancers. However, it is unclear how TCR-T cells are affected by PD-L1 molecule in the tumor environment. We performed an in-depth evaluation on how differential expressions of tumor PD-L1 can affect the functionality of T cells. Methods: We used MART-1-specific TCR-T cells (TCR-TMART-1), stimulated with MART-127-35 peptide-loaded MEL-526 tumor cells, expressing different proportions of PD-L1, to perform cellular assays and high-throughput single-cell RNA sequencing. Results: Different clusters of activated or cytotoxic TCR-TMART-1 responded divergently when stimulated with tumor cells expressing different percentages of PD-L1 expression. Compared to control T cells, TCR-TMART-1 were more sensitive to exhaustion, and secreted not only pro-inflammatory cytokines but also anti-inflammatory cytokines with increasing proportions of PD-L1+ tumor cells. The gene profiles of chemokines were modified by increased expression of tumor PD-L1, which concurrently downregulated pro-inflammatory and anti-inflammatory transcription factors. Furthermore, increased expression of tumor PD-L1 showed distinct effects on different inhibitory checkpoint molecules (ICMs). In addition, there was a limited correlation between the enrichment of cell death signaling in tumor cells and T cells and increased tumor PD-L1 expression. Conclusion: Overall, though the effector functionality of TCR-T cells was suppressed by increased expression percentages of tumor PD-L1 in vitro, scRNA-seq profiles revealed that both the anti-inflammatory and pro-inflammatory responses were triggered by a higher expression of tumor PD-L1. This suggests that the sole blockade of tumor PD-L1 might inhibit not only the anti-inflammatory response but also the pro-inflammatory response in the complicated tumor microenvironment. Thus, the outcome of PD-L1 intervention may depend on the final balance among the highly dynamic and heterogeneous immune regulatory circuits.

Keywords: PD-L1; TCR-T; differential expression; melanoma; single-cell RNA sequencing.


Conflict of interest statement

Competing Interests: The authors have declared that no competing interest exists.

Figures

Figure 1
Figure 1
PD-L1 expression on melanoma MEL-526 cells pulsed with MART-126-35 peptide inhibited cytotoxicity and cytokine secretion of TCR-TMART-1. (A) Overview of the study design. Tnull, control T cells; TCR-TMART-1, MART-1 specific TCR-T cells. (B) TCR-TMART-1 cytotoxicity against MEL-526 cells loaded with or without MART-126-35 peptide at an E:T ratio of 1:1. (C) Flow cytometric analysis of PD-L1 expression on PD-L1low, PD-L1int, and PD-L1high MEL-526 cells. (D) TCR-TMART-1 cytotoxicity was inhibited by tumor PD-L1 in a dose dependent manner. T and TCR-T cells were incubated with different proportions of PD-L1+ MEL-526 cells for 24 h. (E) Secretion of Granzyme A and Granzyme B by TCR-TMART-1 was inhibited by increased tumor PD-L1. Tnull and TCR-TMART-1 were co-cultured with MART-126-35 peptide loaded-MEL526 cells with different proportions of PD-L1 expression at an E:T ratio of 1:1, and the secretion was detected by the Cytometric Bead Array (CBA) system. (F) Secretion of TNF-α by TCR-TMART-1 was inhibited by an increased proportion of PD-L1 expression among MEL-526 cells. (G) Secretion of IFN-γ and IL-2 by TCR-TMART-1 was inhibited by an increased percentage of PD-L1 expression among MEL-526 cells. Error bars represent S.E.M. (N = 3). (∗) 0.01 < P < 0.05, (∗∗) 0.001 < P < 0.01, (∗∗∗) P < 0.001. NS, not significant. N = 3.
Figure 2
Figure 2
Single-cell level analysis revealed distinct cell subpopulations. (A) Cell number of Tnull, TCR-TMART-1, MEL-526 (nonPD-L1), and MEL-526 (PD-L1 OE) of four experiment groups. (B) The UMAP projection of T cells and tumor cells, showing 18 main clusters in different colors. The phenotype description of each cluster is determined by marker gene expression of T cells and tumor cells. (C) Violin plots showing the expression profile of marker genes of T cells and tumor cells in the 18 clusters. (D) Heatmap of T cell clusters with unique signature genes. (E) The ordering of T cells along pseudotime in a two-dimensional state-space defined by Monocle2. Cell orders were inferred from the expression of most dispersed genes across T cell populations. Each point corresponds to a single cell, and each color represents a T cell cluster. (F) Heat map showing the gene expression that separated cells into the specialized states detected by BEAM.
Figure 3
Figure 3
Various responses between T cell clusters, and Tnull and TCR-TMART-1 to different levels of tumor PD-L1. (A) Cluster composition of Tnull and TCR-TMART-1. (B) The proportion distribution of T cell clusters with the increased tumor PD-L1. (C) The bar plot shows the proportion distribution of cells expressing CTLA4, HAVCR2 (TIM3), LAG3, PDCD1, TIGIT, and VSIR among the five T cell clusters, respectively (cutoff: UMI of the gene > 0). (D) The bubble plot shows the proportion distribution of T cells expressing BCL2L11, CASP3, CASP8, CASP9, MKI67, and TP53 in TCR-TMART-1 responding to differential proportions of PD-L1+ tumor, among the five clusters respectively. The size of the point shows the mean expression of genes in the corresponding T cell population. The violin shows the expression distribution of BCL2L11 among the five clusters. (E) Differentially expressed genes in TCR-TMART-1 responding to differential proportions of PD-L1+ tumor. (F) The expression distribution of XCL1, TNFRSF9, DUSP4, and MIF in TCR-TMART-1 responding to differential proportions of PD-L1+ tumor. (G) Bubble plot showing the top 10 pathways in Tnull (left) and TCR-TMART-1 (right) compared to the control group, respectively. The color represents pvalue and the size represents gene ratio.
Figure 4
Figure 4
Influences of increased tumor PD-L1 on cellular and molecular responses of T cells. (A) The expression profile of cytokines in Tnull and TCR-TMART-1. (B) The expression distribution of IL13 and IL5 in Tnull and TCR-TMART-1 responding to PD-L1high. (C) The expression profile of chemokines in Tnull and TCR-TMART-1. (D) The expression distribution of CCL4 and CCR5 in T cell clusters of Tnull and TCR-TMART-1 responding to differential proportions of PD-L1+ tumor. (E) The expression profile of transcription factors in Tnull and TCR-TMART-1. (F) The expression distribution of NKFB1, GATA3, HIF1A, STAT4, TBX21, IRF8, and STAT1 in TCR-TMART-1 responding to differential proportions of PD-L1+ tumor. (G) The violin showing the expression levels of STAT3, IRF4, CEBPB, and AHR in TCR-TMART-1 responding to differential proportions of PD-L1+ tumor.
Figure 5
Figure 5
Increased tumor PD-L1 influenced both inhibitory and stimulatory checkpoint molecules in T cells. (A) Expression of inhibitory checkpoint molecules (ICMs) in Tnull and TCR-TMART-1 with increased ratios of PD-L1+ tumor cells. (B) The bar plot shows the proportion distribution of cells expressing different ICMs in Tnull and TCR-TMART-1 targeting different ratios of PD-L1+ tumor cells (cutoff: UMI of the gene > 0). (C) Expression of stimulatory checkpoint molecules (SCMs) in Tnull and TCR-TMART-1. (D) The bar plot shows the proportion distribution of cells expressing different SCMs in Tnull and TCR-TMART-1 targeting different ratios of PD-L1+ tumor cells (cutoff: UMI of the gene > 0). (E) The expression distribution of ICOS in cell clusters of Tnull and TCR-TMART-1 responding to differential proportions of PD-L1+ tumor.
Figure 6
Figure 6
Increased expression of tumor PD-L1 affected death of tumor cells and T cells without direct correlation. (A) GSVA analysis of cell death pathways in tumor cells (top) and violin plot showing the expression level of PD-L1 in tumor cells (bottom). (B) GSVA analysis of cell death pathways in tumor cells either expressing PD-L1 or not. (C) GSVA analysis of cell death pathways in different tumor clusters. (D) The expression levels of PDL1 among cancer clusters. (E) GSVA analysis of cell death pathways in different subsets of T cells. (F) The expression of CD274 in Tnull and TCR-TMART-1 responding to differential proportions of PD-L1+ tumor. (G) The percentage (left) and intensity (right) of PD-L1 expression on tumor cells after incubation with MEL-526 cells for 24 h. (H) The expression distribution of apoptotic genes in T cell clusters of TCR-TMART-1 responding to differential proportions of PD-L1+ tumor.
Figure 7
Figure 7
The clinical relevance of the effect of PD-L1 expression on gene expression in melanoma patients. (A) The expression of IL10, IL13, and IL19 in PD-L1low (n = 9) and PD-L1high (n = 7) patients (Cutoff = 0.003). (B) The expression of IL12A, IL1A, IL5, and IL1B in PD-L1low (n = 9) and PD-L1high (n = 7) patients. (C) The expression of NFKB1, GATA3, HIF1A, STAT4, TBX21, IRF8, and STAT1 in PD-L1low (n = 9) and PD-L1high (n = 7) patients. (D) The expression of STAT3, IRF4, CEBPB, and AHR in PD-L1low (n = 9) and PD-L1high (n = 7) patients. (E) The expression of PDCD1, IDO1, TIGIT, CTLA4, ADORA2A, LAG3, HAVCR2, and BTLA in PD-L1low (n = 9) and PD-L1high (n = 7) patients. The p value was all determined by permutation test.

Similar articles

Cited by

References

    1. W Z, L C. Inhibitory B7-family molecules in the tumour microenvironment. Nat Rev Immunol. 2008;8:467–77. - PubMed
    1. Abiko K, Matsumura N, Hamanishi J, Horikawa N, Murakami R, Yamaguchi K. et al. IFN-gamma from lymphocytes induces PD-L1 expression and promotes progression of ovarian cancer. Br J Cancer. 2015;112:1501–9. - PMC - PubMed
    1. Mandai M, Hamanishi J, Abiko K, Matsumura N, Baba T, Konishi I. Dual Faces of IFNgamma in Cancer Progression: A Role of PD-L1 Induction in the Determination of Pro- and Antitumor Immunity. Clin Cancer Res. 2016;22:2329–34. - PubMed
    1. X Z, Y Z, Q Q, J Z, Z L, W N. et al. PD-L1 induced by IFN-γ from tumor-associated macrophages via the JAK/STAT3 and PI3K/AKT signaling pathways promoted progression of lung cancer. Int J Clin Oncol. 2017;22:1026–33. - PubMed
    1. H D, SE S, DR S, H T, F H, DB F. et al. Tumor-associated B7-H1 promotes T-cell apoptosis: a potential mechanism of immune evasion. Nat Med. 2002;8:793–800. - PubMed

Publication types

MeSH terms