. 2021 Mar 5;11(10):5010-5027.
doi: 10.7150/thno.55645. eCollection 2021.

Deciphering the autophagy regulatory network via single-cell transcriptome analysis reveals a requirement for autophagy homeostasis in spermatogenesis

Affiliations

Deciphering the autophagy regulatory network via single-cell transcriptome analysis reveals a requirement for autophagy homeostasis in spermatogenesis

Mei Wang et al. Theranostics. .

Abstract

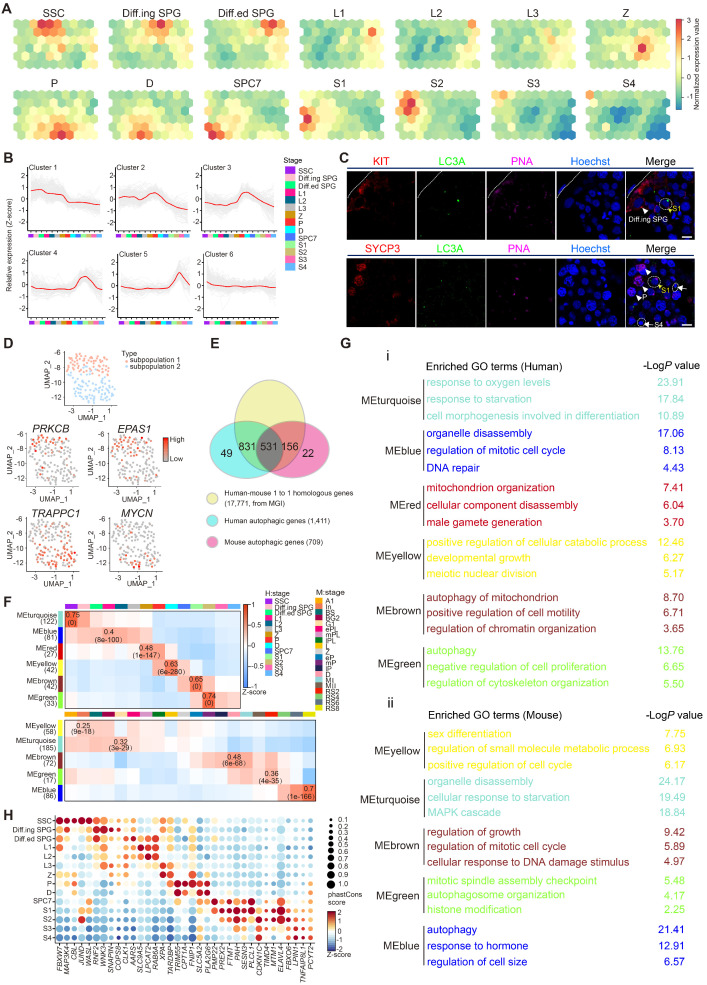
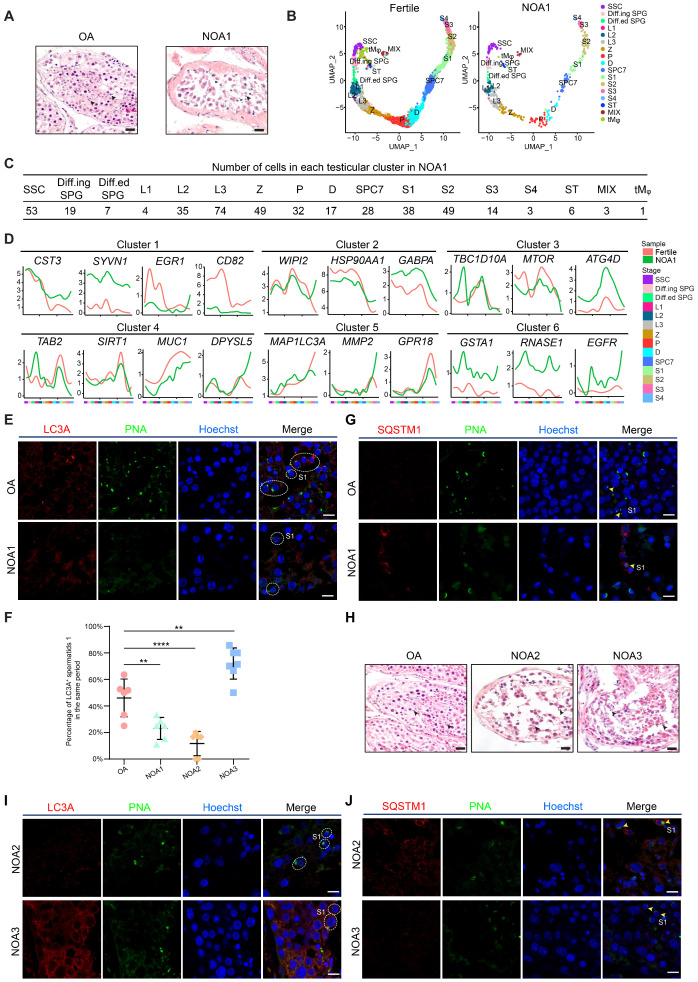
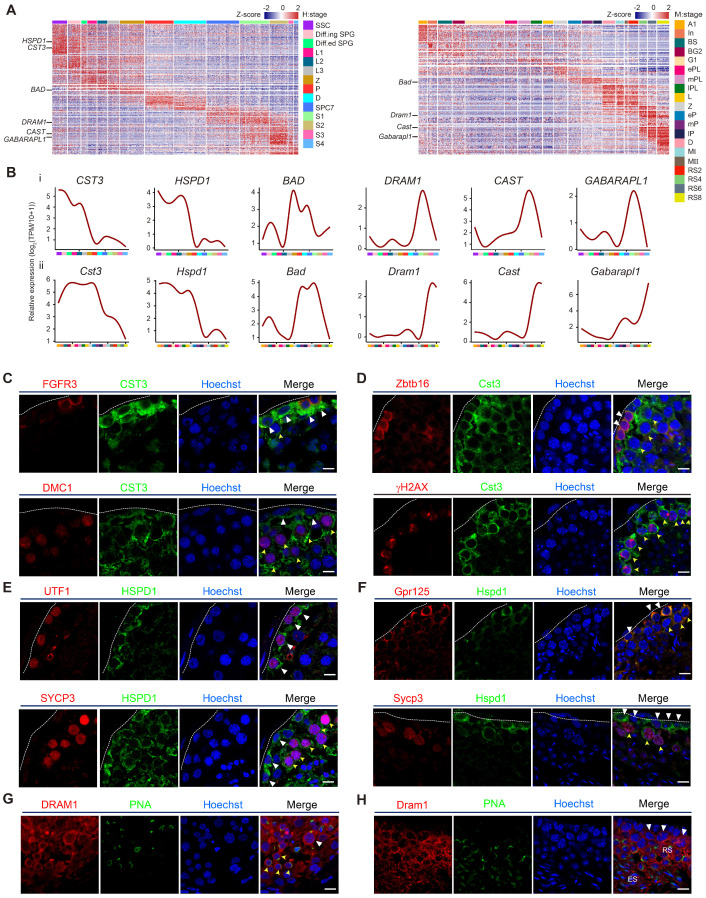
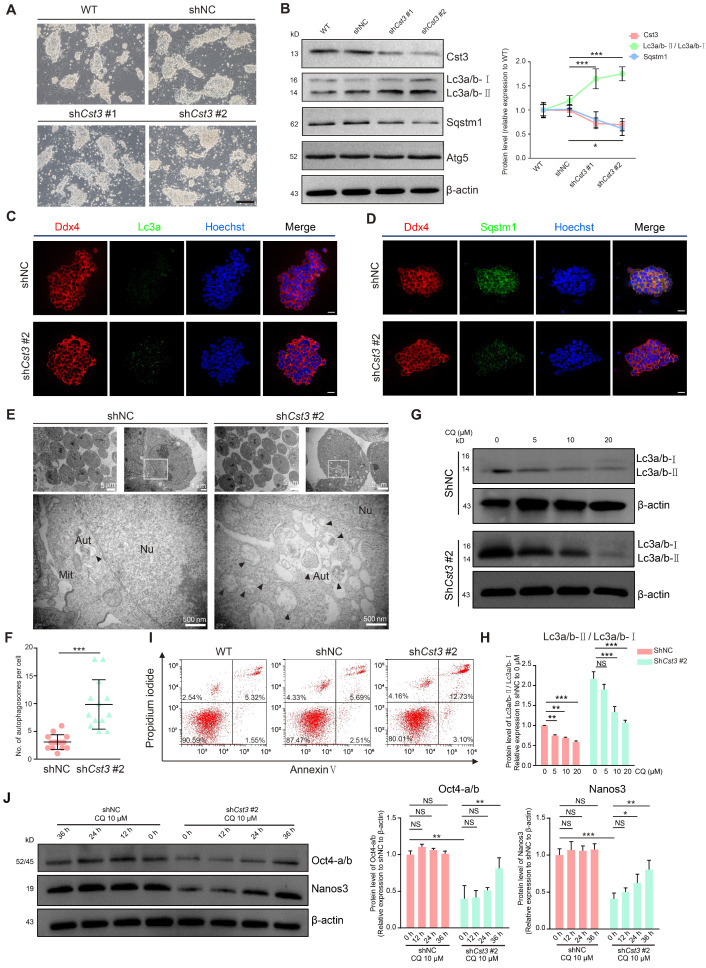
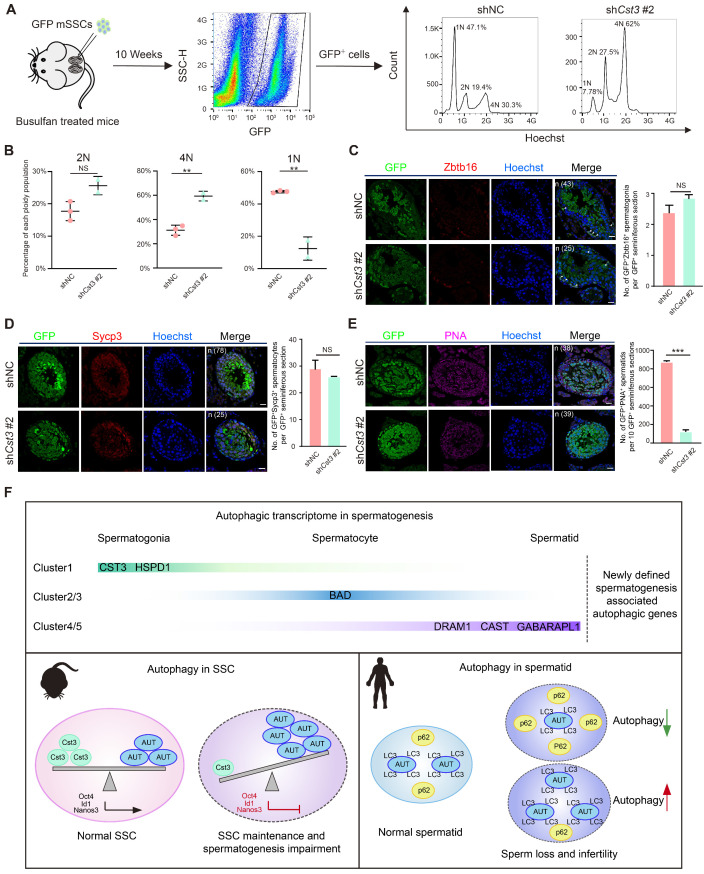
Background: Autophagy has been implicated as a crucial component in spermatogenesis, and autophagy dysfunction can lead to reproductive disorders in animal models, including yeast, C. elegans and mice. However, the sophisticated transcriptional networks of autophagic genes throughout human spermatogenesis and their biological significance remain largely uncharacterized. Methods: We profiled the transcriptional signatures of autophagy-related genes during human spermatogenesis by assessing specimens from nine fertile controls (including two normal persons and seven obstructive azoospermia (OA) patients) and one nonobstructive azoospermia (NOA) patient using single-cell RNA sequencing (scRNA-seq) analysis. Dysregulation of autophagy was confirmed in two additional NOA patients by immunofluorescence staining. Gene knockdown was used to identify the role of Cst3 in autophagy during spermatogenesis. Results: Our data uncovered a unique, global stage-specific enrichment of autophagy-related genes. Human-mouse comparison analysis revealed that the stage-specific expression pattern of autophagy-related genes was highly conserved in mammals. More importantly, dysregulation of some clusters of autophagy-related genes was observed in NOA patients, suggesting the association of autophagy with male infertility. Cst3, a human-mouse conserved and autophagy-related gene that is actively expressed in spermatogonia and early spermatocytes, was found to regulate spermatogonial stem cell (SSC) maintenance and subsequent male germ cell development. Knockdown of Cst3 increased autophagic activity in mouse SSCs and subsequently suppressed the transcription of SSC core factors such as Oct4, Id1, and Nanos3, which could be efficiently rescued by manipulating autophagic activity. Conclusions: Our study provides comprehensive insights into the global transcriptional signatures of autophagy-related genes and confirms the importance of autophagy homeostasis in SSC maintenance and normal spermatogenesis, opening new avenues for further dissecting the significance of the autophagy regulatory network in spermatogenesis as well as male infertility.

Keywords: autophagy; male infertility.; meiosis; single-cell RNA sequencing; spermatogenesis; spermatogonial stem cells.


Conflict of interest statement

Competing Interests: The authors have declared that no competing interest exists.

Figures

Figure 1
Figure 1
Global transcriptional signatures of autophagic genes in human spermatogenesis. (A) Temporal expression of autophagic genes represented by the SOM algorithm; a distinct set of autophagy-related genes are enriched in each cell cluster. A gradient of green to red indicates low to high normalized expression values. Spermatogonial stem cell (SSC), differentiating spermatogonia (Diff.ing SPG), differentiated spermatogonia (Diff.ed SPG), leptotene 1 (L1), leptotene 2 (L2), leptotene 3 (L3), zygotene (Z), pachytene (P), diplotene (D), spermatocyte 7 (SPC7), spermatid 1 (S1), spermatid 2 (S2), spermatid 3 (S3), spermatid 4 (S4). (B) K-means clustering of differentially expressed autophagic genes throughout human spermatogenesis into six individual clusters. (C) Immunofluorescence of KIT (red, top) and SYCP3 (red, bottom) co-stained with LC3A (green) and PNA (pink) in adult human testicular paraffin sections from one OA donor as a control. Differentiating spermatogonia (Diff.ing SPG), pachytene (P), spermatid 1 (S1), spermatid 4 (S4). The scale bars represent 10 μm. (D) UMAP showing two subpopulations of human SSCs (top). Gene expression patterns of specific autophagic genes on UMAP plots. PRKCB and EPAS1 were enriched in subpopulation 1, and TRAPPC1 and MYCN were enriched in subpopulation 2 (middle and bottom, respectively). A gradient of gray to red indicates low to high expression levels. (E) Venn diagram showing the distribution and relationship between human-mouse homologous genes (17,771) and human (1,411)- and mouse (709)- autophagic genes. (F) WGCNA map showing modules derived from 531 homologous autophagic genes enriched in each human (top)- and mouse (bottom)- spermatogenic cell cluster. Pearson correlation coefficients (top) and P values (bottom) to calculate the correlations between gene modules and cell clusters were highlighted in some cells. (G) Enriched GO terms and P values of modules in Figure 1F are indicated by distinct colors. (H) Bubble plot showing the top five autophagic genes derived from 37 DEGs of 14 human spermatogenic cell clusters in Figure S1G. The size of each circle represents each gene's phastCons score. A gradient of blue to red indicates low to high expression levels.
Figure 2
Figure 2
Dysregulation of the autophagic transcriptome in male infertility. (A) H&E staining of testicular sections from one donor with OA (left) and one donor with NOA (NOA1, right). Arrowheads indicate spermatids. The scale bars represent 40 μm. (B) UMAP plots of adult human testicular cells of donors with normal fertility (left) and one NOA patient (right). (C) Number of testicular cells in each cluster from patient NOA1. Spermatogonial stem cell (SSC), differentiating spermatogonia (Diff.ing SPG), differentiated spermatogonia (Diff.ed SPG), leptotene 1 (L1), leptotene 2 (L2), leptotene 3 (L3), zygotene (Z), pachytene (P), diplotene (D), spermatocyte 7 (SPC7), spermatid 1 (S1), spermatid 2 (S2), spermatid 3 (S3), spermatid 4 (S4), Sertoli cells (ST), peritubular myoid cells and Leydig cells (MIX), testicular macrophages (tMφ). (D) Line chart showing the relative expression patterns of the stage-specific autophagic genes in each testicular cell cluster between fertile donors and patient NOA1. (E) Immunofluorescence of LC3A (red) and PNA (green) in adult human testicular paraffin sections from one OA donor as a control (top) and one NOA patient (NOA1, bottom), spermatid 1 (S1). The scale bars represent 10 μm. (F) Dot plot showing the percentage of LC3A+ spermatids 1 (S1) among testicular cells within the same vision in the sections of one OA donor as a control and 3 NOA patients (NOA1, NOA2 and NOA3) referring to Figures 2E and 2I. **P < 0.01, ****P < 0.0001. (G) Immunofluorescence of SQSTM1 (red) and PNA (green) in adult human testicular paraffin sections from one OA donor as a control (top) and from patient NOA1 (bottom); yellow arrowheads indicate spermatids 1 (S1). The scale bars represent 10 μm. (H) H&E staining of testicular sections from one OA donor as a control (left) and from patient NOA2 (middle) and patient NOA3 (right). The scale bars represent 40 μm. (I) Immunofluorescence of LC3A (red) and PNA (green) in adult human testicular paraffin sections from patient NOA2 (top) and NOA3 patients (bottom). The scale bars represent 10 μm. (J) Immunofluorescence of SQSTM1 (red) and PNA (green) in adult human testicular paraffin sections from NOA2 (top) and NOA3 (bottom) patients; yellow arrowheads indicate spermatids 1 (S1). The scale bars represent 10 μm.
Figure 3
Figure 3
Validation of autophagic gene expression in human and mouse spermatogenesis. (A) Heatmap of differentially expressed autophagic genes in adult human (left) and mouse (right) spermatogenic cells. The color key from blue to red indicates low to high gene expression levels. (B) Line chart showing the relative expression patterns of novel autophagic genes in each human- and mouse-spermatogenic cell cluster (i: human, ii: mouse). (C) Immunofluorescence of FGFR3 (red, top) and DMC1 (red, bottom) co-stained with CST3 (green) in adult human testicular paraffin sections from one donor with OA. Triangles indicate SSCs, yellow arrowheads indicate spermatocytes. The scale bars represent 10 μm. (D) Immunofluorescence of Zbtb16 (red, top) and γH2AX (red, bottom) co-stained with Cst3 (green) in adult mouse testicular paraffin sections from 8-week-old mice. Triangles indicate spermatogonia, and yellow arrowheads indicate spermatocytes. The scale bars represent 10 μm. (E) Immunofluorescence of UTF1 (red, top) and SYCP3 (red, bottom) co-stained with HSPD1 (green) in adult human testicular paraffin sections from one donor with OA. Triangles indicate SSCs, yellow arrowheads indicate spermatocytes. The scale bars represent 10 μm. (F) Immunofluorescence of Gpr125 (red, top) and Sycp3 (red, bottom) co-stained with Hspd1 (green) in adult mouse testicular paraffin sections from 8-week-old mice. Triangles indicate spermatogonia, yellow arrowheads indicate spermatocytes. The scale bars represent 10 μm. (G) Immunofluorescence of DRAM1 (red) co-stained with PNA (green) in adult human testicular paraffin sections from one donor with OA. Triangle indicates spermatocyte, and yellow arrowheads indicate round spermatids. The scale bar represents 10 μm. (H) Immunofluorescence of Dram1 (red) co-stained with PNA (green) in adult mouse testicular paraffin sections from 8-week-old mice. Triangles indicate spermatocytes; RS, round spermatids; ES, elongated spermatids. The scale bar represents 10 μm.
Figure 4
Figure 4
Cst3 plays a critical role in the maintenance of mSSCs by regulating autophagy. (A) Bright field images of wild-type (WT) mSSCs, mSSCs transfected with shNC and Cst3-targeted shRNAs (shCst3 #1 and shCst3 #2). The scale bars represent 200 μm. (B) Western blotting analysis of the protein levels of Cst3, two types of Lc3a/b, Sqstm1 and Atg5 in WT and shNC-, shCst3 #1- and shCst3 #2-transfected mSSCs (left). Line chart showing the grayscale intensity analysis of the bands for Cst3, two types of Lc3a/b and Sqstm1 with β-actin as the internal control (right). * P < 0.05; ***P < 0.001. (C) Immunofluorescence of Ddx4 (red) and Lc3a (green) in mouse SSCs transfected with shNC and shCst3 #2. The scale bars represent 20 μm. (D) Immunofluorescence of Ddx4 (red) and Sqstm1 (green) in mouse SSCs transfected with shNC and shCst3 #2. The scale bars represent 20 μm. (E) TEM analysis of autophagosomes in mouse SSCs transfected with shNC and shCst3 #2. Nu, nucleus; Mit, mitochondrion; AUT, autophagosomes. (F) Dot plot showing the average numbers of autophagosomes in each mouse SSC transfected with shNC and shCst3 #2. ***P < 0.001. (G) Western blotting analysis of the protein levels of two types of Lc3a/b in shNC- and shCst3 #2-transfected mSSCs after treatment with different concentrations of CQ for 24 h. (H) Bar plot showing the grayscale intensity analysis of two types of Lc3a/b in shNC- and shCst3 #2-transfected mSSCs after treatment with different concentrations of CQ for 24 h, with β-actin as the internal control. NS, not significant; **P < 0.01; ***P < 0. 001. (I) Flow cytometry analysis of cell death in WT and shNC- and shCst3 #2-transfected mSSCs through double staining with annexin V-FITC and PI. (J) Western blotting analysis of the protein levels of Oct4 and Nanos3 in shNC- and shCst3 #2-transfected SSCs treated with CQ (left) for different time periods. Bar plot showing the grayscale intensity analysis of Oct4 and Nanos3, with β-actin as the internal control (right). NS, not significant; *P < 0.05; **P < 0.01; ***P < 0. 001.
Figure 5
Figure 5
Cst3 regulates male meiosis. (A) Flow chart showing the strategy for characterizing the functions of Cst3 in mouse spermatogenesis via flow cytometry analysis of the distribution of each ploidy population in the sorted GFP+ cells after testicular transplantation with shNC- and shCst3 #2-transfected SSCs labeled with GFP. (B) Dot plots showing the percentage of each ploidy population among the sorted GFP+ cells after testicular transplantation with shNC- and shCst3 #2-transfected mSSCs labeled with GFP. NS, not significant; **P < 0.01. (C) Immunofluorescence of GFP (green) and Zbtb16 (red) in testicular paraffin sections transplanted with shNC- and shCst3 #2-transfected mSSCs. 'n' represents the number of testicular sections calculated in this panel. Triangles indicate double positive SSCs. The scale bars represent 20 μm. Box plot showing the number of GFP+Zbtb16+ spermatogonia per GFP+ seminiferous section, NS, not significant (right). (D) Immunofluorescence of GFP (green) and Sycp3 (red) in testicular paraffin sections transplanted with shNC- and shCst3 #2-transfected mSSCs. 'n' represents the number of testicular sections calculated in this panel. The scale bars represent 20 μm. Box plot showing the number of GFP+Sycp3+ spermatocytes per GFP+ seminiferous section, NS, not significant (right). (E) Immunofluorescence of GFP (green) and PNA (pink) in testicular paraffin sections transplanted with shNC- and shCst3 #2-transfected mSSCs. 'n' represents the number of testicular sections calculated in this panel. The scale bars represent 20 μm. Box plot showing the number of GFP+PNA+ spermatids per 10 GFP+ seminiferous sections, ***P < 0.001 (right). (F) Summary of the study. The expression patterns of newly identified spermatogenesis-associated autophagic genes throughout spermatogenesis. Cst3 is a negative autophagy regulator in mSSCs. Cst3-mediated autophagy plays important roles in SSC maintenance by regulating the expression of core factors (Oct4, Id1, and Nanos3). Data from NOA patients revealed that autophagy homeostasis is required for normal spermatogenesis and that dysfunctions in autophagy activity are highly associated with human male infertility.

Similar articles

Cited by

References

    1. Zuccarello D, Ferlin A, Cazzadore C, Pepe A, Garolla A, Moretti A. et al. Mutations in dynein genes in patients affected by isolated non-syndromic asthenozoospermia. Hum Reprod. 2008;23:1957–62. - PubMed
    1. Heidary Z, Saliminejad K, Zaki-Dizaji M, Khorram Khorshid HR. Genetic aspects of idiopathic asthenozoospermia as a cause of male infertility. Hum Fertil (Camb) 2018. pp. 1–10. - PubMed
    1. Li L, Sha YW, Su ZY, Mei LB, Ji ZY, Zhang Q. et al. A novel mutation in HAUS7 results in severe oligozoospermia in two brothers. Gene. 2018;639:106–10. - PubMed
    1. Sohni A, Tan K, Song HW, Burow D, de Rooij DG, Laurent L. et al. The Neonatal and Adult Human Testis Defined at the Single-Cell Level. Cell Rep. 2019;26:1501–17. e4. - PMC - PubMed
    1. Grive KJ, Hu Y, Shu E, Grimson A, Elemento O, Grenier JK. et al. Dynamic transcriptome profiles within spermatogonial and spermatocyte populations during postnatal testis maturation revealed by single-cell sequencing. PLoS Genet. 2019;15:e1007810. - PMC - PubMed

Publication types

Supplementary concepts