. 2021 Mar 5;11(10):5028-5044.
doi: 10.7150/thno.56141. eCollection 2021.

Distinct placental molecular processes associated with early-onset and late-onset preeclampsia

Affiliations

Distinct placental molecular processes associated with early-onset and late-onset preeclampsia

Zhonglu Ren et al. Theranostics. .

Abstract

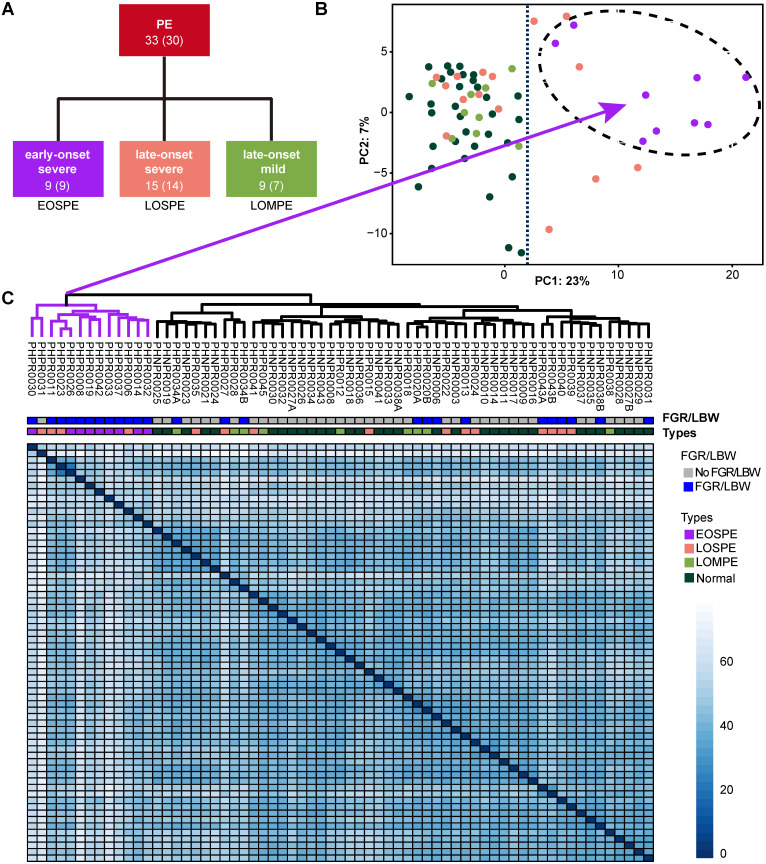
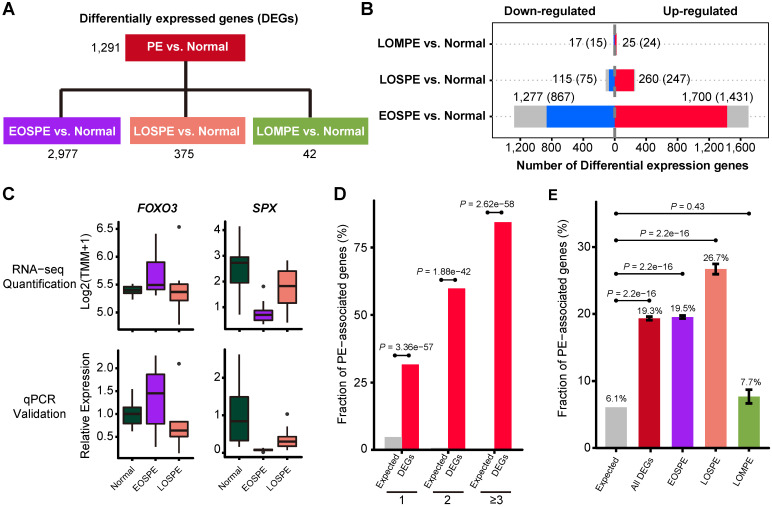
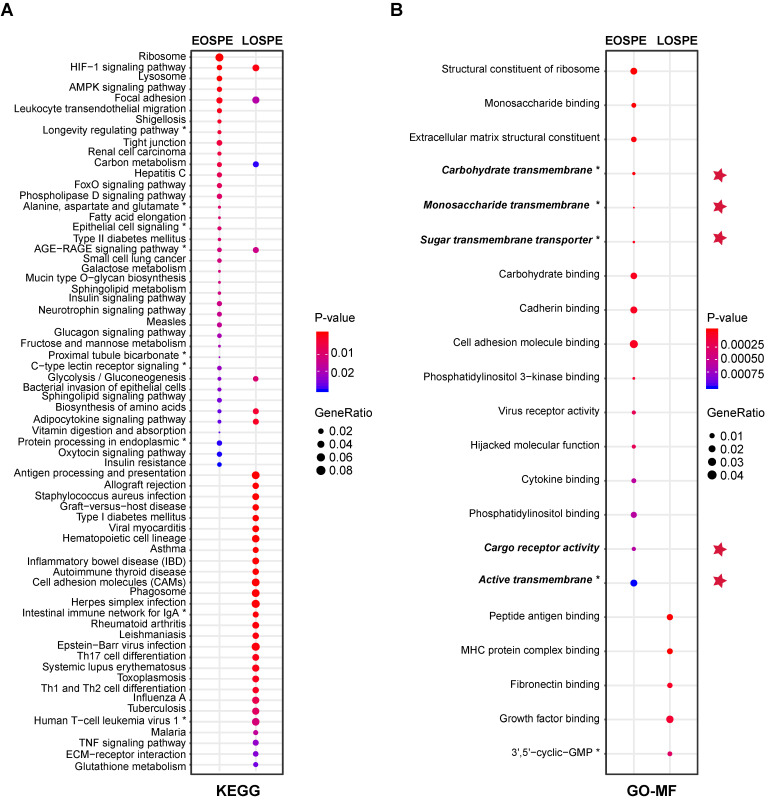
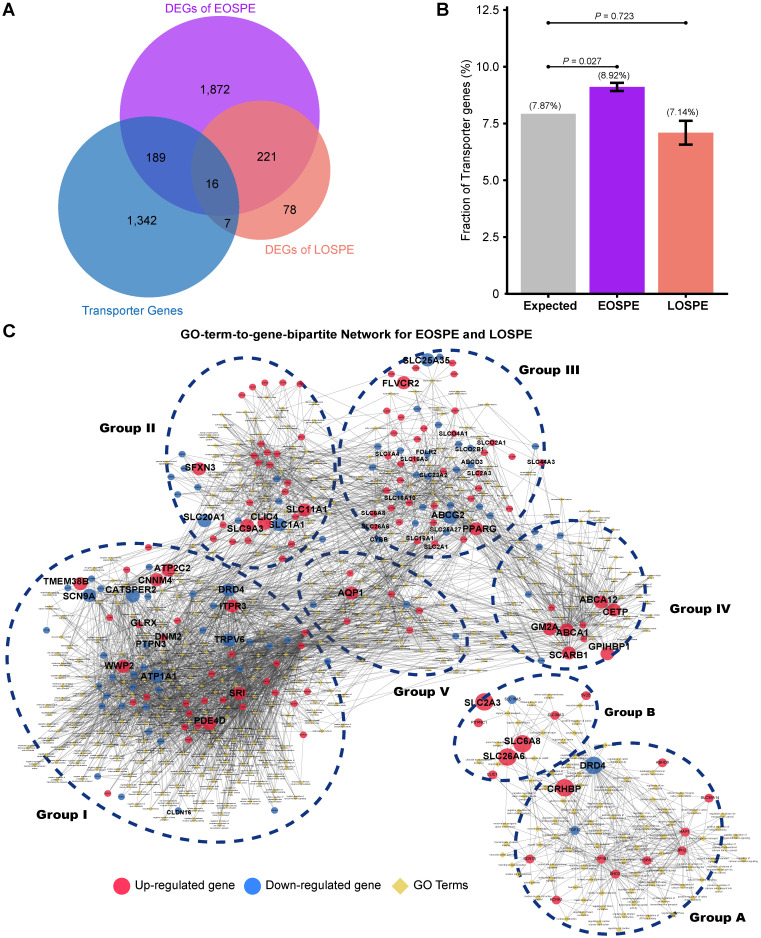
Background: Patients with preeclampsia display a spectrum of onset time and severity of clinical presentation, yet the underlying molecular bases for the early-onset and late-onset clinical subtypes are not known. Although several transcriptome studies have been done on placentae from PE patients, only a small number of differentially expressed genes have been identified due to very small sample sizes and no distinguishing of clinical subtypes. Methods: We carried out RNA-seq on 65 high-quality placenta samples, including 33 from 30 patients and 32 from 30 control subjects, to search for dysregulated genes and the molecular network and pathways they are involved in. Results: We identified two functionally distinct sets of dysregulated genes in the two major subtypes: 2,977 differentially expressed genes in early-onset severe preeclampsia, which are enriched with metabolism-related pathways, notably transporter functions; and 375 differentially expressed genes in late-onset severe preeclampsia, which are enriched with immune-related pathways. We also identified some key transcription factors, which may drive the widespread gene dysregulation in both early-onset and late-onset patients. Conclusion: These results suggest that early-onset and late-onset severe preeclampsia have different molecular mechanisms, whereas the late-onset mild preeclampsia may have no placenta-specific causal factors. A few regulators may be the key drivers of the dysregulated molecular pathways.

Keywords: clinical subtypes; molecular mechanism; placenta; preeclampsia; transcriptome.


Conflict of interest statement

Competing Interests: The authors have declared that no competing interest exists.

Figures

Figure 1
Figure 1
Clinical subtypes and sample clustering using RNA-seq data. (A) Clinical subtypes of PE patients: early-onset severe PE (EOSPE), late-onset severe PE (LOSPE), late-onset mild PE (LOMPE). The numbers under each subtype are the numbers of placentae (outside the brackets) and the numbers of patients (inside the brackets). (B) Principal component analysis (PCA). The top two principal components in this dataset represent up to 30% of all variations. Samples of EOSPE clustered on the right side (within the dashed circle), while samples of LOSPE and LOMPE are clustered together with normal samples on the left side. (C) Heatmap of sample-sample distance using the Ward's method. The EOSPE samples are clustered as the branch on the left, roughly corresponding to the samples in the right area of the PCA plot. The LOSPE and LOMPE samples are clustered together with normal samples on the right side. Four LOSPE samples were clustered with EOSPE.
Figure 2
Figure 2
Differentially expressed genes in preeclamptic placentae. (A) The differentially expressed genes (DEGs) for each group were identified using two methods, DESeq2 and edgeR. The 4 comparisons of the RNA-seq data include: all PE samples vs. normal controls, EOSPE samples vs. controls, LOSPE samples vs. controls, or LOMPE samples vs. controls. (B) The red bars represent up-regulated genes, the blue bars represent down-regulated genes and the grey bars non-coding genes. Numbers represent DEGs in each group, and numbers in brackets represent protein-coding DEGs. (C) DEGs verified by qPCR. FOXO3: RNA-seq quantification boxplot at top-left panel and qPCR validation result at bottom-left panel. SPX: RNA-seq quantification boxplot at top-right panel and qPCR validation result at bottom-right panel. (D) The enrichment of PE associated genes in DEGs. PE-associated genes were curated from literature (Table S4). Of the genes that appear once, twice and three or more times in literature, 31.7%, 59.9% and 84.4% were recovered by the DEGs we identified in PE. The X-axis represents the number of times of a gene reported in the literature, the Y-axis represents the fraction of reported PE-associated genes under each category, with red bars representing fractions of PE-associated genes that appear once, twice, and three or more times in different literature, and gray bars the expected fractions. (E) The enrichment of known PE-associated genes in protein-coding DEGs in EOSPE (2,298 genes), LOSPE (322 genes), LOMPE (39 genes) and all DEGs (2,405 genes). We collected 1,177 PE-associated genes from the literature (Table S4 and Methods), and calculated the their enrichment in DEGs of different groups: red bar represents the fraction of PE-associated genes in all DEGs (19.3%, P = 2.2e-16), purple bar EOSPE (19.5%, P = 2.2e-16), pink bar LOSPE (26.7%, P = 2.2e-16) and light-green bar LOMPE (7.7%, P = 0.4261), compared to gray bar which represents the expected ratio (6.1%) of 1,177 PE-associated genes to 19,351 human coding genes (GRCH38.p12 ENSEMBL Gene V93). One-sided Fisher's exact test was used to compare the nodes kept with the nodes removed. Error bars represent the standard error of the fraction, estimated using bootstrapping method with 100 resamplings.
Figure 3
Figure 3
Enrichment of KEGG pathways and GO molecular function (MF) terms with differentially expressed protein-coding genes of EOSPE and LOSPE. (A) Enriched KEGG pathways with protein-coding DEGs of EOSPE and LOSPE. To save figure space, “*” is used to label the shortened terms, and the complete terms are: (1) Longevity regulating pathway - multiple species (2) Alanine, aspartate and glutamate metabolism (3) Epithelial cell signaling in Helicobacter pylori infection (4) AGE-RAGE signaling pathway in diabetic complications (5) Proximal tubule bicarbonate reclamation (6) C-type lectin receptor signaling pathway (7) Protein processing in endoplasmic reticulum (8) Intestinal immune network for IgA production (9) Human T-cell leukemia virus 1 infection. (B) Enriched GO MF terms with protein-coding DEGs of EOSPE and LOSPE. Dots represent the enriched KEGG pathways or GO MF terms with description of each pathway and term; colors represent scale of P-values, the sizes of dots represent ratio of DEGs in corresponding pathways and GO terms, and red stars indicate transporter terms in GO MF. To save figure space, “*” is used to label the shortened terms, and the complete terms are: (1) Carbohydrate transmembrane transporter activity (2) Monosaccharide transmembrane transporter activity (3) Sugar transmembrane transporter activity (4) Active transmembrane transporter activity (5) 3',5'-cyclic-GMP phosphodiesterase activity. Detailed information is listed in Table S5.
Figure 4
Figure 4
Functional classification of differentially expressed transporter genes. (A) The overlapping genes between the transporter genes and DEGs. Of the identified transporter genes, 205 were differentially expressed in EOSPE and 23 genes in LOSPE. (B) Fraction of transport genes in DEGs. The transporter genes were collected from Gene Ontology. Gray bar represents the expected fraction (7.87%) of transporter genes in all GO annotated genes (19,738), the fraction of transporter genes in the DEGs of EOSPE samples (8.92%), the DEGs of LOSPE (7.14%). The transporter genes were significantly enriched in the DEGs of EOSPE, but not in LOSPE. One-sided Fisher's exact test was used to calculating the P-values. Error bars represent the standard error of the fraction, estimated using bootstrapping method with 100 resamplings. (C) Gene-GO term bipartite network for enriched GO BP terms and DEGs in EOSPE and LOSPE. Blue dashed circles show 5 biological process clusters involved in different transportation processes of substrates and materials. Group I: ion channels; group II: macro-autophagy; group III: transmembrane transportation of nonlipid nutrients; group IV: transmembrane transportation of lipids; group V in transportation of hormone. In the LOPSE, the group A: ion channels; group B: transportation of chloride, carboxylic acid, cAMP and anion. Blue dashed circles show 2 biological process clusters. Red nodes represent up-regulated transporter genes and blue nodes down-regulated transporter genes, and yellow diamond nodes represent GO BP terms. The edges indicate the GO BP terms the genes belong to.
Figure 5
Figure 5
Identification of critical transcription factors that contribute to the dysregulation of pathways involved in EOSPE. (A) Transcription factor-binding motifs were searched in the DEGs of EOSPE using HOMER. Of 2977 DEGs in EOSPE, 79% (2349/2977) were predicted to be targeted by 23 TFs. (B) TF-targets network for the DEGs of EOPSE. Of the 23 enriched TFs (the triangles), 5 TFs (pink circles) target the up-regulated DEGs, 4 TFs (blue circles) target the down-regulated DEGs, and 14 TFs (purple circles) target the both up- and down-regulated DEGs. The up-regulated targets are in the red nodes (1454), and the down-regulated targets are in the blue nodes (895). (C) The Sankey diagram showing the relationship between TFs and the enriched pathways with its targets. Enrichment analysis was performed on the targets of each TF. A total number of 34 enriched pathways (the right column) were found for 10 TFs (colored column in the left). The binding motifs corresponding to TFs are listed on the left. The orange color in the right bar indicates the pathways that are overlapped with those enriched with DEGs of EOSPE (Figure 3A), and the light blue color in the right bar indicates the pathways that are newly found enriched pathways with the targets of TFs. (D-E) 'TF-Target-Pathway bipartite networks' for TFs BCL6 and HIF1A. Most of BCL6 targeting DEGs are involved in three KEGG pathways (D). The HIF1A targeting DEGs are involved in two pathways (E). Circles: non-TF genes; triangles: TFs; yellow diamonds: KEGG pathways; red: up-regulation; blue: down-regulation; light blue: no expression change.

Similar articles

Cited by

References

    1. Brown MA, Magee LA, Kenny LC, Karumanchi SA, McCarthy FP, Saito S. et al. Hypertensive Disorders of Pregnancy: ISSHP Classification, Diagnosis, and Management Recommendations for International Practice. Hypertension. 2018;72:24–43. - PubMed
    1. Aneman I, Pienaar D, Suvakov S, Simic TP, Garovic VD, McClements L. Mechanisms of Key Innate Immune Cells in Early- and Late-Onset Preeclampsia. Front Immunol. 2020;11:1864. - PMC - PubMed
    1. Mol BWJ, Roberts CT, Thangaratinam S, Magee LA, de Groot CJM, Hofmeyr GJ. Pre-eclampsia. Lancet. 2016;387:999–1011. - PubMed
    1. Raymond D, Peterson E. A critical review of early-onset and late-onset preeclampsia. Obstet Gynecol Surv. 2011;66:497–506. - PubMed
    1. Herzog EM, Eggink AJ, Reijnierse A, Kerkhof MA, de Krijger RR, Roks AJ. et al. Impact of early- and late-onset preeclampsia on features of placental and newborn vascular health. Placenta. 2017;49:72–9. - PubMed

Publication types

Substances

LinkOut - more resources