. 2021 Feb 20;11(9):4232-4250.
doi: 10.7150/thno.49819. eCollection 2021.

SPTBN1 inhibits inflammatory responses and hepatocarcinogenesis via the stabilization of SOCS1 and downregulation of p65 in hepatocellular carcinoma

Affiliations

SPTBN1 inhibits inflammatory responses and hepatocarcinogenesis via the stabilization of SOCS1 and downregulation of p65 in hepatocellular carcinoma

Ling Lin et al. Theranostics. .

Abstract

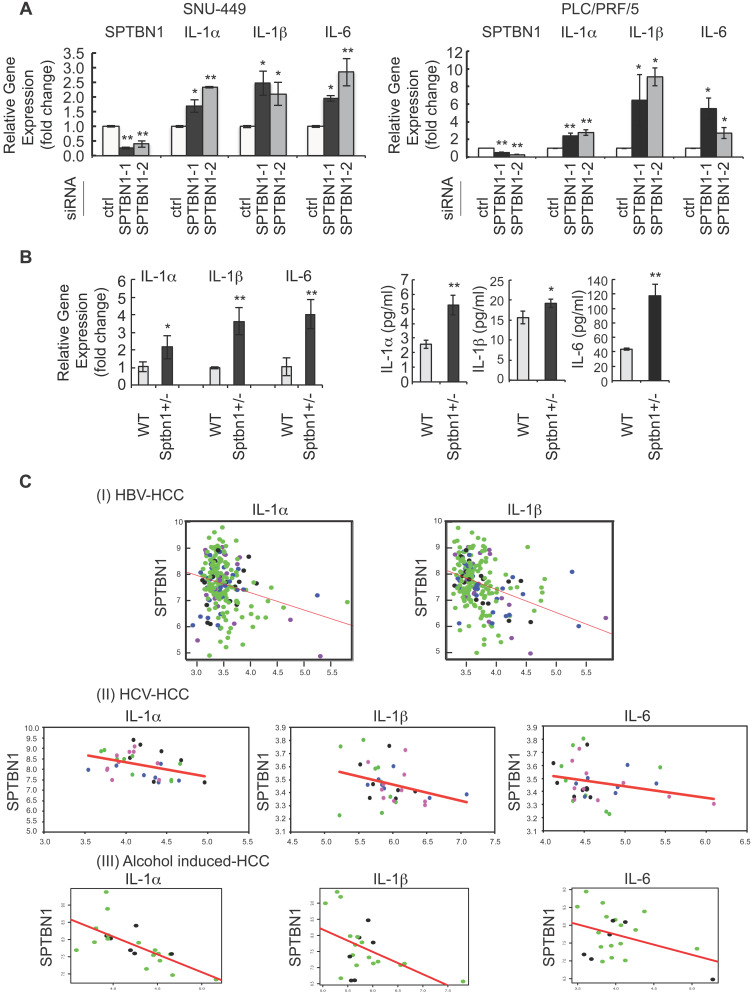
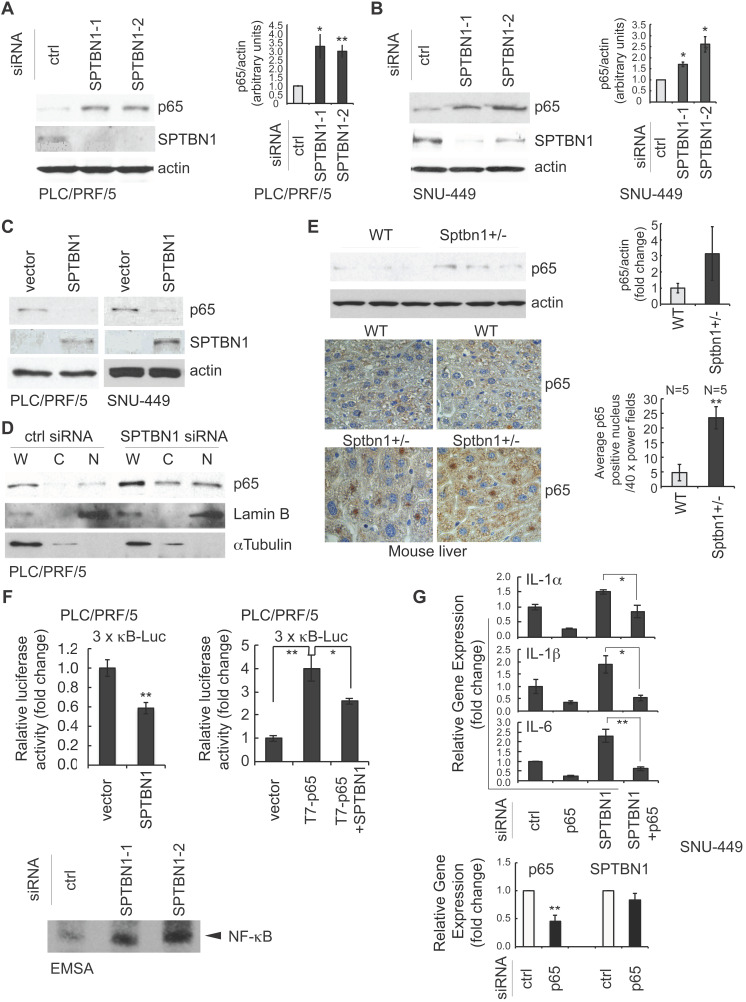
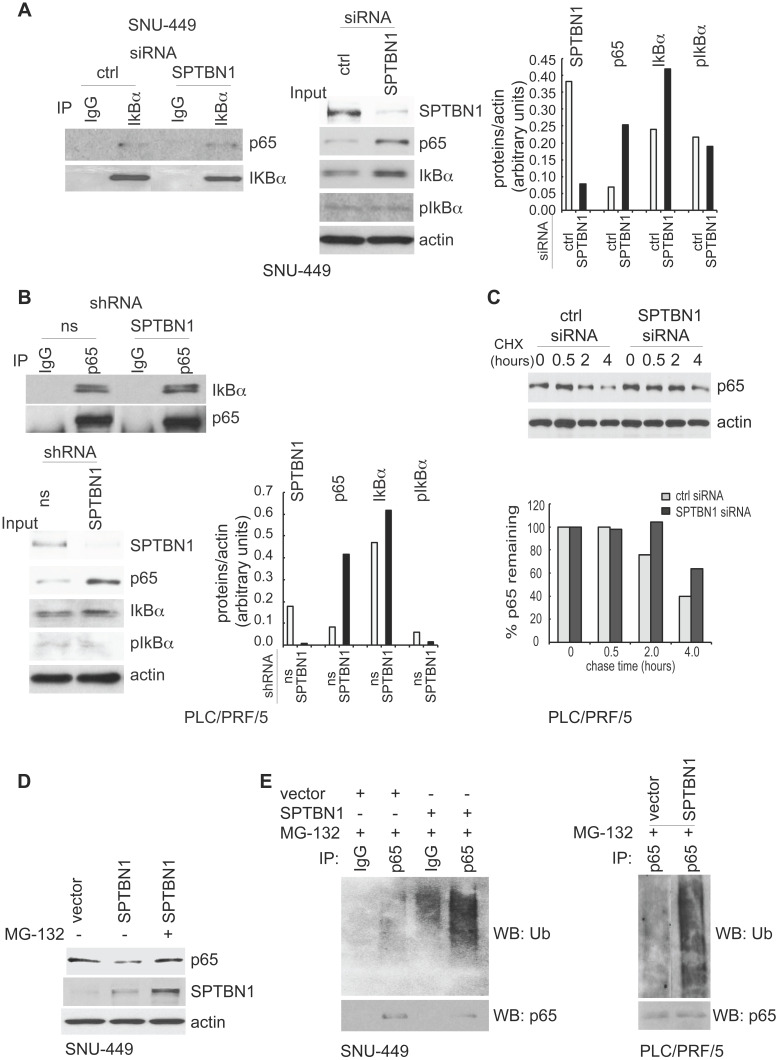
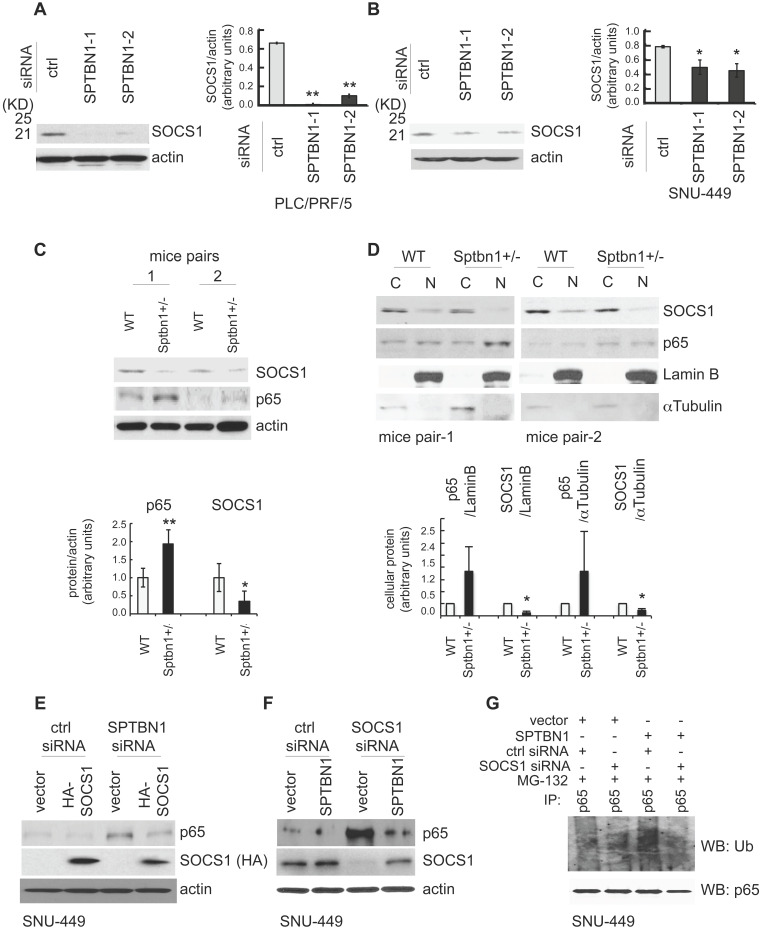
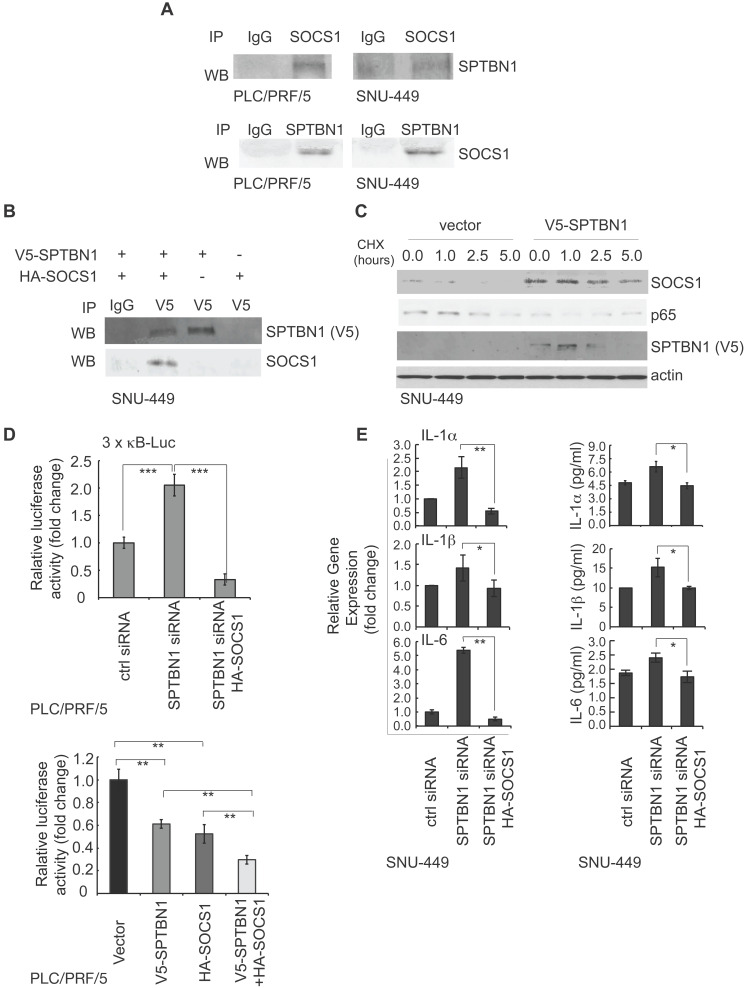
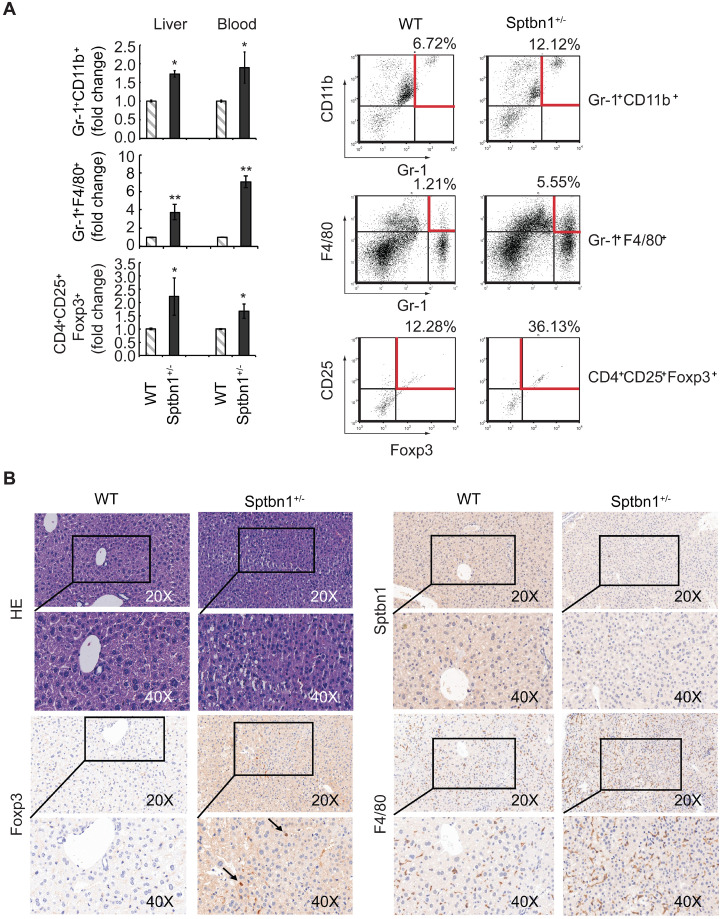
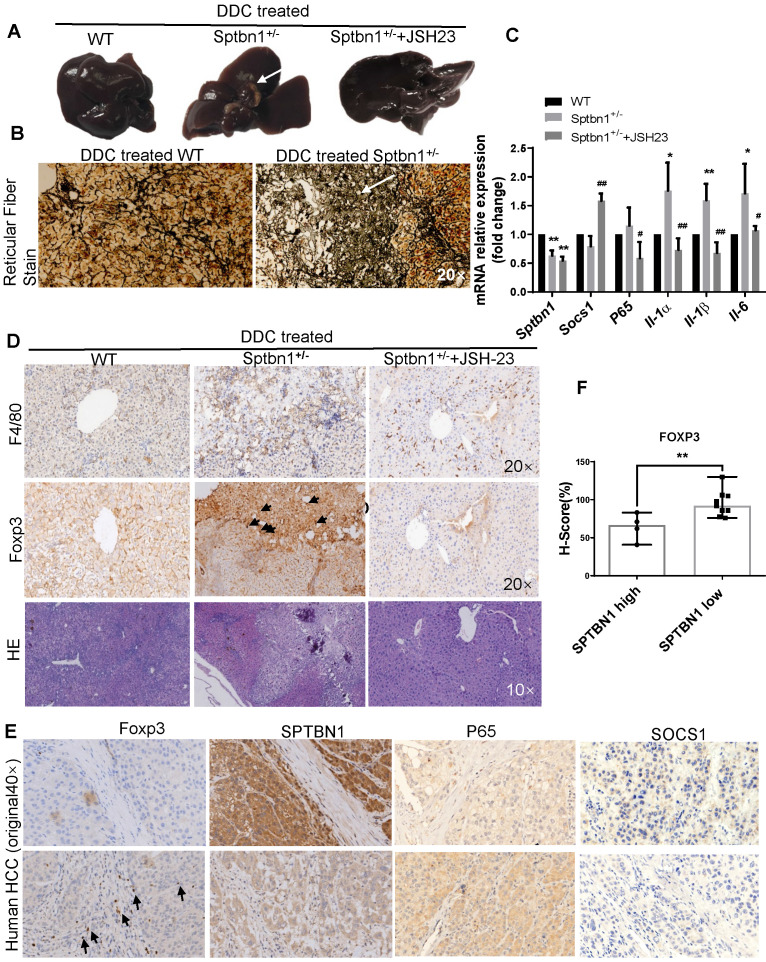
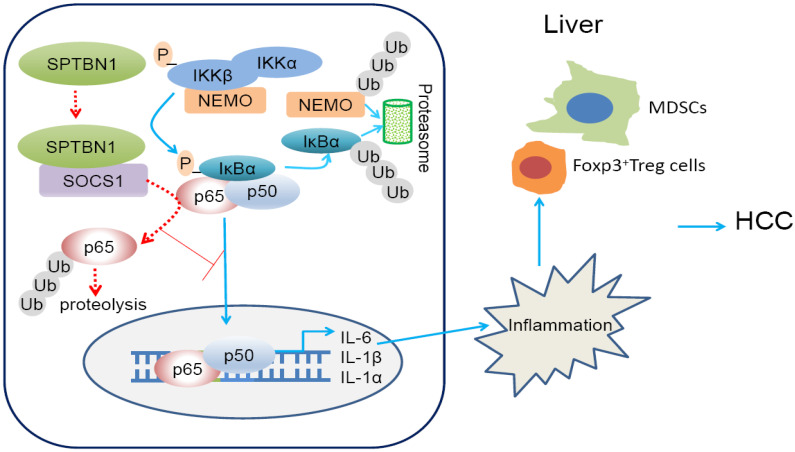
Background: Spectrin, beta, non-erythrocytic 1 (SPTBN1), an adapter protein for transforming growth factor beta (TGF-β) signaling, is recognized as a tumor suppressor in the development of hepatocellular carcinoma (HCC); however, the underlying molecular mechanisms of this tumor suppression remain obscure. Methods: The effects on expression of pro-inflammatory cytokines upon the inhibition or impairment of SPTBN1 in HCC cell lines and liver tissues of Sptbn1+/- and wild-type (WT) mice were assessed by analyses of quantitative real-time reverse-transcription polymerase chain reaction (QRT-PCR), enzyme linked immunosorbent assay (ELISA), Western blotting and gene array databases from HCC patients. We investigated the detailed molecular mechanisms underlying the inflammatory responses by immunoprecipitation-Western blotting, luciferase reporter assay, chromatin immunoprecipitation quantitative real time PCR (ChIP-qPCR), immunohistochemistry (IHC) and electrophoretic mobility shift assay (EMSA). The proportion of myeloid-derived suppressor cells in liver, spleen, bone marrow and peripheral blood samples from WT and Sptbn1+/- mice were measured by fluorescence-activated cell sorting (FACS) analysis. Further, the hepatocacinogenesis and its correlation with inflammatory microenvironment by loss of SPTBN1/SOCS1 and induction of p65 were analyzed by treating WT and Sptbn1+/- mice with 3,5-diethoxycarbonyl-1,4-dihydrocollidine (DDC). Results: Loss of SPTBN1 in HCC cells upregulated the expression of pro-inflammatory cytokines including interleukin-1α (IL-1α), IL-1β, and IL-6, and enhanced NF-κB transcriptional activation. Mechanistic analyses revealed that knockdown of SPTBN1 by siRNA downregulated the expression of suppressor of cytokine signaling 1 (SOCS1), an E3 ligase of p65, and subsequently upregulated p65 accumulation in the nucleus of HCC cells. Restoration of SOCS1 abrogated this SPTBN1 loss-associated elevation of p65 in HCC cells. In human HCC tissues, SPTBN1 gene expression was inversely correlated with gene expression of IL-1α, IL-1β and IL-6. Furthermore, a decrease in the levels of SPTBN1 gene, as well as an increase in the gene expression of IL-1β or IL-6 predicted shorter relapse free survival in HCC patients, and that HCC patients with low expression of SPTBN1 or SOCS1 protein is associated with poor survival. Heterozygous loss of SPTBN1 (Sptbn1+/- ) in mice markedly upregulated hepatic expression of IL-1α, IL-1β and IL-6, and elevated the proportion of myeloid-derived suppressor cells (MDSCs) and CD4+CD25+Foxp3+ regulatory T cells (Foxp3+Treg) cells in the liver, promoting hepatocarcinogenesis of mouse fed by DDC. Conclusions: Our findings provided evidence that loss of SPTBN1 in HCC cells increases p65 protein stability via the inhibition of SOCS1 and enhances NF-κB activation, stimulating the release of inflammatory cytokines, which are critical molecular mechanisms for the loss of SPTBN1-induced liver cancer formation. Reduced SPTBN1 and SOCS1 predict poor outcome in HCC patients.

Keywords: NF-κB; SOCS1; SPTBN1; pro-inflammatory cytokines; protein stabilization.


Conflict of interest statement

Competing Interests: The authors have declared that no competing interest exists.

Figures

Figure 1
Figure 1
An increase in inflammatory cytokines was observed in human HCC cells and in liver tissues of Sptbn1+/- mice, and an inverse correlation of SPTBN1 with IL-1α, IL-1β and IL-6 was observed in human HCV- and HBV- induced HCC as well as alcohol- induced HCC tissues. (A) PLC/PRF/5 and SNU449 cells transiently transfected with control siRNA or siRNA to SPTBN1 were cultured for 48 hours and subjected to QRT-PCR analysis for IL-1α, IL-1β and IL-6 mRNA. Significance of the mean value difference was determined using a Student's t test (*P < 0.05; **P < 0.01 compared with the control siRNA group). (B) QRT-PCR analysis of IL-1α, IL-1β and IL-6 mRNA in liver tissues from WT and Sptbn1 +/- mice (n = 5) (left). The normalized fold-change (mean ± S.D.) (comparing to WT group) were shown. The release of cytokines in cell culture medium of primary culture from single cell suspensions prepared from mouse liver tissues was measured by ELISA assay (right). The significance of the difference between WT and Sptbn1+/- livers with respect to cytokines in mRNA levels in tissues and the released protein expression in culture was determined using a Student's t test (*P < 0.05; **P < 0.01). (C) Correlation analysis of gene expression in human HBV- and HCV- induced HCC tissues using G-DOC platform. Tumor stages of the analyzed human HBV- and HCV-induced HCC cases are indicated by different dot colors: blue, very early HCC; green, early HCC; purple, very advanced HCC; and black, advance HCC. The human HBV-induced HCC data set consisted of 225 liver tumor samples and 220 paired non-tumor samples with clinical and gene expression data (I). The human HCV-induced HCC data set consisted of 75 samples representing stepwise carcinogenic processes from pre-neoplastic lesions to HCC. Of these, 33 samples including very early, early, advanced, and very advanced HCC were considered for analysis (II). The human alcohol-induced HCC data set consisted of 22 samples. Raw gene expression data was obtained from Gene expression omnibus (GEO). The correlation scatter plots were colored data based “Edmonson Grade” clinical attribute - which had values either Grade I/II-black dots or Grade II/III-green dots (III). Correlation coefficients (r) and p-values between two groups of genes selected from SPTBN1, IL-1α, IL-1β and IL-6 were obtained using Pearson correlation tests.
Figure 2
Figure 2
The suppression of inflammatory cytokines by SPTBN1 was mediated through inhibition of p65. (A and B) PLC/PRF/5 (A) and SNU-449 (B) cells were transiently transfected with siRNAs for 48 h and were then subjected to Western blot analysis. Data is representative of three independent experiments. The intensities of p65 and actin in two to three independent Western blotting were measured by ImageJ software, and the ratios of p65/actin were analyzed. Significance of the difference was evaluated using the Student's t test (*P < 0.05; **P < 0.01). (C) SNU-449 and PLC/PRF/5 cells were transiently transfected with empty vector or SPTBN1 plasmid for 48 h and were analyzed by Western blotting. (D) PLC/PRF/5 cells were transfected with control siRNA or siRNA to SPTBN1 for 48 hours and the cells were fractionated into cytoplasmic [C] and nuclear [N] fractions and subcellular distribution of p65 was assessed by Western blot analysis. The purity of nuclear fractions was verified with antibodies to Lamin B and αTubulin, respectively. W: whole cell lysate; C: cytoplasmic fraction; N: neuclear fraction. (E) Liver tissues from WT and Sptbn1+/- mice were analyzed by Western blotting (upper left) and immunohistochemistry staining (lower left) by antibodies as indicated. Quantification of the average p65 positive nuclei in 40 × power fields were shown (mean ± S.D.) (right). (F-upper) PLC/PRF/5 cells were transfected with empty vector or SPTBN1 (left), or were transfected with empty vector, T7-p65 plasmid without or with SPTBN1 plasmid (right), together with 3×κB-L reporter plasmid and pRL-TK for 48 h and were lysed to measure luciferase activity. Normalized (to the empty vector group) relative luciferase activity is shown (mean ± S.D.). Significance of the difference was evaluated using the Student's t test (*P < 0.05; **P < 0.01). (F-lower) DNA binding activity of endogenous NF-κB in HCC cells. Neuclear extracts of PLC/PRF/5 cells which were transiently transfected with siRNAs as indicated were subjected to EMSA analysis by using biotin-labeled DNA probe corresponding to NF-κB consensus DNA sequence as described in Methods. (G) SNU-449 cells were transiently transfected with siRNAs as indicated for 48 h. Cells were then analyzed by QRT-PCR for mRNA levels of IL-1α, IL-1β, IL-6 (upper panels) and p65 as well as SPTBN1 (lower panel).
Figure 3
Figure 3
SPTBN1 induces ubiquitination and degradation of p65. (A and B) Binding of p65 with IκBa kept identical in HCC cells upon the inhibition of SPTBN1. SNU-449 cells were transiently transfected with siRNAs as indicated for 48 h (A) and PLC/PRF/5 cells stably transduced with SPTBN1 shRNA or non-specific (ns) shRNA were cultured for 48h (B). Cells were then subjected to immunoprecipitation (IP) and immunoblotting with antibodies as indicated. Whole cell lysates of above cells (inputs) were analyzed by Western blotting by antibodies as indicated. Data are representative of two to three independent experiments with similar results. The intensities of SPTBN1, p65, IκBα, pIκBα and actin were measured by ImageJ software, and the relative expression level of each protein/actin was generated. (C) PLC/PRF/5 cells were transiently transfected as indicated for 48h. Cells were then treated with cycloheximide (CHX) for the indicated time periods and were analyzed for the stability of p65 by Western blotting (upper). The intensities of p65 and actin were measured by ImageJ software, and the relative expression units of p65/actin were generated and normalized relative to the expression unit in 0 h. The percentage remaining of p65 expression (compare to zero hour) was then calculated (lower). (D) SNU-449 cells were transfected as indicated for 48 h. Cells were then treated without or with 10 µM MG132 for 4 h before cell lysis and analyzed by Western blotting. (E) SNU-449 cells and PLC/PRF/5 cells were transiently transfected as indicated for 48 h. Cells were then treated with 10µM MG132 for 4 h before cell lysis. Cells were immunoprecipitated with IgG or antibody to p65 and the immunoprecipitates were then immunoblotted with anti-ubiquitin antibody to detect ubiquitination of endogenous p65.
Figure 4
Figure 4
SPTBN1 enhances the expression of SOCS1, which was required for the regulation of p65 by SPTBN1. (A-B) PLC/PRF/5 (A) or SNU-449 (B) cells were transiently transfected with siRNAs as indicated. Cells were then subjected to Western blot analysis. The relative intensities of SOCS1 to actin in two to three independent Western blotting were analyzed as in Figure 2A and 2B. Significance of the difference was evaluated using the Student's t test (*P < 0.05; **P < 0.01). (C-D) Liver tissues from two pairs of age- and gender-matched WT and Sptbn1+/- mice were analyzed by Western blotting (C). Liver tissues from two pairs of age- and gender-matched WT and Sptbn1+/- mice were lyzed and fractionated into cytoplasmic [C] and nuclear [N] fractions, and subcellular distribution of p65 and SOCS1 in each fraction was assessed by Western blotting (D). The relative intensities of p65 and SOCS1 were analyzed as in Figure 2A and 2B. (E) SNU-449 cells were transiently transfected as indicated for 48 h and were then analyzed by Western blot analysis. (F) SNU-449 cells were transiently transfected with control siRNA or siRNA to SOCS1 together with empty vector or SPTBN1 plasmid for 48 h. Cells were then analyzed by Western blot analysis. (G) SNU-449 cells were transiently transfected with control siRNA or siRNA to SOCS1 together with empty vector or SPTBN1 plasmid for 48 h. Cells were then treated with 10µM MG132 for 4 h before cell lysis. Cells were immunoprecipitated with antibody to p65 and the immunoprecipitates were then immunoblotted with anti-ubiquitin antibody to detect ubiquitination of endogenous p65.
Figure 5
Figure 5
SPTBN1 binds to SOCS1, induces the stability of SOCS1, and SOCS1 is required for the suppression of p65 by SPTBN1. (A) PLC/PRF/5 and SNU-449 cells were cultured for 48 h and were collected for immunoprecipitation by IgG or antibodies to SOCS1 or SPTBN1. The immunoprecipitates were then analyzed by Western blotting with antibodies to SPTBN1 or SOCS1. (B) SNU-449 cells were transiently transfected with V5-SPTBN1 and HA-SOCS1, V5-SPTBN1 alone or HA-SOCS1 alone for 48 h and the cells were immunoprecipitated by IgG or antibody to V5-epitope. The immune complexes were then subjected to Western blot analysis using antibody to SOCS1. (C) SNU-449 cells were transiently transfected with empty vector or SPTBN1 for 48h. Cells were then treated with cycloheximide (CHX) for the indicated time periods and were analyzed for the stability of SOCS1 and p65 by Western blotting. (D) PLC/PRF/5 cells were transfected as indicated, together with 3 × κB-L reporter plasmid and pRL-TK for 48 h and were lysed to measure luciferase activity. Normalized (to the control siRNA group or vector group) relative luciferase activity is shown (mean ± S.D.). Significance of the difference was evaluated by Student's t test (**P < 0.01; ***P < 0.001). (E) SNU-449 cells were transiently transfected with siRNAs without or with HA-SOCS1 plasmid for 48 h. Cells were analyzed by QRT-PCR (left) and harvested cell culture media were analyzed by ELISA (right).
Figure 6
Figure 6
A significant increase in the proportion of MDSCs and Foxp3+Treg cells were observed in Sptbn1+/- mice. (A) FACS analysis of MDSCs and CD4+CD25+Foxp3+Treg cells in CD45-gated single cell suspension of liver and peripheral blood was carried out for WT and Sptbn1+/- mice (n = 5, aged 6 to 8 months) after staining with antibodies as indicated. The normalized fold-change (mean ± S.D.) (comparing the % of immune cells to WT group) were shown. Significance of differences was evaluated by Student's t test (*P < 0.05 and **P < 0.01 versus WT group). Representative FACS blots of MDSCs as defined as Gr-1+CD11b+, Gr-1+F4/80+ cells, and Foxp3+Treg cells as defined as CD4+CD25+Foxp3+ cells (within areas indicated by horizontal and vertical lines in red color) from WT and Sptbn1+/- mice liver were shown. (B) Hematoxylin and eosin (HE) and immunohistochemical staining of mouse liver tissues. In liver of Sptbn1+/- mouse (2 of 4 mice, >15months), well differentiated HCC could be observed. The neoplastic cells grow in a thin trabecular pattern. These cells show mild dysplasia with a slight increase of the nucleus to cytoplasm ratio (HE panels). Numbers of Foxp3-positive Treg cells (arrow pointed) and F4/80-positive macrophages were greater in the cancerous liver of Sptbn1+/- old mouse than in WT mouse including hepatic sinusoids and perisinusoidal spaces of hepatic lobules.
Figure 7
Figure 7
Loss of SPTBN1 promotes hepatocarcinogenesis and inflammatory through p65 signaling pathway. A. Upon treatment with 0.1% DDC-containing diet for 3 months, Sptbn1+/- mice developed HCC (arrows), compared to WT and JSH-23 (p65 inhibitor) treated Sptbn1+/- mice. B. Liver tissues from WT and Sptbn1+/- mice treated with 0.1% DDC for 3 months were analyzed by Gomori's reticular fiber staining. C. Liver tissues from WT and Sptbn1+/- mice treated with 0.1%DDC in the absence or presence of JSH-23 for 3 months were analyzed by QRT-PCR. The mRNA levels of IL-1α, IL-1β, IL-6, SOCS1 and p65 were detected. *P < 0.05, **P < 0.01 (WT vs Sptbn1+/-, n = 4). D. IHC and H&E staining. Liver tissues from mice treated same as in Figure 7A were analyzed by immunohistochemistry staining by antibodies targeting macrophages and Treg cells. E. Human HCC tissues were analyzed by immunohistochemistry staining by antibodies against FOXP3, p65, SOCS1 and SPTBN1. F. FOXP3 staining was evaluated by immunohistochemistry score in human HCC. H-score was determined based on the intensity of nuclear staining and the proportion of labeled tumor cells. **P < 0.01 vs SPTBN1 high. n = 13.
Figure 8
Figure 8
Graphical abstract. Loss of SPTBN1 increases p65 protein stability via the inhibition of SOCS1 and enhances NF-κB activation, stimulating inflammatory responses and immune-suppressive conditions for the formation and progression of liver cancer.

References

    1. De Matteis MA, Morrow JS. Spectrin tethers and mesh in the biosynthetic pathway. J Cell Sci. 2000;113:2331–2343. - PubMed
    1. Mishra L, Cai T, Yu P, Monga SP, Mishra B. Elf3 encodes a novel 200-kD beta-spectrin: role in liver development. Oncogene. 1999;18:353–364. - PubMed
    1. Tang Y, Katuri V, Iqbal S, Narayan T, Wang Z, Lu RS. et al. ELF a beta-spectrin is a neuronal precursor cell marker in developing mammalian brain; structure and organization of the elf/beta-G spectrin gene. Oncogene. 2002;21:5255–5267. - PubMed
    1. Tang Y, Katuri V, Dillner A, Mishra B, Deng CX, Mishra L. Disruption of transforming growth factor-beta signaling in ELF beta-spectrin-deficient mice. Science. 2003;299:574–577. - PubMed
    1. Katuri V, Tang Y, Marshall B, Rashid A, Jogunoori W, Volpe EA. et al. Inactivation of ELF/TGF-beta signaling in human gastrointestinal cancer. Oncogene. 2005;24:8012–8024. - PubMed

Publication types

MeSH terms