. 2021 Feb 25;11(9):4381-4402.
doi: 10.7150/thno.53652. eCollection 2021.

NAD+-boosting therapy alleviates nonalcoholic fatty liver disease via stimulating a novel exerkine Fndc5/irisin

Affiliations

NAD+-boosting therapy alleviates nonalcoholic fatty liver disease via stimulating a novel exerkine Fndc5/irisin

Dong-Jie Li et al. Theranostics. .

Abstract

Rationale: Nicotinamide adenine dinucleotide+ (NAD+)-boosting therapy has emerged as a promising strategy to treat various health disorders, while the underlying molecular mechanisms are not fully understood. Here, we investigated the involvement of fibronectin type III domain containing 5 (Fndc5) or irisin, which is a novel exercise-linked hormone, in the development and progression of nonalcoholic fatty liver disease (NAFLD). Methods: NAD+-boosting therapy was achieved by administrating of nicotinamide riboside (NR) in human and mice. The Fndc5/irisin levels in tissues and blood were measured in NR-treated mice or human volunteers. The therapeutic action of NR against NAFLD pathologies induced by high-fat diet (HFD) or methionine/choline-deficient diet (MCD) were compared between wild-type (WT) and Fndc5-/- mice. Recombinant Fndc5/irisin was infused to NALFD mice via osmotic minipump to test the therapeutic action of Fndc5/irisin. Various biomedical experiments were conducted in vivo and in vitro to know the molecular mechanisms underlying the stimulation of Fndc5/irisin by NR treatment. Results: NR treatment elevated plasma level of Fndc5/irisin in mice and human volunteers. NR treatment also increased Fndc5 expression in skeletal muscle, adipose and liver tissues in mice. In HFD-induced NAFLD mice model, NR displayed remarkable therapeutic effects on body weight gain, hepatic steatosis, steatohepatitis, insulin resistance, mitochondrial dysfunction, apoptosis and fibrosis; however, these actions of NR were compromised in Fndc5-/- mice. Chronic infusion of recombinant Fndc5/irisin alleviated the NAFLD pathological phenotypes in MCD-induced NAFLD mice model. Mechanistically, NR reduced the lipid stress-triggered ubiquitination of Fndc5, which increased Fndc5 protein stability and thus enhanced Fndc5 protein level. Using shRNA-mediated knockdown screening, we found that NAD+-dependent deacetylase SIRT2, rather than other sirtuins, interacts with Fndc5 to decrease Fndc5 acetylation, which reduces Fndc5 ubiquitination and stabilize it. Treatment of AGK2, a selective inhibitor of SIRT2, blocked the therapeutic action of NR against NAFLD pathologies and NR-induced Fndc5 deubiquitination/deacetylation. At last, we identified that the lysine sites K127/131 and K185/187/189 of Fndc5 may contribute to the SIRT2-dependent deacetylation and deubiquitination of Fndc5. Conclusions: The findings from this research for the first time demonstrate that NAD+-boosting therapy reverses NAFLD by regulating SIRT2-deppendent Fndc5 deacetylation and deubiquitination, which results in a stimulation of Fndc5/irisin, a novel exerkine. These results suggest that Fndc5/irisin may be a potential nexus between physical exercise and NAD+-boosting therapy in metabolic pathophysiology.

Keywords: Fndc5; NAD+; SIRT2; irisin; nonalcoholic fatty liver disease; physical exercise.


Conflict of interest statement

Competing Interests: The authors have declared that no competing interest exists.

Figures
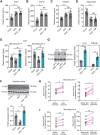
Figure 1
Figure 1
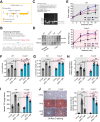
Nicotinamide riboside, a well-established NAD+-boosting molecule, stimulates Fndc5/irisin in murine and human. (A-F) The influence of NR treatment (400 mg/kg/d) on plasma concentrations of FGF1, FGF21, resistin, and adiponectin in HFD-induced NAFLD mouse model. FGF1, FGF21, resistin and adiponectin plasma concentrations were changed in NAFLD mice but not by NR. (E) Plasma irisin concentration was changed by NR treatment. **P<0.01 vs Chow, ##P<0.01 vs HFD, n = 8. NS, no significance. Two different commercial ELISA kits from Phoenix Pharmaceutical (Manufacturer P) and AdipoGen (Manufacturer A) were used. (F) The protein expression of Fndc5 in skeletal muscle of NAFLD mice with or without NR treatment. **P<0.01 vs Chow, ##P<0.01 vs HFD, n = 4. (G) The protein expression of Fndc5 in other tissues such as liver and adipose of NAFLD mice with or without NR treatment. **P<0.01 vs HFD by unpaired t-test, n = 4. (H-I) The influences of two-week NR supplement (500 mg, bid) or physical exercise on plasma irisin concentration in human volunteers detected by two different commercial ELISA kits from Phoenix Pharmaceutical (Manufacturer P, H) and AdipoGen (Manufacturer A, I). *P<0.05, **P<0.01 by paired t-test, n = 6.
Figure 2
Figure 2
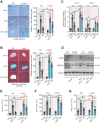
Loss of Fndc5 attenuates the protection of NR against HFD-induced obesity and hepatic steatosis. (A) Generation of global Fndc5 knockout mice by targeting exon 2 of Fndc5 using CRISPR/CAS9 technology-mediated deletion. (B) Deletion of Fndc5 exon 2 was confirmed using DNA sequencing. The sequencing results showed that 984 base pairs in the Fndc5 nucleotide sequence were deleted. (C) Genotyping and the used primers are showed. WT, wild-type; MT, mutant. (D) Deletion of FNDC5 protein in liver and skeletal muscle tissue. (E) The body curves of WT and Fndc5-/- mice fed with HFD and NR for 16 weeks. **P<0.01, *P<0.05 vs Chow, ##P<0.01, #P<0.05 vs HFD, n = 6. (F-G) The liver weight (F) and the liver/body weight ratio (G) of WT and Fndc5-/- mice fed with HFD and NR for 16 weeks. **P<0.01 vs Chow, ##P<0.01 vs HFD, &P<0.05 Fndc5-/- vs WT, n = 6. NS, no significance. (H-I) Hepatic cholesterol (H) and triglyceride (I) levels in liver of WT and Fndc5-/- mice. *P<0.05 vs chow, ##P<0.01, #P<0.05 vs HFD, &P<0.05 Fndc5-/- vs WT, n = 6-7. NS, no significance. (J) Oil Red O staining showing the lipid accumulation (red staining) in liver of mice. **P<0.01 vs chow, ##P<0.01, #P<0.05 vs HFD, &P<0.05 Fndc5-/- vs WT, n = 6. NS, no significance. n = 6-7.
Figure 3
Figure 3
Loss of Fndc5 diminishes the improvement of NR against HFD-induced insulin resistance. (A-B) The ITT assay curve (A) and calculation of area under curve (AUC, B) on WT and Fndc5-/- mice. (C-D) The GTT assay curve (C) and calculation of AUC (D) on WT and Fndc5-/- mice. (E-F) The phosphorylation of IRS-1 at tyrosine site 612 of IRS-1 (E) and serine sites at 307 and 636 sites of IRS-1 (F) in liver tissue of mice were detected by immunoblotting. (G) The phosphorylation of Akt at tyrosine site 308 in liver tissue of mice. **P<0.01 vs chow, ##P<0.01, #P<0.05 vs HFD, &P<0.05 Fndc5-/- vs WT, n = 6. NS, no significance.
Figure 4
Figure 4
Loss of Fndc5 counteracts the therapeutic efficacy of NR on HFD-induced hepatic inflammation and cell death. (A) F4/80 immunohistochemistry staining in liver tissue of WT and Fndc5-/- mice. (B) CD11b immunohistochemistry staining in liver tissue of WT and Fndc5-/- mice. (C) Tissue TNF-α, IL-6 and IL-1β protein levels in liver tissue of WT and Fndc5-/- mice fed with HFD and NR. (D) The precursor and cleaved caspase-8 in liver tissue of WT and Fndc5-/- mice. (E) TUNEL staining in liver tissue of WT and Fndc5-/- mice. **P<0.01 vs chow, #P<0.05, ##P<0.01 vs HFD, &P<0.05 Fndc5-/- vs WT, n = 6. NS, no significance.
Figure 5
Figure 5
Loss of Fndc5 counteracts the therapeutic efficacy of NR on HFD-induced liver fibrosis and injury. (A) α-SMA staining in liver tissue of WT and Fndc5-/- mice. (B) Masson's staining in liver tissue of WT and Fndc5-/- mice. (C) qPCR analysis showing the TGF-β and TIMP-1 mRNA in liver tissue of WT and Fndc5-/- mice. (D) Immunoblotting analysis showing the HMGB-1 protein expression in liver tissue of WT and Fndc5-/- mice. (E-G) Plasma activities of AST (E), ALT (F) and ALP (G) in WT and Fndc5-/- mice. **P<0.01 vs chow, #P<0.05, ##P<0.01 vs HFD, &P<0.05 Fndc5-/- vs WT, n = 6. NS, no significance.
Figure 6
Figure 6
Loss of Fndc5 revokes the beneficial effects of NR on genes involved in mitochondrial biogenesis and mitophagy in NAFLD mice. (A-G) The mRNA expression of TFMA (A), NRF-1 (B), PGC-1α (C), Mfn2 (D), Mst1 (E), NR4A1 (F) and Bnip4 (G) in liver tissue of WT and FNDC5-/- mice was determined using quantitative PCR analysis. (H-J) Mitochondria were isolated and the activities of Complex I, II and IV in mitochondrial extracts were determined. (K) The acetylation of PGC-1α in liver tissue of WT and FNDC5-/- mice was measured. The liver samples were immunoprecipitated with a monoclonal against PGC-1α and then probed by an antibody against acetylated-lysine with immunoblotting. (L) The NAD+ levels in liver tissue of WT and FNDC5-/- mice. *P<0.05 vs chow; #P<0.05, ##P<0.01 vs HFD; &P<0.01 Fndc-/- vs WT, n = 6. NS, no significance.
Figure 7
Figure 7
Chronic infusion of recombinant irisin alleviates NAFLD in mice. (A-B) Serum activities of ALT (A) and AST (B) in mice infused with recombinant irisin or saline water (vehicle) via Alzet osmotic minipump (5 nmol/kg body weight per day). (C-D) Liver tissue activities of ALT (C) and AST (D) in mice infused with recombinant irisin or saline water (vehicle) via Alzet osmotic minipump. (E) Representative images and quantitative analysis of lipid accumulation in liver tissue by Oil Red O staining. (F) Representative images and quantitative analysis of NAFLD severity in liver tissue by H & E staining. (G) Representative images and quantitative analysis of macrophage infiltration in liver tissue by F4/80 immunohistochemistry staining. (H) Representative images and quantitative analysis of fibrosis in liver tissue by Masson's trichrome staining. **P<0.01 vs NAFLD + Saline, n = 6-8 per group.
Figure 8
Figure 8
NR inhibits ubiquitination of Fndc5 to stabilize Fndc5. (A-B) Fndc5 mRNA expression in mouse liver tissue (A) and AML12 hepatocytes (B) upon NR administration. n = 5-7. NS, no significance. (C) Evaluation of Fndc5 protein degradation and stability under vehicle control (saline) or NR treatment (300 µM) using cycloheximide (Chx, 3 µM) incubation in AML12 hepatocytes. *P<0.05, **P<0.01 vs control AML12 cells. n = 4. (D) Influence of lactacystin, MG132, bafilomycin A1 (Baf A1) and chloroquine (CQ) on Fndc5 protein expression. Tubulin was used as a loading control. (E) Effects of proteasome inhibitors (bortezomib and MG132) and autophagy inhibitor Baf-A1 on Fndc5 ubiquitination in cultured AML12 hepatocytes. The cell extracts were immunoprecipitated with anti-flag antibody and then probed by anti-ubiquitin and anti-Fndc5 antibodies. (F) Ubiquitination of Fndc5 under palmitic acid (PA) or NR. MG132 was added to block ubiquitin-proteasome degradation system. The cell extracts were immunoprecipitated with an anti-flag antibody and then probed by anti-ubiquitin and anti-Fndc5 antibodies. **P<0.01 vs without PA. ##P<0.01 vs PA. n = 4. IP, immunoprecipitation. WB, western blotting.
Figure 9
Figure 9
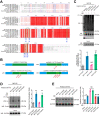
SIRT2 interacts with Fndc5 to promote its deacetylation and deubiquitination. (A) Inhibition of deacetylases by DIC abolishes the action of NR on Fndc5 deubiquitination in HepG2 cells. DIC, deacetylation inhibition cocktail (100×). The extracts of cells treated as indicated were immunoprecipitated with anti-flag antibody and then probed by anti-ubiquitin and anti-Fndc5 antibodies. **P<0.01 PA vs veh, #P<0.05 NR vs PA; n = 3. NS, no significance. (B) Effects of siRNA-mediated SIRT1-7 knockdown on Fndc5 protein expression in HepG2 cells under PA and NR treatment. **P<0.01 NR vs PA; #P<0.05, ##P<0.01 vs PA + NR; n = 3. NS, no significance. (C) Flag-Fndc5 and myc-SIRT2 were co-transfected into HepG2 cells to detect the interaction between them using co-immunoprecipitation assay. (D) The interaction between endogenous Fndc5 and SIRT2 was detected using immunoprecipitation and Western blotting assay. Normal IgG was used as a normal control. (E) The influences of NR treatment or SIRT2 overexpression on Fndc5 acetylation were detected. The Flag-Fndc5-transfected cells treated as indicated were lysed and immunoprecipitated with an anti-flag antibody, and then probed by an anti-Ac-lys antibody. (F) The ubiquitination of Fndc5 in control and SIRT2-knockdown cells.
Figure 10
Figure 10
Identification of key lysine sites for SIRT2-mediated Fndc5 deubiquitination and deacetylation. (A) Comparison of Fndc5 protein sequences among mouse, rat, cattle, dog, cat, oreochromis niloticus, zebrafish and human species. The identical sites were highlighted by red and the conservative lysine sites were indicated by asterisks. (B) Plasmids carrying wild-type (WT) and mutant Fndc5 (MT) were generated. The K127 and K131 sites in MT1-Fndc5, K177 site in MT2-Fndc5 and K185, K187 and K189 sites in MT3-Fndc5 were mutated into arginine (R). (C) WT, MT1-Fndc5, MT2-Fndc5 and MT3-Fndc5 were transfected into HepG2 cell line respectively and then treated with PA and NR. To monitor the ubiquitination of these Fndc5 proteins, the cells were lysed and the extracts were immunoprecipitated by anti-Flag antibody followed by immunoblotting with anti-Ubiquitin. **P<0.01 vs WT-Fndc5. N = 3. (D) Cells were transfected and treated as in (C) and the cell extracts were immunoprecipitated by anti-Flag antibody followed by immunoblotting with anti-Acetylated-lysine (anti-Ac) to monitor the acetylation of Fndc5 proteins. **P<0.01 vs WT Fndc5. N = 3. (E) The Fndc5 protein expression in HepG2 cells transfected with plasmids carrying WT and mutant Fndc5 was determined. **P<0.01 vs Mock. ##P<0.01 vs WT-Fndc5. N = 3.
Figure 11
Figure 11
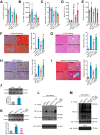
Blockade of SIRT2 by AGK2 compromises the therapeutic action of NR against NAFLD. (A-E) Liver SIRT2 activity (A), liver NAD+ level (B), plasma NAD+ level (C), Serum ALT activity (D) and serum irisin level were determined in five groups of mice. NAFLD model was induced by MCD diet for 4 weeks. NR (400 mg/kg/day) and AGK2 (1 mg/kg/day) were injected intraperitoneally. *P < 0.05, **P < 0.01 vs Chow. #P < 0.05, ##P < 0.01 vs NAFLD. &P < 0.05, &&P < 0.01 vs NAFLD + NR. N = 6 per group. (F-I) Representative images and quantitative analysis of lipid accumulation, NAFLD activity score, macrophage infiltration and liver fibrosis according to Oil Red O staining, H & E staining, F4/80 immunohistochemistry staining and Masson trichrome staining respectively. *P < 0.05, **P < 0.01 vs NAFLD. #P < 0.05, ##P < 0.01 vs NAFLD + NR. N = 6 per group. (J-K) Fndc5 protein expression in mice under normal (J) or NAFLD (K) status. (L-M) The liver tissues were lysed and then immunoprecipitated by anti-Fndc5 antibody followed by immunoblotting with anti-Acetylated-lysine (anti-Ac, L) or anti-Ubiquitin (M) to monitor the acetylation or ubiquitination of endogenous Fndc5 in mice treated with NR or NR plus AGK2. AGK2 treatment significantly abolished the decreased acetylation and ubiquitination of Fndc5 by NR.
Figure 12
Figure 12
A proposed framework for the involvement of Fndc5/irisin in the protection of NR against NAFLD.

Similar articles

Cited by

References

    1. Cohen JC, Horton JD, Hobbs HH. Human fatty liver disease: old questions and new insights. Science. 2011;332:1519–23. - PMC - PubMed
    1. Anstee QM, Targher G, Day CP. Progression of NAFLD to diabetes mellitus, cardiovascular disease or cirrhosis. Nat Rev Gastroenterol Hepatol. 2013;10:330–44. - PubMed
    1. Gaggini M, Morelli M, Buzzigoli E, DeFronzo RA, Bugianesi E, Gastaldelli A. Non-alcoholic fatty liver disease (NAFLD) and its connection with insulin resistance, dyslipidemia, atherosclerosis and coronary heart disease. Nutrients. 2013;5:1544–60. - PMC - PubMed
    1. Yang Y, Sauve AA. NAD(+) metabolism: Bioenergetics, signaling and manipulation for therapy. Biochim Biophys Acta. 2016;1864:1787–800. - PMC - PubMed
    1. Revollo JR, Korner A, Mills KF, Satoh A, Wang T, Garten A. et al. Nampt/PBEF/Visfatin regulates insulin secretion in beta cells as a systemic NAD biosynthetic enzyme. Cell Metab. 2007;6:363–75. - PMC - PubMed

Publication types