. 2021 Mar 4;11(9):4531-4548.
doi: 10.7150/thno.54803. eCollection 2021.

The role of GLS1-mediated glutaminolysis/2-HG/H3K4me3 and GSH/ROS signals in Th17 responses counteracted by PPARγ agonists

Affiliations

The role of GLS1-mediated glutaminolysis/2-HG/H3K4me3 and GSH/ROS signals in Th17 responses counteracted by PPARγ agonists

Yumeng Miao et al. Theranostics. .

Abstract

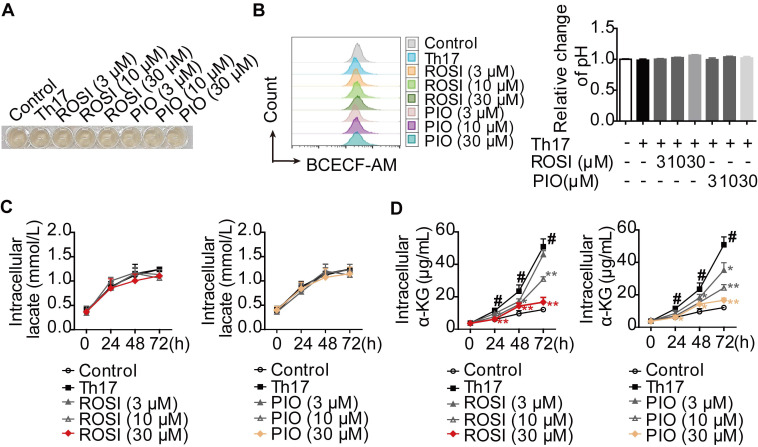
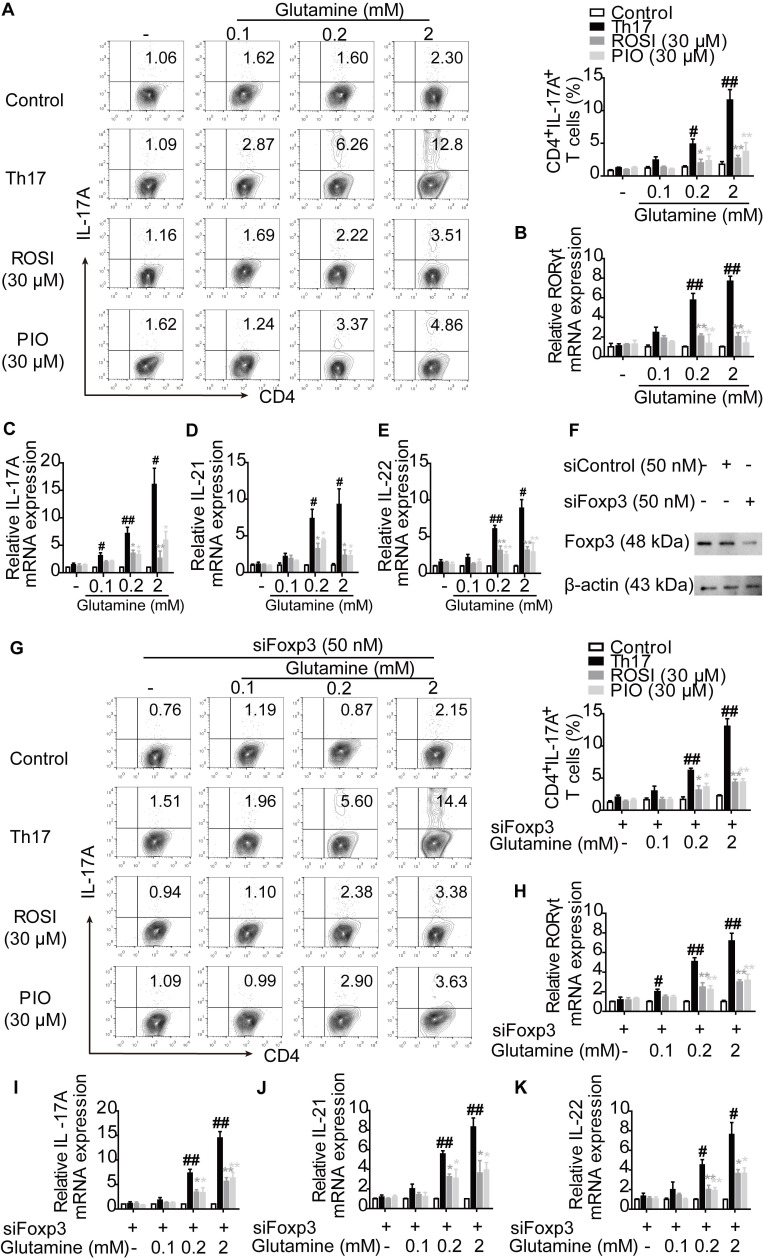
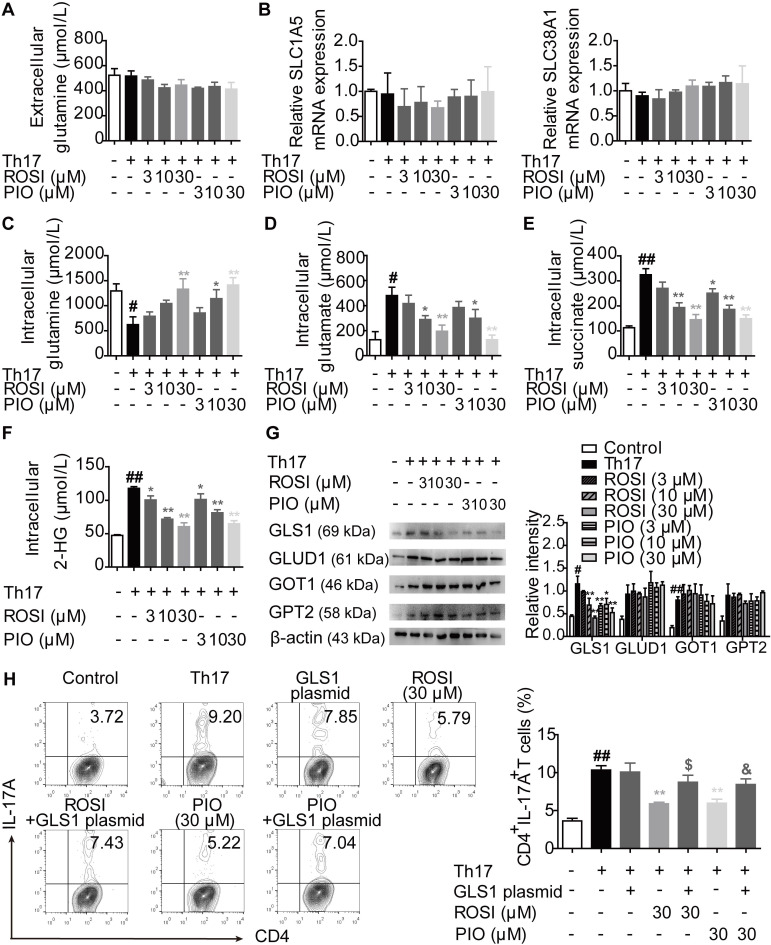
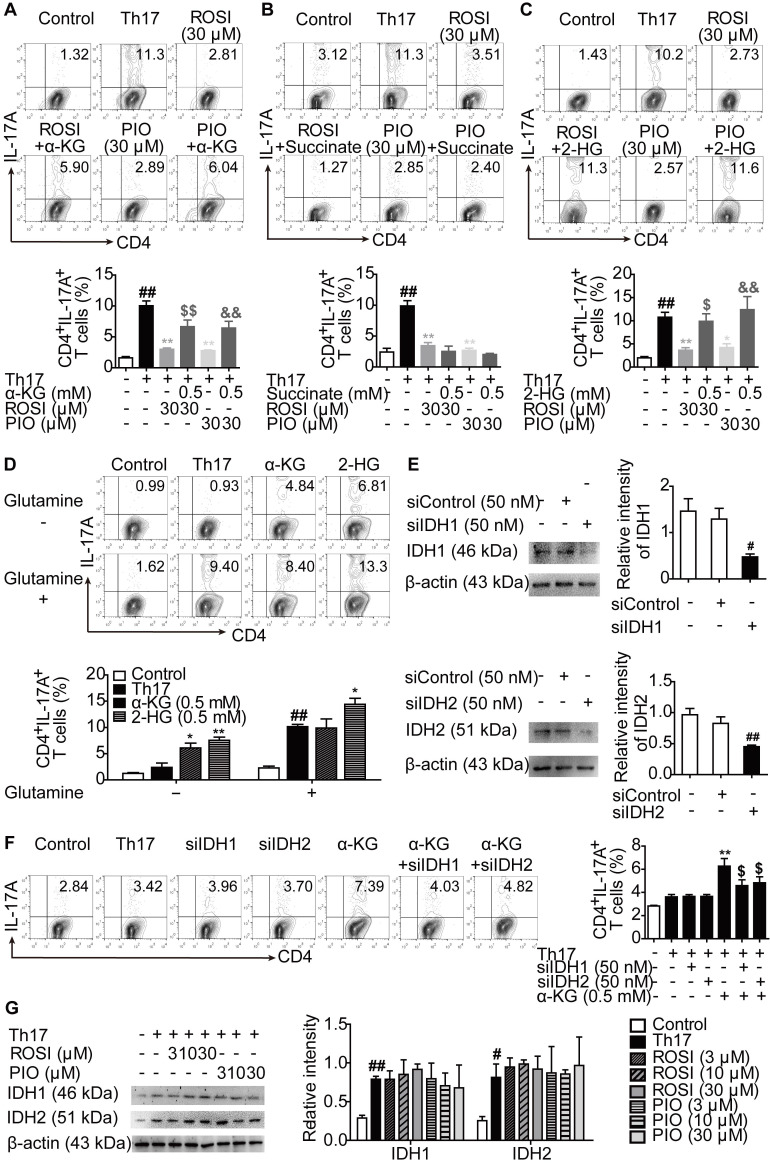
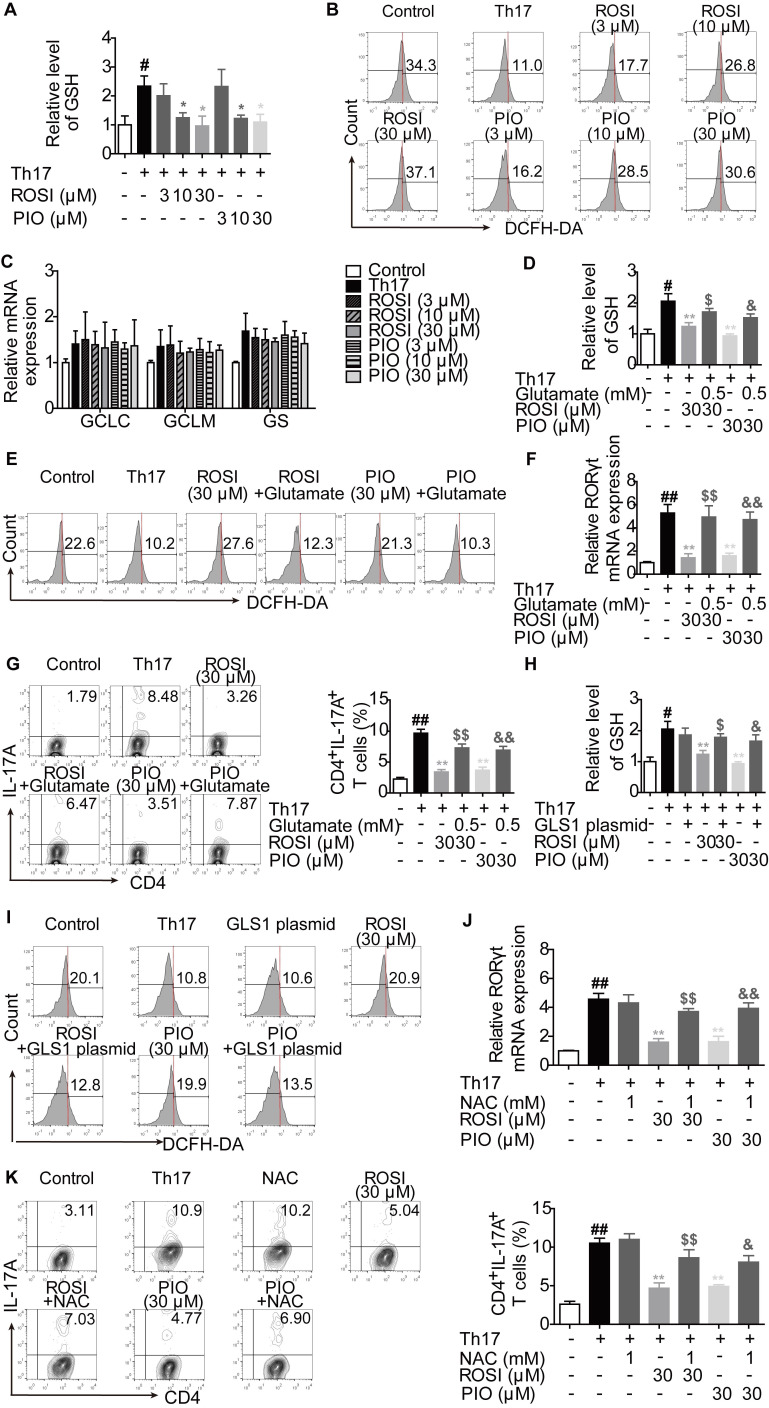
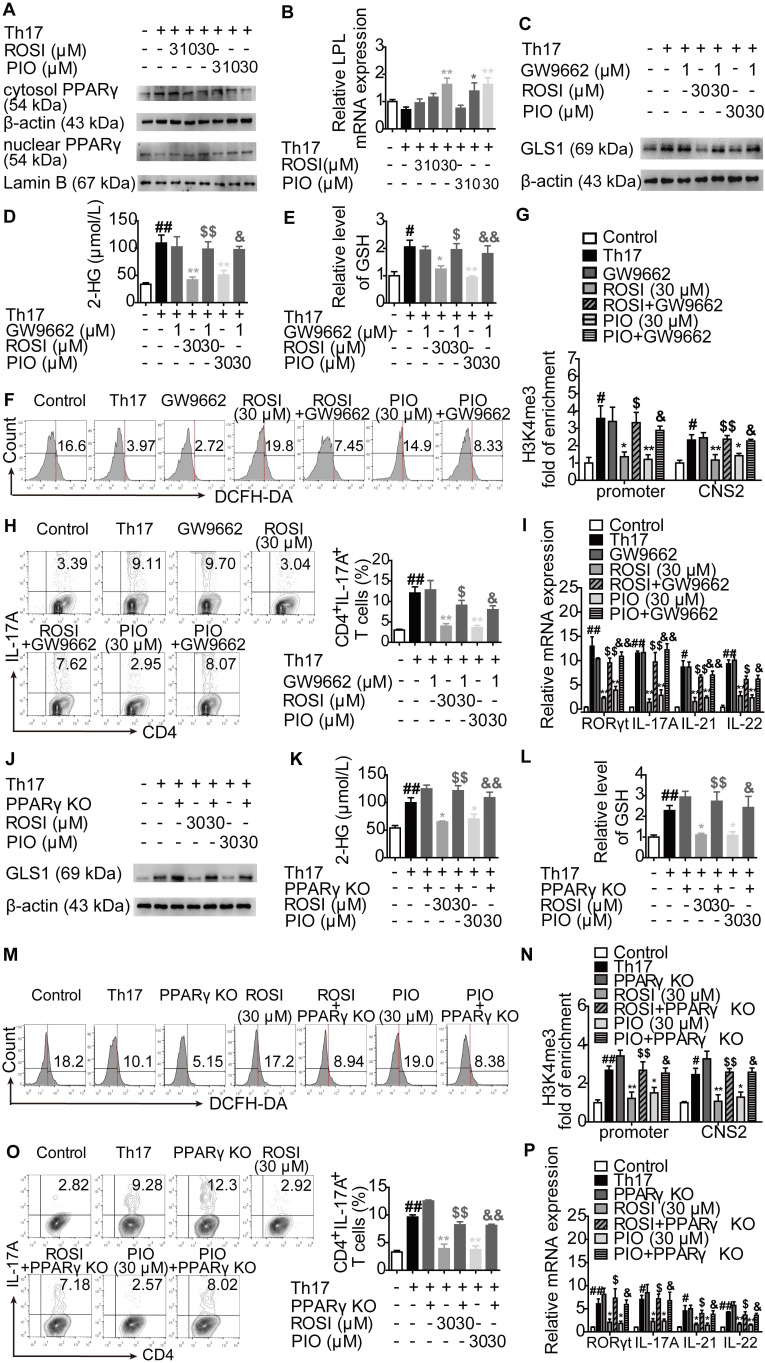
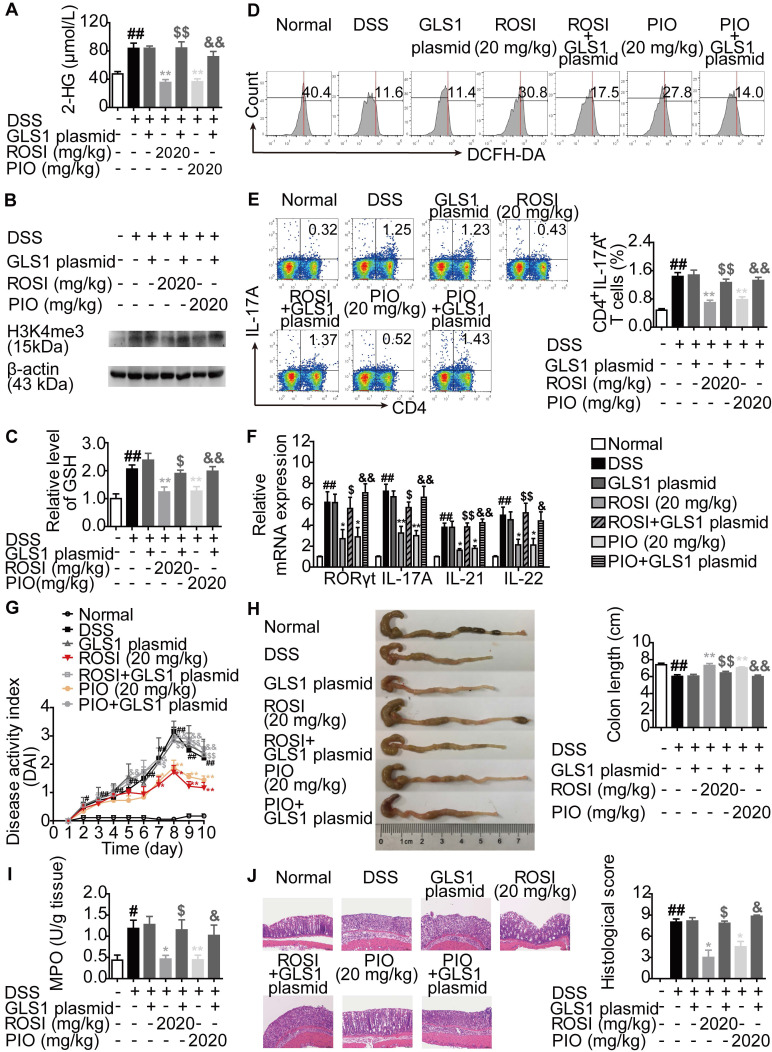
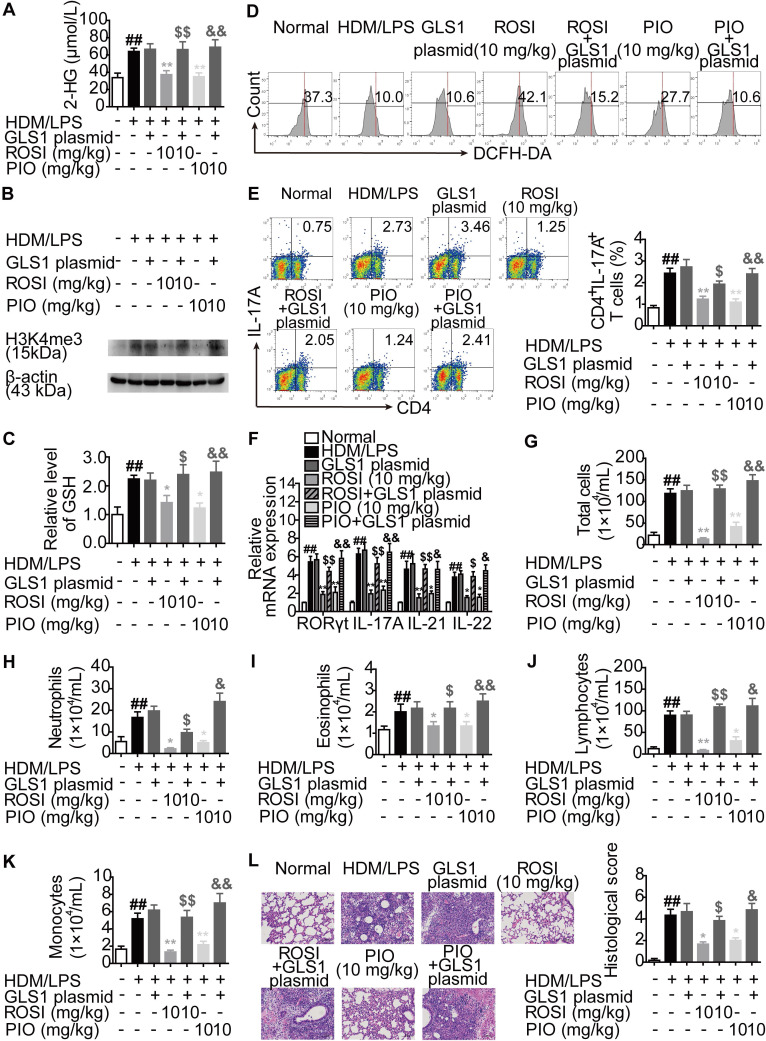
Background: Peroxisome proliferator-activated receptor gamma (PPARγ) has the ability to counter Th17 responses, but the full mechanisms remain elusive. Herein, we aimed to elucidate this process in view of cellular metabolism, especially glutaminolysis. Methods: MTT, CCK-8, Annexin V-FITC/PI staining or trypan blue exclusion assays were used to analyze cytotoxicity. Flow cytometry and Q-PCR assays were applied to determine Th17 responses. The detection of metabolite levels using commercial kits and rate-limiting enzyme expression using western blotting assays was performed to illustrate the metabolic activity. ChIP assays were used to examine H3K4me3 modifications. Mouse models of dextran sulfate sodium (DSS)-induced colitis and house dust mite (HDM)/lipopolysaccharide (LPS)-induced asthma were established to confirm the mechanisms studied in vitro. Results: The PPARγ agonists rosiglitazone and pioglitazone blocked glutaminolysis but not glycolysis under Th17-skewing conditions, as indicated by the detection of intracellular lactate and α-KG and the fluorescence ratios of BCECF-AM. The PPARγ agonists prevented the utilization of glutamine and thus directly limited Th17 responses even when Foxp3 was deficient. The mechanisms were ascribed to restricted conversion of glutamine to glutamate by reducing the expression of the rate-limiting enzyme GLS1, which was confirmed by GLS1 overexpression. Replenishment of α-KG and 2-HG but not succinate weakened the effects of PPARγ agonists, and α-KG-promoted Th17 responses were dampened by siIDH1/2. Inhibition of KDM5 but not KDM4/6 restrained the inhibitory effect of PPARγ agonists on IL-17A expression, and the H3K4me3 level in the promoter and CNS2 region of the il-17 gene locus down-regulated by PPARγ agonists was rescued by 2-HG and GLS1 overexpression. However, the limitation of PPARγ agonists on the mRNA expression of RORγt was unable to be stopped by 2-HG but was attributed to GSH/ROS signals subsequent to GLS1. The exact role of PPARγ was proved by GW9662 or PPARγ knockout, and the mechanisms for PPARγ-inhibited Th17 responses were further confirmed by GLS1 overexpression in vivo. Conclusion: PPARγ agonists repressed Th17 responses by counteracting GLS1-mediated glutaminolysis/2-HG/H3K4me3 and GSH/ROS signals, which is beneficial for Th17 cell-related immune dysregulation.

Keywords: PPARγ; Th17 responses; glutaminase 1; glutaminolysis.


Conflict of interest statement

Competing Interests: The authors have declared that no competing interest exists.

Figures

Figure 1
Figure 1
PPARγ agonists inhibit glutaminolysis rather than glycolysis under Th17-skewing conditions. (A-D) The naïve CD4+ T cells were prepared, and treated with anti-CD3/CD28 in the presence or absence of Th17-skewing cytokines, rosiglitazone (ROSI; 3, 10, 30 µM) as well as pioglitazone (PIO; 3, 10, 30 µM). After 72 h, the visible changes of pH were showed by the color of cell culture media (A), and the relative intracellular pH values were determined by flow cytometry using fluorescence ratios of BCECF-AM between the green and orange channels (FL1/FL3) (B). At 0, 24, 48 and 72 h, the concentrations of intracellular lactate (C) and α-KG (D) were determined by using commercial kits. Data were presented as the means ± S.E.M. of three independent experiments. #P < 0.05 vs. Control group or the group without any treatment; *P < 0.05, **P < 0.01 vs. Th17 group (Model group).
Figure 2
Figure 2
PPARγ agonists prevent the utilization of glutamine and result in the limitation of Th17 differentiation directly. (A-E) The naïve CD4+ T cells were prepared, and treated with anti-CD3/CD28 in the presence or absence of Th17-skewing cytokines, glutamine (0.1, 0.2, 2 mM), rosiglitazone (ROSI; 30 µM) as well as pioglitazone (PIO; 30 µM) for 72 h. Then, the frequency of CD4+IL-17A+ T cells was detected by flow cytometry (A), and the relative mRNA expression levels of RORγt, IL-17A, IL-21 as well as IL-22 were determined by Q-PCR assay (B-E). (F) The naïve CD4+ T cells were transfected with siFoxp3, and the protein expressions of Foxp3 was analyzed by western blotting assay. (G-K) The naïve CD4+ T cells were transfected with siFoxp3, and then treated with anti-CD3/CD28 in the presence or absence of Th17-skewing cytokines, glutamine (0.1, 0.2, 2 mM), ROSI (30 µM) as well as PIO (30 µM) for 72 h. The frequency of CD4+IL-17A+ T cells was detected by flow cytometry (G), and the relative mRNA expression levels of RORγt, IL-17A, IL-21 as well as IL-22 were determined by Q-PCR assay (H-K). Data were presented as the means ± S.E.M. of three independent experiments. #P < 0.05, ##P < 0.01 vs. Control group; *P < 0.05, **P < 0.01 vs. Th17 group (Model group).
Figure 3
Figure 3
PPARγ agonists block glutaminolysis via a restricted expression of GLS1. The naïve CD4+ T cells were prepared, and treated with anti-CD3/CD28 in the presence or absence of Th17-skewing cytokines, rosiglitazone (ROSI; 3, 10, 30 µM) as well as pioglitazone (PIO; 3, 10, 30 µM) for 48 h. (A) The concentration of extracellular glutamine was detected by using a commercial kit. (B) The relative mRNA expression levels of SLC1A5 and SLC38A1 were examined by Q-PCR assay. (C-F) The concentrations of intracellular glutamine (C), glutamate (D), succinate (E) and 2-HG (F) were determined by using commercial kits. (G) The protein levels of GLS1, GLUD1, GOT1 and GPT2 were analyzed by western blotting assay. (H) The naïve CD4+ T cells were transfected with GLS1 plasmid, and then treated with anti-CD3/CD28, Th17-skewing cytokines, ROSI (30 µM) or PIO (30 µM) for 72 h. The frequency of CD4+IL-17A+ T cells was detected by flow cytometry. Data were presented as the means ± S.E.M. of three independent experiments. #P < 0.05, ##P < 0.01 vs. Control group; *P < 0.05, **P < 0.01 vs. Th17 group (Model group); $P < 0.05 vs. ROSI group; &P < 0.05 vs. PIO group.
Figure 4
Figure 4
2-HG is involved in the inhibition of PPARγ agonists on Th17 differentiation. (A-C) The naïve CD4+ T cells were prepared and treated with anti-CD3/CD28 in the presence or absence of Th17-skewing cytokines, α-KG (0.5 mM), succinate (0.5 mM), 2-HG (0.5 mM), rosiglitazone (ROSI; 30 µM) as well as pioglitazone (PIO; 30 µM) for 72 h, and the frequency of CD4+IL-17A+ T cells was detected by flow cytometry. (D) The naïve CD4+ T cells were treated with anti-CD3/CD28 in the presence or absence of Th17-skewing cytokines, glutamine (2 mM), α-KG (0.5 mM) as well as 2-HG (0.5 mM) for 72 h, and the frequency of CD4+IL-17A+ T cells was detected by flow cytometry. (E) The naïve CD4+ T cells were transfected with siIDH1 or siIDH2, and the protein levels of IDH1 and IDH2 were analyzed by western blotting assay. (F) The naïve CD4+ T cells were transfected with siIDH1 or siIDH2, and then treated with anti-CD3/CD28, Th17-skewing cytokines, α-KG (0.5 mM) in the cell culture without glutamine for 72 h. The frequency of CD4+IL-17A+ T cells was detected by flow cytometry. (G) The naïve CD4+ T cells were treated with anti-CD3/CD28 in the presence or absence of Th17-skewing cytokines, ROSI (3, 10, 30 µM) as well as PIO (3, 10, 30 µM) for 48 h. The protein levels of IDH1 and IDH2 were analyzed by western blotting assay. Data were presented as the means ± S.E.M. of three independent experiments. #P < 0.05, ##P < 0.01 vs. Control group or the group without any treatment; *P < 0.05, **P < 0.01 vs. Th17 group (Model group); $P < 0.05, $$P < 0.01 vs. ROSI group or α-KG group; &P < 0.05, &&P < 0.01 vs. PIO group.
Figure 5
Figure 5
PPARγ agonists limit the KDM5-specific H3K4me3 modifications in il-17 gene locus through regulating the GLS1/2-HG axis. (A-B) The naïve CD4+ T cells were prepared and treated with anti-CD3/CD28 in the presence or absence of Th17-skewing cytokines, 2-HG (0.5 mM), rosiglitazone (ROSI; 30 µM) as well as pioglitazone (PIO; 30 µM) for 72 h. The relative mRNA expression levels of RORγt (A) and IL-17A (B) were determined by Q-PCR assay. (C-D) The naïve CD4+ T cells were transfected with GLS1 plasmid, and then treated with anti-CD3/CD28, Th17-skewing cytokines, ROSI (30 µM) or PIO (30 µM) for 72 h. The relative mRNA expression levels of RORγt (C) and IL-17A (D) were determined by Q-PCR assay. (E-F) The naïve CD4+ T cells were treated with anti-CD3/CD28 in the presence or absence of Th17-skewing cytokines, ML324 (0.2 µM), CPI-455 (10 µM), GSK-J4 (20 nM), ROSI (30 µM) as well as PIO (30 µM) for 72 h. The relative mRNA expression of IL-17A was detected by Q-PCR. (G-I) The naïve CD4+ T cells were prepared, and treated with anti-CD3/CD28 in the presence or absence of Th17-skewing cytokines, ROSI (3, 10, 30 µM) as well as PIO (3, 10, 30 µM) for 72 h. The protein level of H3K4me3 was analyzed by western blotting assay (G), and the enrichment of H3K4me3 in promoter (H) and CNS1, 2, 3, 4 (I) region of il-17 gene was analyzed by ChIP. (J-K) The naïve CD4+ T cells were treated with anti-CD3/CD28 in the presence or absence of Th17-skewing cytokines, 2-HG (0.5 mM), ROSI (30 µM) as well as PIO (30 µM) for 72 h. The enrichment of H3K4me3 in promoter (J) and CNS2 (K) region of il-17 gene was analyzed by ChIP. (L-M) The naïve CD4+ T cells were transfected with GLS1 plasmid, and then treated with anti-CD3/CD28, Th17-skewing cytokines, ROSI (30 µM) or PIO (30 µM) for 72 h. The enrichment of H3K4me3 in promoter (L) and CNS2 (M) region of il-17 gene was analyzed by ChIP. (N) The naïve CD4+ T cells were treated with anti-CD3/CD28 in the presence or absence of Th17-skewing cytokines, CPI-455 (10 µM), ROSI (30 µM) as well as PIO (30 µM) for 72 h. The frequency of CD4+IL-17A+ T cells was determined by flow cytometry. Data were presented as the means ± S.E.M. of three independent experiments. #P < 0.05, ##P < 0.01 vs. Control group; *P < 0.05, **P < 0.01 vs. Th17 group (Model group); $P < 0.05, $$P < 0.01 vs. ROSI group; &P < 0.05, &&P < 0.01 vs. PIO group.
Figure 6
Figure 6
PPARγ agonists inhibit RORγt expression via regulating GLS1/GSH/ROS signals. (A-C) The naïve CD4+ T cells were prepared, and treated with anti-CD3/CD28 in the presence or absence of Th17-skewing cytokines, rosiglitazone (ROSI; 3, 10, 30 µM) as well as pioglitazone (PIO; 3, 10, 30 µM) for 48 h. The concentration of intracellular GSH was detected by using a commercial kit (A), the level of ROS was determined by flow cytometry (B), and the mRNA expression levels of GCLC, GCLM and GS were analyzed by Q-PCR (C). (D-G) The naïve CD4+ T cells were treated with anti-CD3/CD28 in the presence or absence of Th17-skewing cytokines, glutamate (0.5 mM), ROSI (30 µM) as well as PIO (30 µM). After 48 h, the concentration of intracellular GSH was detected by using a commercial kit (D), and the level of ROS was determined by flow cytometry (E). After 72 h, the mRNA expression of RORγt was detected by Q-PCR (F), and the frequency of CD4+IL-17A+ T cells was determined by flow cytometry (G). (H-I) The naïve CD4+ T cells were transfected with GLS1 plasmid, and then treated with anti-CD3/CD28, Th17-skewing cytokines, ROSI (30 µM) or PIO (30 µM) for 48 h. The concentration of intracellular GSH was detected by using a commercial kit (H), and the level of ROS was determined by flow cytometry (I). (J-K) The naïve CD4+ T cells were treated with anti-CD3/CD28 in the presence or absence of Th17-skewing cytokines, NAC (1 mM), ROSI (30 µM) as well as PIO (30 µM) for 72 h. The mRNA expression of RORγt was detected by Q-PCR (J), and the frequency of CD4+IL-17A+ T cells was determined by flow cytometry (K). Data were presented as the means ± S.E.M. of three independent experiments. #P < 0.05, ##P < 0.01 vs. Control group; *P < 0.05, **P < 0.01 vs. Th17 group (Model group); $P < 0.05, $$P < 0.01 vs. ROSI group; &P < 0.05, &&P < 0.01 vs. PIO group.
Figure 7
Figure 7
The regulation of PPARγ agonists on GLS1-mediated glutaminolysis, subsequent signals and Th17 responses exerts a PPARγ-dependent feature. (A-B) The naïve CD4+ T cells were treated with anti-CD3/CD28 in the presence or absence of Th17-skewing cytokines, rosiglitazone (ROSI; 3, 10, 30 µM) and pioglitazone (PIO; 3, 10, 30 µM) for 48 h. The protein level of PPARγ in cytosol or nuclear was analyzed by western blotting assay (A), and the mRNA expression of LPL was examined by Q-PCR (B). (C-I) The naïve CD4+ T cells were treated with anti-CD3/CD28 in the presence or absence of Th17-skewing cytokines, GW9662 (1 µM), ROSI (30 µM) as well as PIO (30 µM). After 48 h, the protein expression of GLS1 was analyzed by western blotting assay (C), the concentrations of intracellular 2-HG (D) and GSH (E) were detected by using commercial kits, and the level of ROS was determined by flow cytometry (F). After 72 h, the enrichment of H3K4me3 in promoter and CNS2 region of il-17 gene was analyzed by ChIP (G), the frequency of CD4+IL-17A+ T cells was determined by flow cytometry (H), and the mRNA expression levels of RORγt, IL-17A, IL-21 as well as IL-22 were examined by Q-PCR (I). (J-P) The naïve CD4+ T cells were transfected with PPARγ CRISPR/Cas9 KO plasmid, followed by treatment of anti-CD3/CD28, Th17-skewing cytokines, ROSI (30 µM) or PIO (30 µM). After 48 h, the protein expression of GLS1 was analyzed by western blotting assay (J), the concentrations of intracellular 2-HG (K) and GSH (L) were detected by using commercial kits, and the level of ROS was determined by flow cytometry (M). After 72 h, the enrichment of H3K4me3 in promoter and CNS2 region of il-17 gene was analyzed by ChIP (N), the frequency of CD4+IL-17A+ T cells was determined by flow cytometry (O), and the mRNA expression levels of RORγt, IL-17A, IL-21 as well as IL-22 were examined by Q-PCR (P). Data were presented as the means ± S.E.M. of three independent experiments. #P < 0.05, ##P < 0.01 vs. Control group or the group without any treatment; *P < 0.05, **P < 0.01 vs. Th17 group (Model group); $P < 0.05, $$P < 0.01 vs. ROSI group; &P < 0.05, &&P < 0.01 vs. PIO group.
Figure 8
Figure 8
PPARγ agonists restrict colitis in mice via down-regulating GLS1-mediated glutaminolysis. The colitis model in mice was induced by dextran sulfate sodium (DSS). GLS1 plasmid (10 µg/mouse; p.r.), rosiglitazone (ROSI; 20 mg/kg; i.g.) and pioglitazone (PIO; 20 mg/kg; i.g.) were administered. (A) The level of 2-HG in colons was determined by using a commercial kit. (B) The level of H3K4me3 in colons was analyzed by western blotting assay. (C) The level of GSH in lymphocytes of colonic lamina proprias was detected by using a commercial kit. (D) The level of ROS in lymphocytes of colonic lamina proprias was analyzed by flow cytometry. (E) The frequency of CD4+IL-17A+ T cells in mesenteric lymph nodes was determined by flow cytometry. (F) The relative mRNA expression levels of RORγt, IL-17A, IL-21 and IL-22 in colons were examined by Q-PCR. (G) The DAI score was calculated. (H) The colon length was analyzed. (I) The MPO activity was determined by using a commercial kit. (J) The histological changes in colons were analyzed by H&E staining (×200). Data were presented as the means ± S.E.M. (n = 6 in each group). #P < 0.05, ##P < 0.01 vs. Normal group; *P < 0.05, **P < 0.01 vs. DSS group (Model group); $P < 0.05, $$P < 0.01 vs. ROSI group; &P < 0.05, &&P < 0.01 vs. PIO group.
Figure 9
Figure 9
PPARγ agonists inhibit asthma in mice via down-regulating GLS1-mediated glutaminolysis. The neutrophilic asthma model in mice was induced by house dust mite (HDM)/lipopolysaccharide (LPS). GLS1 plasmid (10 µg/mouse; i.n.), rosiglitazone (ROSI; 10 mg/kg; i.g.) and pioglitazone (PIO; 10 mg/kg; i.g.) were administered. (A) The level of 2-HG in lungs was determined by using a commercial kit. (B) The level of H3K4me3 in lungs was analyzed by western blotting assay. (C) The level of GSH in lymphocytes of lungs was detected by using a commercial kit. (D) The level of ROS in lymphocytes of lungs was analyzed by flow cytometry. (E) The frequency of CD4+IL-17A+ T cells in hilar lymph nodes was determined by flow cytometry. (F) The relative mRNA expression levels of RORγt, IL-17A, IL-21 and IL-22 in lungs were examined by Q-PCR. (G-L) The numbers of total cells (G), neutrophils (H), eosinophils (I), lymphocytes (J) and monocytes (K) in bronchoalveolar lavage fluids (BALFs) were analyzed. (L) The histological changes in lungs were analyzed by H&E staining (×200). Data were presented as the means ± S.E.M. (n = 6 in each group). ##P < 0.01 vs. Normal group; *P < 0.05, **P < 0.01 vs. HDM/LPS group (Model group); $P < 0.05, $$P < 0.01 vs. ROSI group; &P < 0.05, &&P < 0.01 vs. PIO group.

Similar articles

Cited by

References

    1. Jiang Y, Wang X, Dong C. Molecular mechanisms of T helper 17 cell differentiation: Emerging roles for transcription cofactors. Adv Immunol. 2019;144:121–153. - PubMed
    1. de Oliveira Boldrini V, Dos Santos Farias A, Degasperi GR. Deciphering targets of Th17 cells fate: From metabolism to nuclear receptors. Scand J Immunol. 2019;90:e12793. - PubMed
    1. Leppkes M, Becker C, Ivanov II, Hirth S, Wirtz S, Neufert C. et al. RORgamma-expressing Th17 cells induce murine chronic intestinal inflammation via redundant effects of IL-17A and IL-17F. Gastroenterology. 2009;136:257–267. - PubMed
    1. Chenuet P, Fauconnier L, Madouri F, Marchiol T, Rouxel N, Ledru A. et al. Neutralization of either IL-17A or IL-17F is sufficient to inhibit house dust mite induced allergic asthma in mice. Clin Sci (Lond) 2017;131:2533–2548. - PubMed
    1. Hou G, Bishu S. Th17 cells in inflammatory bowel disease: An update for the clinician. Inflamm Bowel Dis. 2020;26:653–661. - PMC - PubMed

Publication types

MeSH terms