. 2021 Aug;239(2):498-516.
doi: 10.1111/joa.13433. Epub 2021 Mar 23.

Morphology and morphometry of the human early foetal brain: A three-dimensional analysis

Affiliations

Morphology and morphometry of the human early foetal brain: A three-dimensional analysis

Tetsuya Takakuwa et al. J Anat. 2021 Aug.

Abstract

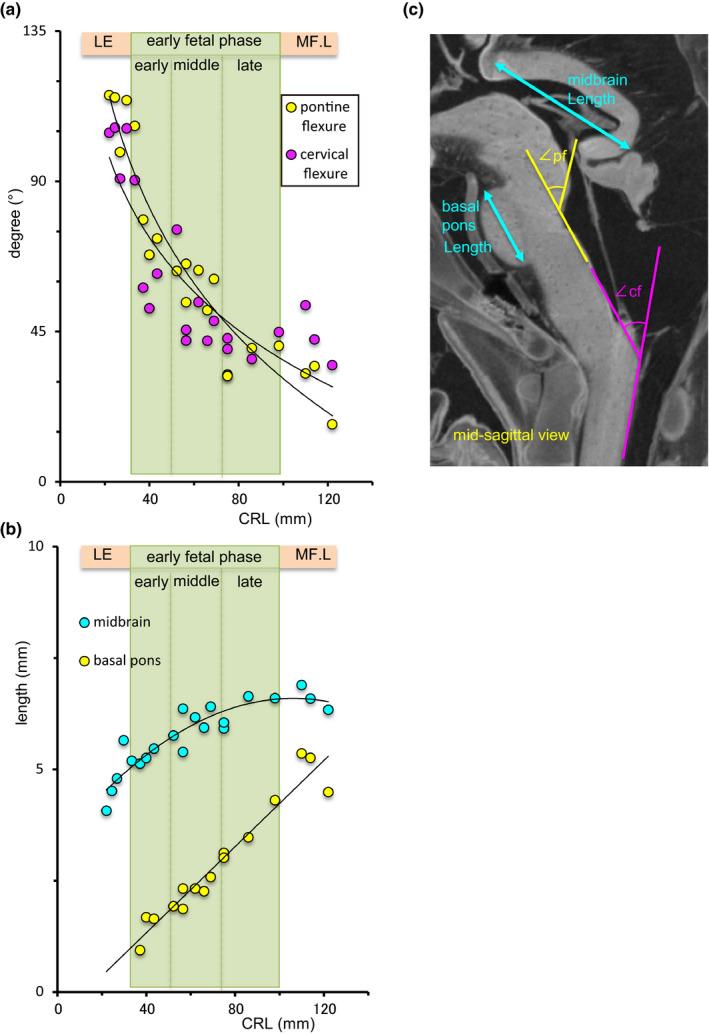
Morphometric analyses in the early foetal phase (9-13 postconceptional week) are critical for evaluating normal brain growth. In this study, we assessed sequential morphological and morphometric changes in the foetal brain during this period using high-resolution T1-weighted magnetic resonance imaging (MRI) scans from 21 samples preserved at Kyoto University. MRI sectional views (coronal, mid-sagittal, and horizontal sections) and 3D reconstructions of the whole brain revealed sequential changes in its external morphology and internal structures. The cerebrum's gross external view, lateral ventricle and choroid plexus, cerebral wall, basal ganglia and thalamus, and corpus callosum were assessed. The development of the cerebral cortex, white matter microstructure, and basal ganglia can be well-characterized using MRI scans. The insula became apparent and deeply impressed as brain growth progressed. A thick, densely packed cellular ventricular/subventricular zone and ganglionic eminence became apparent at high signal intensity. We detected the emergence of important landmarks which may be candidates in the subdivision processes during the early foetal period; the corpus callosum was first detected in the sample with crown-rump length (CRL) 62 mm. A primary sulcus on the medial part of the cortex (cingulate sulcus) was observed in the sample with CRL 114 mm. In the cerebellum, the hemispheres, posterolateral fissure, union of the cerebellar halves, and definition of the vermis were observed in the sample with CRL 43.5 mm, alongside the appearance of a primary fissure in the sample with CRL 56 mm and the prepyramidal fissure in the sample with CRL 75 mm. The volumetric, linear, and angle measurements revealed the comprehensive and regional development, growth, and differentiation of brain structures during the early foetal phase. The early foetal period was neither morphologically nor morphometrically uniform. The cerebral proportion (length/height) and the angle of cerebrum to the standard line at the lateral view of the cerebrum, which may reflect the growth and C-shape formation of the cerebrum, may be a candidate for subdividing the early foetal period. Future precise analyses must establish a staging system for the brain during the early foetal period. This study provides insights into brain structure, allowing for a correlation with functional maturation and facilitating the early detection of brain damage and abnormal development.

Keywords: T1-weighted magnetic resonance imaging; early foetal phase; foetal brain development; three-dimensional analysis.


Conflict of interest statement

There are no conflicts of interest to declare.

Figures

FIGURE 1
FIGURE 1
3D reconstruction of the foetal brain. (a) Lateral external view. Cerebrum (green), interbrain (diencephalon and hypothalamus) (orange), midbrain (blue), rostral hindbrain and cerebellum (yellow), and caudal hindbrain (purple). (b) Ventricle (blue) and choroid plexus (purple) in the lateral ventricle observed through transparent brain tissue (same scale). The standard line was defined as the tangential line of the frontal lobe of the cerebral hemisphere, which goes through the pituitary gland (red circle). The number indicates the CRL of the samples. Note that distribution of the choroid plexus in the lateral ventricle was not uniform from the anterior to posterior part
FIGURE 2
FIGURE 2
Morphometry on external view of the forebrain. (a) Cerebral proportion. The cerebral proportion was defined as the height per anterior–posterior length. See also (d). LE: late embryonic stage, MF.E: middle foetal phase with early part. (b) The angle of the cerebrum to the standard line (green), cerebrum to caudal hindbrain (purple), and cerebrum to the spinal cord (white) were indicated. The standard line was defined as the tangential line of the frontal lobe of the cerebral hemisphere, which goes through the pituitary gland. (c) Width of the cerebrum (green) and diencephalon (orange). The widths of other regions (midbrain, rostral hindbrain, cerebellum, and spinal cord) are indicated in Figure S1. (d) 3D reconstruction of the lateral view indicating angle measurements and calculation of the cerebral proportion. Angles of the spinal cord to the cerebrum (cx_spc), hindbrain to cerebrum (cx_hb), and cerebrum to the standard line (cx_stl) were measured. The tangential line of the frontal lobe, which passed through the pituitary gland by lateral view, was defined as the standard line. The cerebral proportion was defined as the ratio of the length to the height of the cerebrum. (e) 3D reconstruction of the posterior view for the width measurements. The widths of the cerebrum and diencephalon were measured
FIGURE 3
FIGURE 3
(a) Tissue volume of the whole brain, cerebrum, and interbrain (diencephalon and hypothalamus) (b) and volume rate of cerebrum, interbrain (diencephalon and hypothalamus), and forebrain to the whole brain. Whole brain (white), cerebrum (green), interbrain (diencephalon and hypothalamus) (orange). The volume of the midbrain, rostral hindbrain and cerebellum, and caudal hindbrain, and the volume ratio to the cerebrum are shown in Figure S2. LE: late embryonic stage, MF.E: middle foetal phase with early part
FIGURE 4
FIGURE 4
Growth of the cerebrum, lateral ventricle, and choroid plexus. (a) Volume (mm3 ^1/3) of the cerebrum (green), lateral ventricle (light blue), and choroid plexus (purple). (b) Volume ratio of the lateral ventricle (light blue) and choroid plexus (purple) to the cerebrum. (c) Volume ratio of the choroid plexus to lateral ventricle. LE: late embryonic stage, MF.E: middle foetal phase with early part
FIGURE 5
FIGURE 5
MRI coronal section including the pituitary gland. The coronal plane was defined as that which was vertical to the AC‐PC line. cn: caudate nucleus, cp: choroid plexus, ec: external capsule, fo: fornix, ge: ganglionic eminence, gp: globus pallidus ext., hc: hippocampus, ht: hypothalamus, ic: internal capsule, in: insula, pg: pituitary gland, pu: putamen, st: subthalamus, th: thalamus, v3: third ventricle. Note the initial sulcus formation at the insula in the sample with middle foetal phase with early part (CRL 122 mm) (122_1 arrowhead) and at the medial part of the cerebral wall (CRL 122_2 high magnification)
FIGURE 6
FIGURE 6
MRI horizontal section including anterior and posterior commissure. ac: anterior commissure, ah: anterior horn, cn: caudate nucleus, ec: external capsule, ge: ganglionic eminence, hc: hippocampus, pc: posterior commissure, pu: putamen, th: thalamus, v3: third ventricle. Note that the cerebrum developed posteriorly and inferiorly. Internally, representative anatomical structures can be identified in early foetal phase. For example, the trilaminar appearance of the cerebral wall; transient, thick proliferative foetal zones (ventricular and subventricular); protruding large and high MRI signal intense ganglionic eminence. Higher MRI signal intensity of dorsomedial thalamus; lateral geniculate body with higher MRI intensity
FIGURE 7
FIGURE 7
Cerebral wall development. (a) Mid‐lateral portion of the cerebral wall on MRI. A coronal section including the pituitary gland was selected. Gradual changes in lamination and formation of the subplate zone are indicated. First appearance of subplate zone was indicated (*). (b) The thickness of the cerebral wall at the lateral, superior, and medial portions. The white lines indicate the tangential line of the ganglionic eminence (ge) and its orthogonal line. The thickness of the cerebral cortex is represented at the lateral (blue), superior (red), and medial (yellow) regions, as measured on these lines. (c) Surface colour mapping external view of the whole brain at early foetal phase with late part (CRL 75 mm). The thickness of cerebral wall changes was visualized using a rainbow colour scale (range: 0–2 mm). Surface colour mapping at other phases were provided in Figure S3
FIGURE 8
FIGURE 8
Length of the corpus callosum and distance between the anterior and posterior commissure (AC_PC) on mid‐sagittal sections. LE: late embryonic stage, MF.E: middle foetal phase with early part
FIGURE 9
FIGURE 9
Mid‐sagittal MRI sections. ac: anterior commissure, aq: cerebral aqueduct, bp: basal pons, cc: corpus callosum, cer: cerebellum, ep: epiphysis, lt: lamina terminalis, oc: optic chiasma, pc: posterior commissure, pg: pituitary gland, sr: suprapineal recess, v3: third ventricle, v4: fourth ventricle
FIGURE 10
FIGURE 10
Morphometry of the brain stem. (a) Pontine flexure (yellow) and cervical flexure (purple). LE: late embryonic stage, MF.E: middle foetal phase with early part. (b) Length of the midbrain (blue) and basal pons (yellow). (c) Mid‐sagittal section for the linear and angular measurements of the brain stem. pf: pontine flexure, angle between the rostral and caudal hindbrain, cf: cervical flexure, angle between the caudal hindbrain and spinal cord
FIGURE 11
FIGURE 11
Cerebellar growth. MRI mid‐sagittal section, coronal section, and 3D reconstruction. Surface colour mapping posterior view of the cerebellum. The thickness of brain tissue changes was visualized using a rainbow colour scale (range: 0–2 mm). CE: central lobule, CU: culmen, CP: choroid plexus, L: lingula, N: nodule, P: primary fissure, PL: posterolateral fissure, PP: prepyramidal fissure, Py; pyramis, T: tuber, U: uvula
FIGURE 12
FIGURE 12
Morphometric characteristics of the cerebellum. (a) Height at the sagittal section, which includes the middle of the hemisphere (H_ps, yellow) and mid‐sagittal section (H_ms, blue). See also Figure 12c. LE: late embryonic stage, MF.E: middle foetal phase with early part. (b) Width (white) and length (purple) of the cerebellum. Width ratio of the cerebellum to the cerebrum (Cb/Cx) is indicated as (X) with blue. (c) i) Cerebellar length (purple) and height at the mid‐sagittal section (H_ms, blue), ii) para‐sagittal section, which includes the middle of the hemisphere (H_ps, yellow), and fourth ventricle (iv) iii) 3D reconstruction of the posterior view for the width measurements. The widths of the cerebellum (Cb) and cerebrum (Cx) were measured. Cb/Cx ratio was calculated

Similar articles

Cited by

References

    1. Bayer, S. & Altman, J. (2006) The human brain during the late first trimester. Boca Raton, FL; London: CRC; Taylor & Francis distributor, 592 pp.
    1. Blaas, H.G. (1999) The embryonic examination. Ultrasound studies on the development of the human embryo. PhD thesis. 10.13140/RG.2.1.5176.6642 - DOI
    1. Blaas, H.G. , Eik‐Nes, S.H. , Berg, S. & Torp, H. (1998) In‐vivo three‐dimensional ultrasound reconstructions of embryos and early fetuses. Lancet, 352, 1182–1186. - PubMed
    1. Boonstra, H. , Oosterhuis, J. , Oosterhuis, A. & Fleuren, G. (1983) Cervical tissue shrinkage by formaldehyde fixation, paraffin wax embedding, section cutting and mounting. Virchows Archiv A Pathological Anatomy and Histopathology, 402, 195–201. - PubMed
    1. Desmond, M.E. & O'Rahilly, R. (1981) The growth of the human brain during the embryonic period proper. 1. Linear axes. Anatomy and Embryology, 162, 137–151. - PubMed

Publication types

LinkOut - more resources