

MZT2A promotes NSCLC viability and invasion by increasing Akt phosphorylation via the MOZART2 domain
- PMID: 33754417
- PMCID: PMC8177791
- DOI: 10.1111/cas.14900
MZT2A promotes NSCLC viability and invasion by increasing Akt phosphorylation via the MOZART2 domain
Abstract
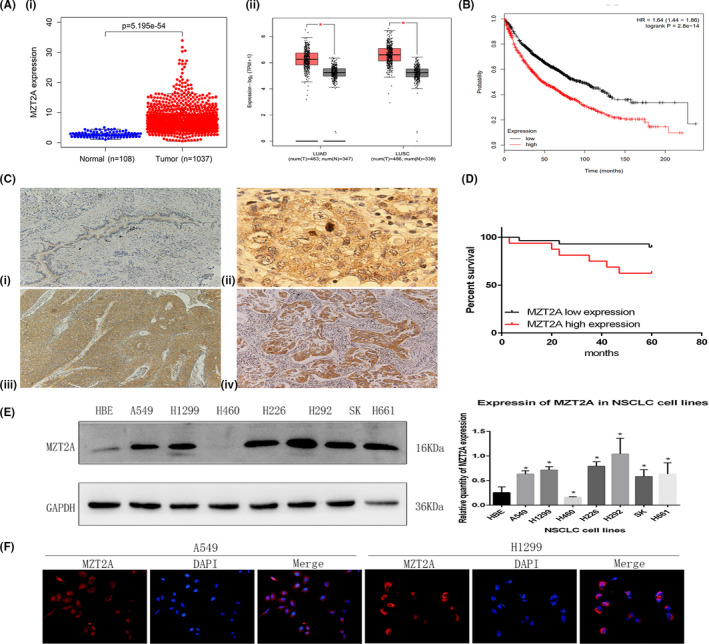
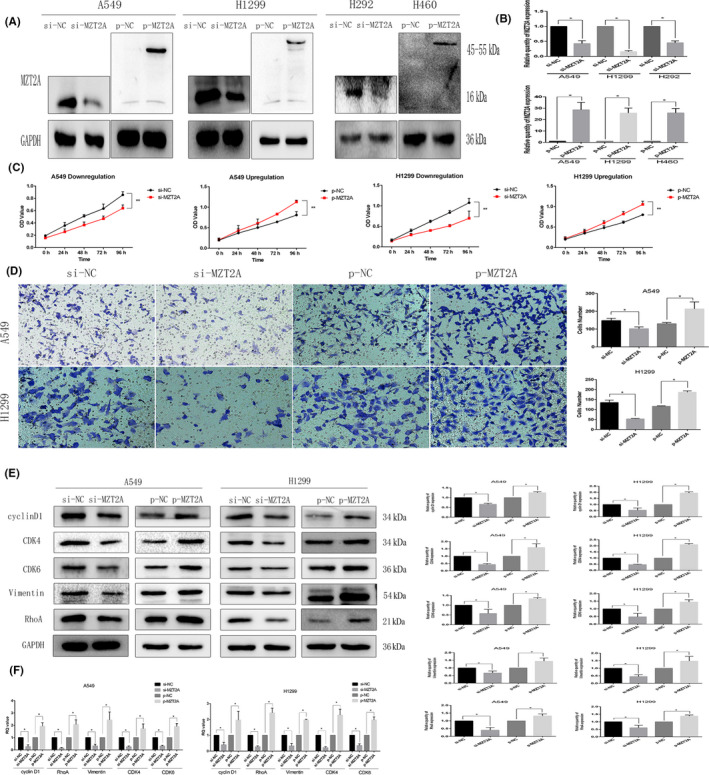
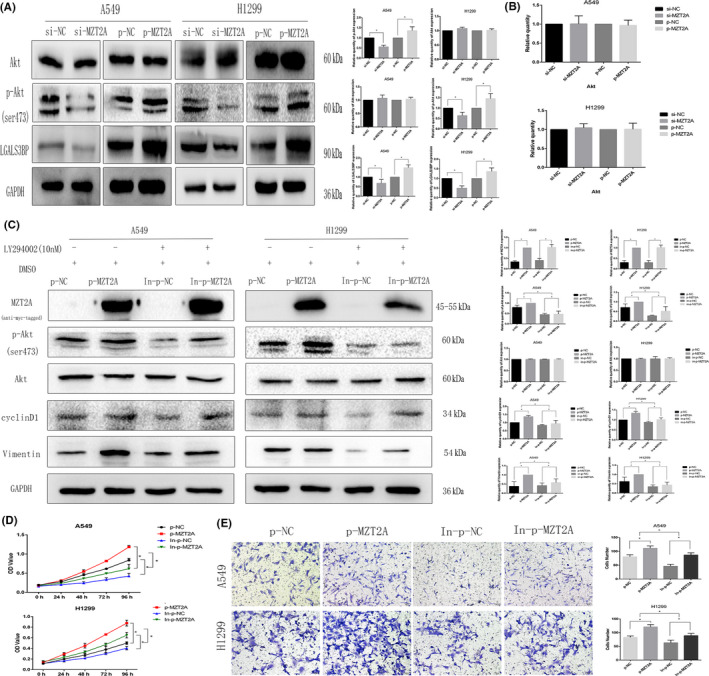
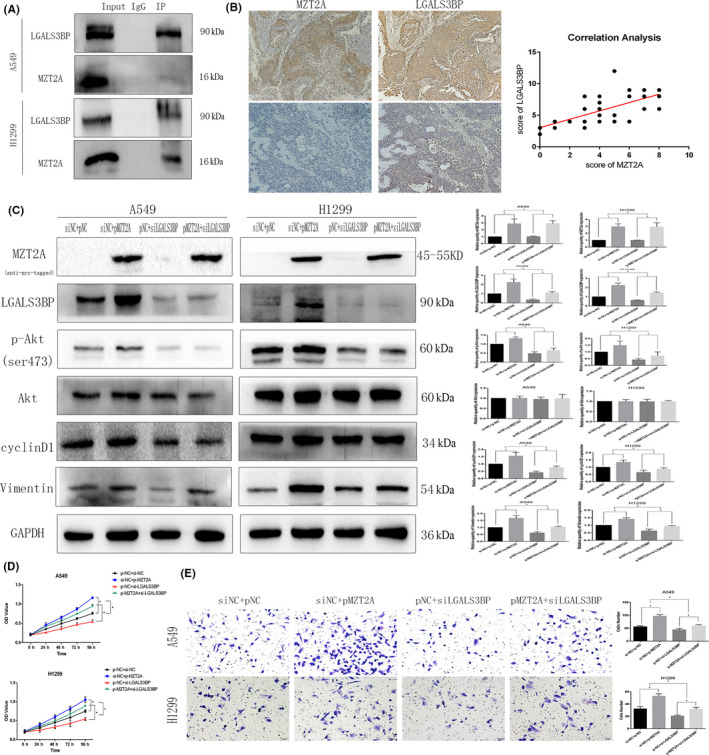
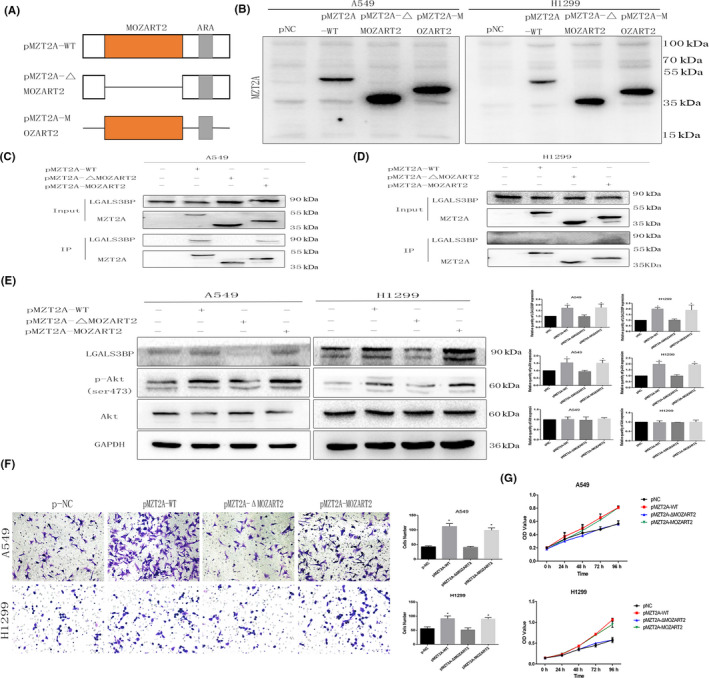
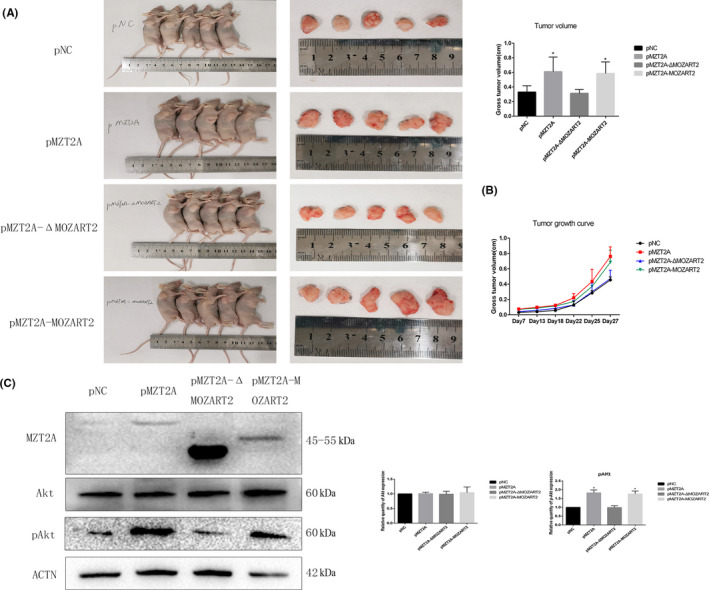
Mitotic spindle organizing protein 2A (MZT2A) is localized at the centrosome and regulates microtubule nucleation activity in cells. This study assessed the role of MZT2A in non-small-cell lung cancer (NSCLC). Differential MZT2A expression was bioinformatically assessed using TCGA database, the GEPIA database, and Kaplan-Meier survival data to determine the association between MZT2A expression and NSCLC prognosis. Furthermore, NSCLC tissue specimens were evaluated by immunohistochemistry. MZT2A was overexpressed or knocked down in NSCLC cells using cDNA and siRNA, respectively. The cells were subjected to various assays and treated with the selective Akt inhibitor LY294002 or co-transfected with galectin-3-binding protein (LGALS3BP) siRNA. MZT2A mRNA and protein levels were upregulated in NSCLC lesions and MTZ2A expression was associated with poor NSCLC prognosis. MZT2A protein was also highly expressed in NSCLC cells compared with the expression in normal bronchial cells. MZT2A expression promoted NSCLC cell viability and invasion, whereas MTZ2A siRNA had the opposite effect on NSCLC cells in vitro. At the protein level, MZT2A induced Akt phosphorylation, promoting NSCLC proliferation and invasion (but the selective Akt inhibitor blocked these effects) through upregulation of LGALS3BP via the MTZ2A MOZART2 domain, whereas LGALS3BP siRNA suppressed MTZ2A activity in NSCLC cells. The limited in vivo experiments confirmed the in vitro data. In conclusion, MZT2A exhibits oncogenic activity by activating LGALS3BP and Akt in NSCLC. Future studies will assess MTZ2A as a biomarker to predict NSCLC prognosis or as a target in the control of NSCLC progression.
Keywords: Akt; LGALS3BP; MZT2A; NSCLC; prognosis.
© 2021 The Authors. Cancer Science published by John Wiley & Sons Australia, Ltd on behalf of Japanese Cancer Association.
Conflict of interest statement
The authors declare that there is no conflict of interest in this work.
Figures
Similar articles
-
Overexpression of CASS4 promotes invasion in non-small cell lung cancer by activating the AKT signaling pathway and inhibiting E-cadherin expression.Tumour Biol. 2016 Nov;37(11):15157-15164. doi: 10.1007/s13277-016-5411-5. Epub 2016 Sep 27. Tumour Biol. 2016. PMID: 27677288
-
FAM83D promotes epithelial-mesenchymal transition, invasion and cisplatin resistance through regulating the AKT/mTOR pathway in non-small-cell lung cancer.Cell Oncol (Dordr). 2020 Jun;43(3):395-407. doi: 10.1007/s13402-020-00494-9. Epub 2020 Jan 31. Cell Oncol (Dordr). 2020. PMID: 32006253
-
UBQLN4 promotes the proliferation and invasion of non-small cell lung cancer cell by regulating PI3K/AKT pathway.J Cancer Res Clin Oncol. 2024 Jul 6;150(7):335. doi: 10.1007/s00432-024-05862-8. J Cancer Res Clin Oncol. 2024. PMID: 38969831 Free PMC article.
-
[Current status of Akt in non-small cell lung cancer].Zhongguo Fei Ai Za Zhi. 2010 Nov;13(11):1059-63. doi: 10.3779/j.issn.1009-3419.2010.11.12. Zhongguo Fei Ai Za Zhi. 2010. PMID: 21081049 Free PMC article. Review. Chinese.
-
Role of galectin 3 binding protein in cancer progression: a potential novel therapeutic target.J Transl Med. 2021 Sep 26;19(1):405. doi: 10.1186/s12967-021-03085-w. J Transl Med. 2021. PMID: 34565385 Free PMC article. Review.
Cited by
-
DDX19A promotes gastric cancer cell proliferation and migration by activating the PI3K/AKT pathway.Cancer Cell Int. 2024 Aug 3;24(1):272. doi: 10.1186/s12935-024-03448-5. Cancer Cell Int. 2024. PMID: 39097730 Free PMC article.
-
Dysregulation of Microtubule Nucleating Proteins in Cancer Cells.Cancers (Basel). 2021 Nov 11;13(22):5638. doi: 10.3390/cancers13225638. Cancers (Basel). 2021. PMID: 34830792 Free PMC article. Review.
-
Identification of Key Genes Related to CD8+ T-Cell Infiltration as Prognostic Biomarkers for Lung Adenocarcinoma.Front Oncol. 2021 Sep 28;11:693353. doi: 10.3389/fonc.2021.693353. eCollection 2021. Front Oncol. 2021. PMID: 34650911 Free PMC article.
-
Calponin 3 suppresses proliferation, migration and invasion of non-small cell lung cancer cells.Oncol Lett. 2021 Aug;22(2):634. doi: 10.3892/ol.2021.12895. Epub 2021 Jul 1. Oncol Lett. 2021. PMID: 34267826 Free PMC article.
-
Global Transcriptomic Analysis of Topical Sodium Alginate Protection against Peptic Damage in an In Vitro Model of Treatment-Resistant Gastroesophageal Reflux Disease.Int J Mol Sci. 2024 Oct 5;25(19):10714. doi: 10.3390/ijms251910714. Int J Mol Sci. 2024. PMID: 39409043 Free PMC article.
References
-
- Bray F, Ferlay J, Soerjomataram I, Siegel RL, Torre LA, Jemal A. Global cancer statistics 2018: GLOBOCAN estimates of incidence and mortality worldwide for 36 cancers in 185 countries. CA Cancer J Clin. 2018;68(6):394‐424. - PubMed
-
- Siegel RL, Miller KD, Jemal A. Cancer statistics, 2019. CA Cancer J Clin. 2019;69(1):7‐34. - PubMed
-
- Torre LA, Bray F, Siegel RL, Ferlay J, Lortet‐Tieulent J, Jemal A. Global cancer statistics, 2012. CA Cancer J Clin. 2015;65(2):87‐108. - PubMed
-
- Torre LA, Siegel RL, Jemal A. Lung cancer statistics. Adv Exp Med Biol. 2016;893:1‐19. - PubMed
-
- Goldstraw P, Ball D, Jett JR, et al. Non‐small‐cell lung cancer. Lancet. 2011;378(9804):1727‐1740. - PubMed
MeSH terms
Substances
LinkOut - more resources
Full Text Sources
Other Literature Sources
Medical
Molecular Biology Databases
Miscellaneous
