. 2021 Mar;26(3):036005.
doi: 10.1117/1.JBO.26.3.036005.

Patient-derived cancer organoid tracking with wide-field one-photon redox imaging to assess treatment response

Affiliations

Patient-derived cancer organoid tracking with wide-field one-photon redox imaging to assess treatment response

Daniel A Gil et al. J Biomed Opt. 2021 Mar.

Abstract

Significance: Accessible tools are needed for rapid, non-destructive imaging of patient-derived cancer organoid (PCO) treatment response to accelerate drug discovery and streamline treatment planning for individual patients.

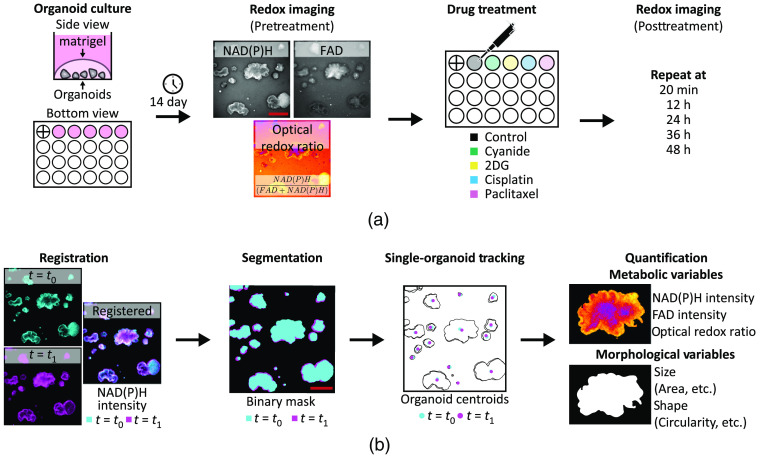
Aim: To segment and track individual PCOs with wide-field one-photon redox imaging to extract morphological and metabolic variables of treatment response.

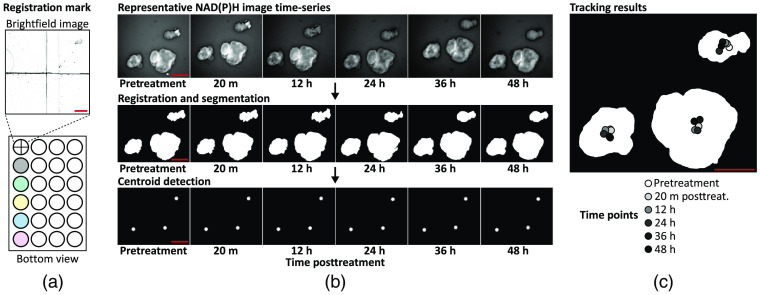
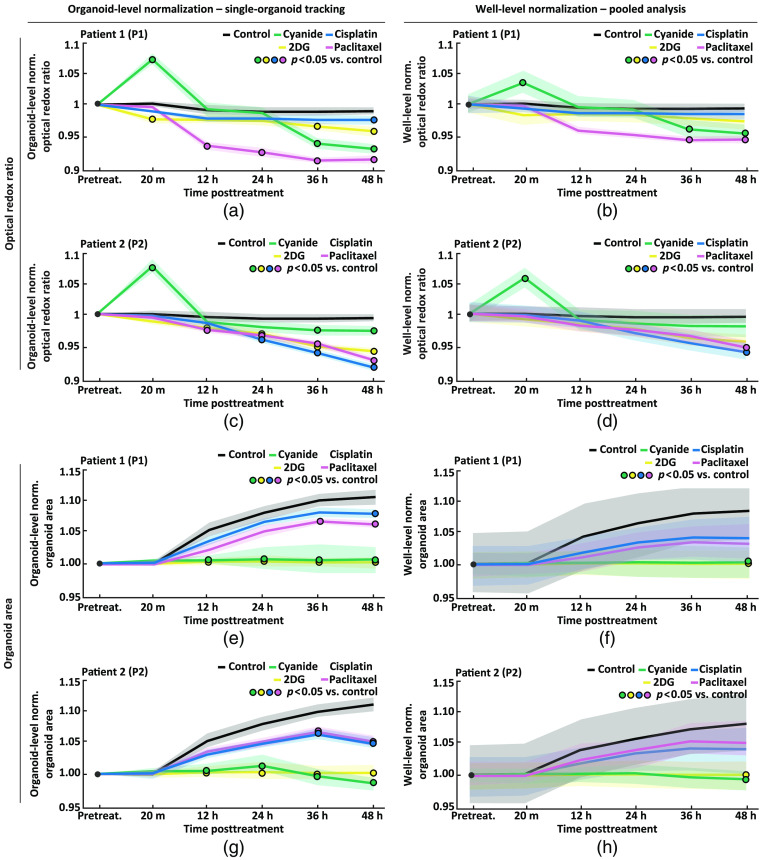
Approach: Redox imaging of the endogenous fluorophores, nicotinamide dinucleotide (NADH), nicotinamide dinucleotide phosphate (NADPH), and flavin adenine dinucleotide (FAD), was used to monitor the metabolic state and morphology of PCOs. Redox imaging was performed on a wide-field one-photon epifluorescence microscope to evaluate drug response in two colorectal PCO lines. An automated image analysis framework was developed to track PCOs across multiple time points over 48 h. Variables quantified for each PCO captured metabolic and morphological response to drug treatment, including the optical redox ratio (ORR) and organoid area.

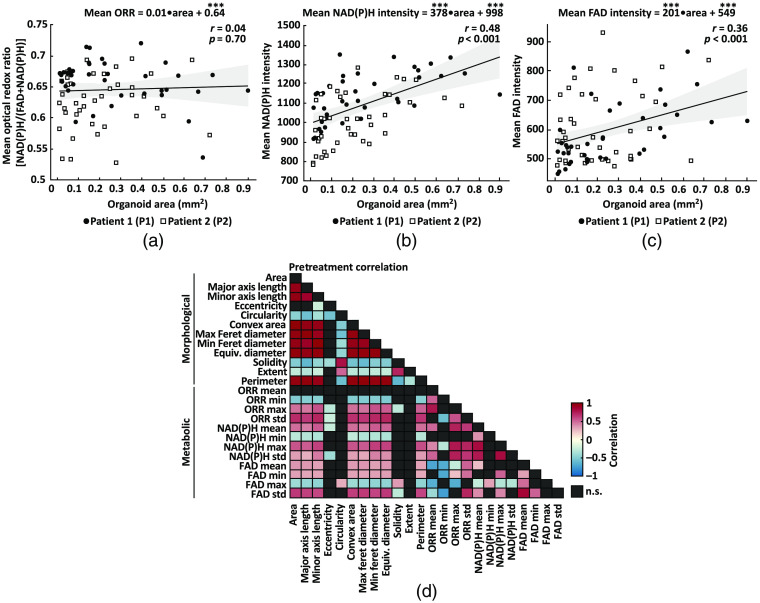
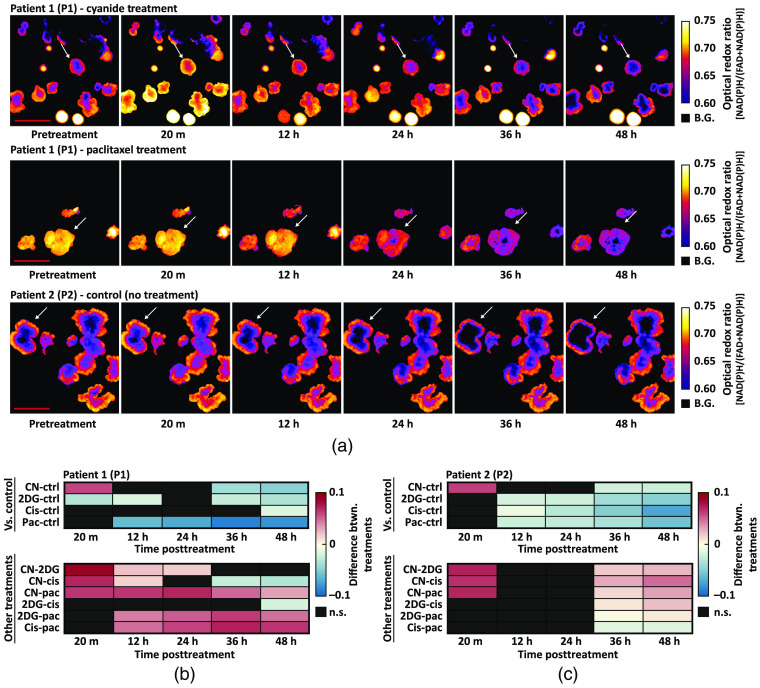
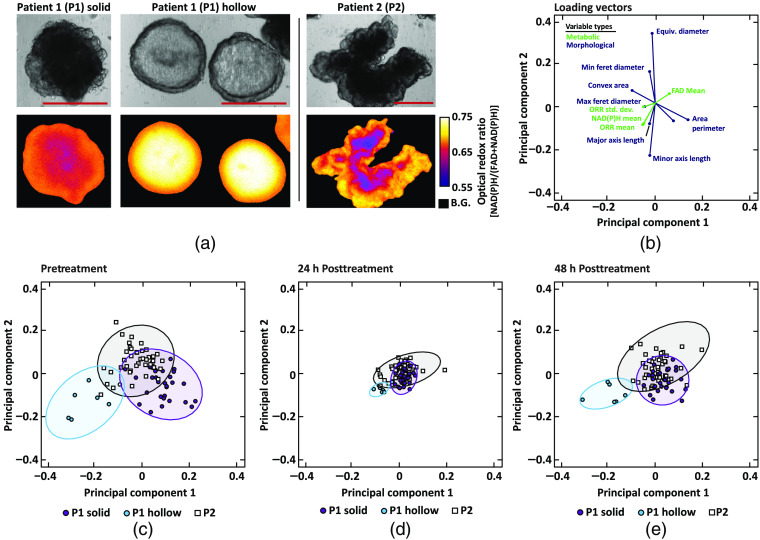
Results: The ORR (NAD(P)H/(FAD + NAD(P)H)) was independent of PCO morphology pretreatment. Drugs that induced cell death decreased the ORR and growth rate compared to control. Multivariate analysis of redox and morphology variables identified distinct PCO subpopulations. Single-organoid tracking improved sensitivity to drug treatment compared to pooled organoid analysis.

Conclusions: Wide-field one-photon redox imaging can monitor metabolic and morphological changes on a single organoid-level, providing an accessible, non-destructive tool to screen drugs in patient-matched samples.

Keywords: autofluorescence; cancer organoid; drug screening; image analysis; redox imaging; tracking.


Figures

Fig. 1
Fig. 1
Redox imaging of PCOs. An overview of the protocol for redox imaging and quantitative image analysis. (a) Graphical protocol showing the culturing of PCOs, pretreatment redox imaging, drug treatment, and posttreatment redox imaging time course. Redox imaging uses pairs of NAD(P)H and FAD fluorescence images from the same field-of-view to calculate the ORR image [NAD(P)H/(FAD + NAD(P)H)]. “+” in first well indicates registration mark. (b) Graphical representation of the image analysis pipeline, which includes registration of all frames in each image time series, organoid segmentation, single-organoid tracking, and quantification of metabolic and morphological variables to capture PCO drug response at each time point. Scale bar: 500  μm.
Fig. 2
Fig. 2
Single-organoid tracking. Organoid tracking over multiple time points was achieved with a registration mark and single-particle tracking. (a) A registration mark was inscribed on the bottom of the first well of the 24-well plate and referenced at each time point to ensure accurate XYZ positioning. (b) Organoid tracking was achieved by registering the NAD(P)H image time series, segmenting the organoids in each frame, and detecting the centroids of each segmented organoid. These centroids were tracked using an open-source single-particle tracking tool (TrackMate). (c) A segmented organoid mask at 48-h posttreatment is overlaid with the centroid tracking results at each imaging time point. Scale bar: 500  μm.
Fig. 3
Fig. 3
Analysis of organoid-level redox imaging variables. Analysis of variables extracted from all PCOs pretreatment. (a) Linear regression was used to quantify the relationship between organoid area and its mean ORR. The fitted model indicates the mean ORR value of each PCO is independent of its area (r=0.04, p=0.70) for all PCOs from patient 1 (P1) and patient (P2) pretreatment. Statistical significance of the model coefficients is indicated as *** for p<0.001. (b) Linear regression was used to quantify the relationship between organoid area and its mean NAD(P)H intensity. The fitted model indicates a moderate positive correlation (r=0.48, p<0.001) between organoid area and mean NAD(P)H intensity. (c) Linear regression was used to quantify the relationship between organoid area and its mean FAD intensity. The fitted model indicates a moderate positive correlation (r=0.36, p<0.001) between organoid area and mean FAD intensity. (d) Linear pairwise correlation (Pearson’s r) matrix of the variables extracted from each PCOs. Heatmap shows only statistically significant correlations (p<0.05); n.s., not significant (p>0.05, black boxes). Table 1 shows the number of PCOs in each treatment group for each patient.
Fig. 4
Fig. 4
Treatment-induced changes in PCO ORR. Quantitative image analysis tracked changes in the ORR of each PCO over time. (a) Representative ORR image time series for patient 1 (P1) and patient 2 (P2). Arrows indicate specific organoids representative of changes observed for that condition. B.G, background. (b) Heatmaps show the pairwise percent differences between pretreatment-normalized ORR between all treatment groups for P1. Top: pairwise percent differences between each treatment and control for P1. Bottom: pairwise percent differences between drug treatments (excluding control) for P1. (c) Heatmaps show the pairwise percent differences between pretreatment-normalized ORR between all treatment groups for P2. Top: pairwise percent differences between each treatment and control for P2. Bottom: pairwise percent differences between drug treatments for P2. All pairwise differences were calculated from the linear mixed-effect models via least-squares means. n.s., not significant (p>0.05, black boxes). Table 1 shows the number of PCOs in each treatment group for each patient. Scale bar: 500  μm.
Fig. 5
Fig. 5
Treatment-induced changes in PCO areas. Quantitative image analysis tracked changes in the area of each PCO over time. (a) Representative segmented image time series for patient 1 (P1) and patient 2 (P2). The color-coded value of each segmented organoid corresponds to value at each time point divided by its pretreatment value. Arrows indicate specific organoids that are representative of changes observed for that condition. (b) Heatmaps show the pairwise percent differences between pretreatment-normalized area between all treatment groups for P1. Top: pairwise percent differences between each treatment and control for P1. Bottom: pairwise percent differences between drug treatments (excluding control) for P1. (C) Heatmaps show the pairwise percent differences between pretreatment-normalized area between all treatment groups for P2. Top: pairwise percent differences between each treatment and control for P2. Bottom: pairwise percent differences between drug treatments for P2. All pairwise differences were calculated from the linear mixed-effect models via least-squares means. n.s., not significant (p>0.05, black boxes). Table 1 shows the number of PCO in each treatment group for each patient. Scale bar: 500  μm.
Fig. 6
Fig. 6
Comparison of single-organoid tracking and pooled analysis. Comparison of single-organoid tracking and pooled analysis using time series data from patient 1 (P1) and patient 2 (P2). Normalization refers to dividing the value of each organoid at each time point by either its own pretreatment value (organoid-level normalization) or the well-level mean (well-level normalization). (a), (b) Pretreatment normalized ORR using organoid-level normalization (left) and well-level normalization (right) for each treatment group for P1. (c), (d) Pretreatment normalized ORR using organoid-level normalization (left) and well-level normalization (right) for each treatment group for P2. (e), (f) Pretreatment normalized organoid area using organoid-level normalization (left) and well-level normalization (right) for each treatment group for P1. (g), (h) Pretreatment normalized organoid area using organoid-level normalization (left) and well-level normalization (right) for each treatment group for P2. Data in (a), (c), (e), (g) were analyzed using a linear mixed-effect model that uses single-organoid tracking to account for organoid-level variability. Data in (b), (d), (f), (h) were analyzed using a linear mixed-effect model that does not account for organoid-level variability due to the lack of single-organoid tracking. Data plotted are mean (lines) ± standard error of the mean (shaded area). Significant differences between a treatment and control (p<0.05) are indicated with a circle color-coded for the treatment group (see legend). Table 1 shows the number of PCOs in each group and for each patient.
Fig. 7
Fig. 7
Phenotypic identification of PCO subpopulations. Qualitative and quantitative (PCA) evaluation of PCOs with distinct phenotypes from patient 1 (P1) and patient 2 (P2). (a) Paired bright-field (top) and ORR (bottom) images of representative PCO from each of the three phenotypic subpopulations: P1 solid, P1 hollow, and P2. Scale bar: 250  μm. B.G., background. (b) Loading vectors for the 12 variables with the highest loading on PC1 and PC2, which were defined with pretreatment data only. Green are metabolic variables and blue are morphological variables. (c) Data from all organoids projected onto PC1 and PC2. Colors correspond to the three qualitatively identified phenotypic organoid subpopulations: P1 solid, P1 hollow, and P2. Ellipse containing 95% of the points for each group were also plotted. (d) The pretreatment PCs applied to data from the PCOs at 24-h posttreatment. (e) The pretreatment PCs applied to data from PCOs at 48-h posttreatment.

Similar articles

Cited by

References

    1. Fountzilas E., Tsimberidou A. M., “Overview of precision oncology trials: challenges and opportunities,” Expert Res. Clin. Pharmacol. 11(8), 797–804 (2018).10.1080/17512433.2018.1504677 - DOI - PMC - PubMed
    1. Prasad V., “Perspective: the precision-oncology illusion,” Nature 537(7619), S63–S63 (2016).10.1038/537S63a - DOI - PubMed
    1. Tannock I. F., Hickman J. A., “Limits to personalized cancer medicine,” N. Engl. J. Med. 375(13), 1289–1294 (2016).NEJMAG10.1056/NEJMsb1607705 - DOI - PubMed
    1. Letai A., “Functional precision cancer medicine—moving beyond pure genomics,” Nat. Med. 23(9), 1028–1035 (2017).10.1038/nm.4389 - DOI - PubMed
    1. Sachs N., et al. , “A living biobank of breast cancer organoids captures disease heterogeneity,” Cell 172(1-2), 373–386.e10 (2018).CELLB510.1016/j.cell.2017.11.010 - DOI - PubMed

Publication types