. 2021 Mar 23:10:e66567.
doi: 10.7554/eLife.66567.

Allosteric communication in class A β-lactamases occurs via cooperative coupling of loop dynamics

Affiliations

Allosteric communication in class A β-lactamases occurs via cooperative coupling of loop dynamics

Ioannis Galdadas et al. Elife. .

Abstract

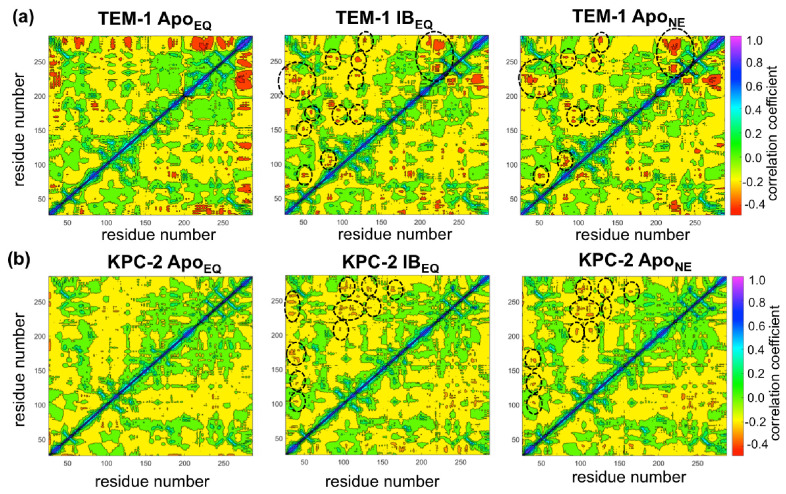
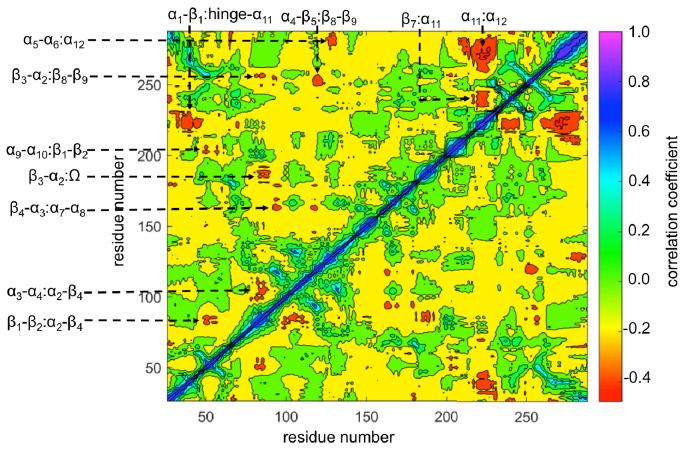
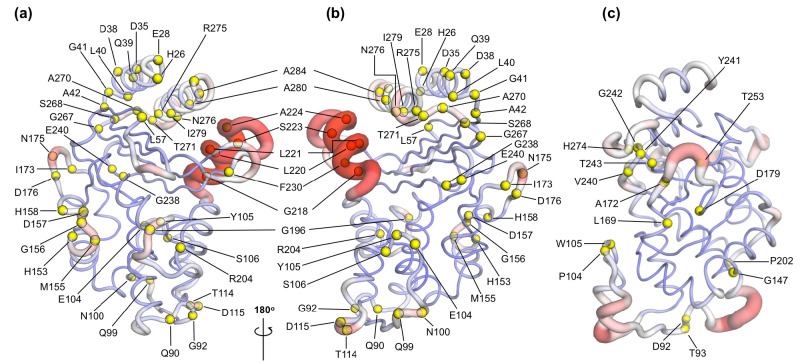
Understanding allostery in enzymes and tools to identify it offer promising alternative strategies to inhibitor development. Through a combination of equilibrium and nonequilibrium molecular dynamics simulations, we identify allosteric effects and communication pathways in two prototypical class A β-lactamases, TEM-1 and KPC-2, which are important determinants of antibiotic resistance. The nonequilibrium simulations reveal pathways of communication operating over distances of 30 Å or more. Propagation of the signal occurs through cooperative coupling of loop dynamics. Notably, 50% or more of clinically relevant amino acid substitutions map onto the identified signal transduction pathways. This suggests that clinically important variation may affect, or be driven by, differences in allosteric behavior, providing a mechanism by which amino acid substitutions may affect the relationship between spectrum of activity, catalytic turnover, and potential allosteric behavior in this clinically important enzyme family. Simulations of the type presented here will help in identifying and analyzing such differences.

Keywords: KPC-2; TEM-1; medicine; molecular biophysics; structural biology; β-lactamase.

Plain language summary

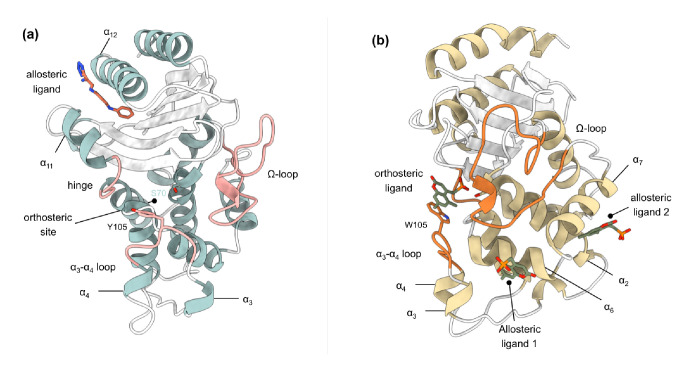
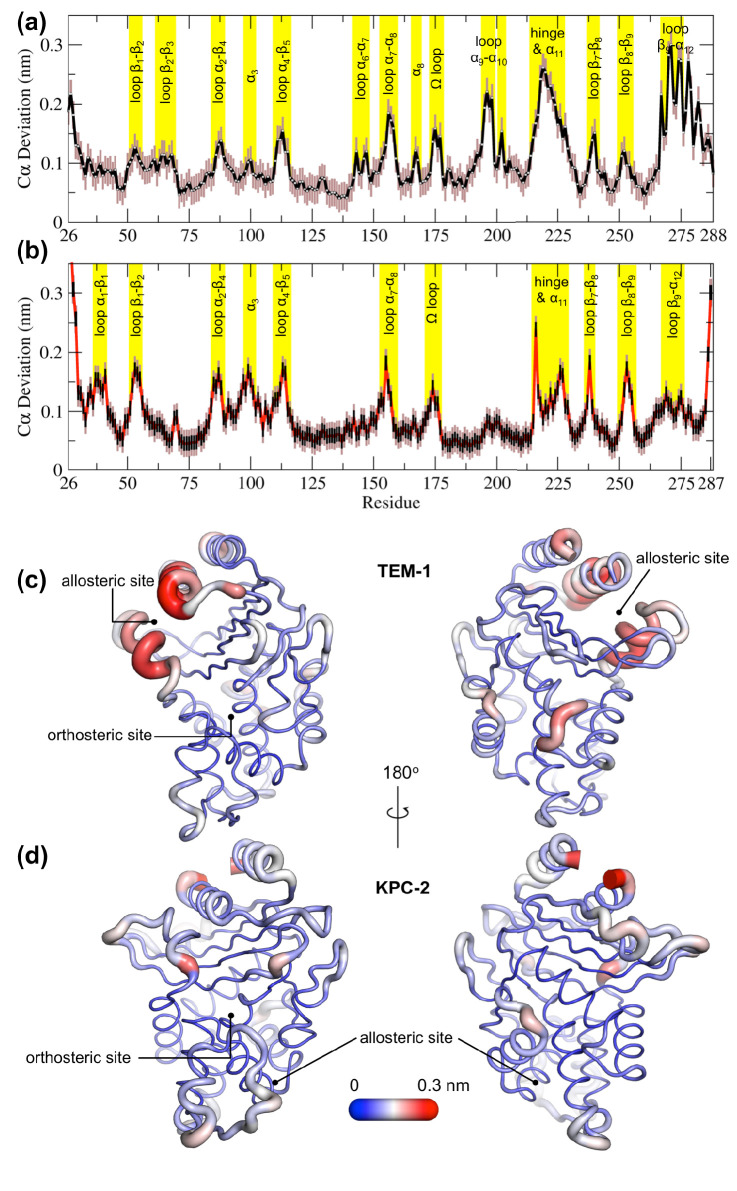
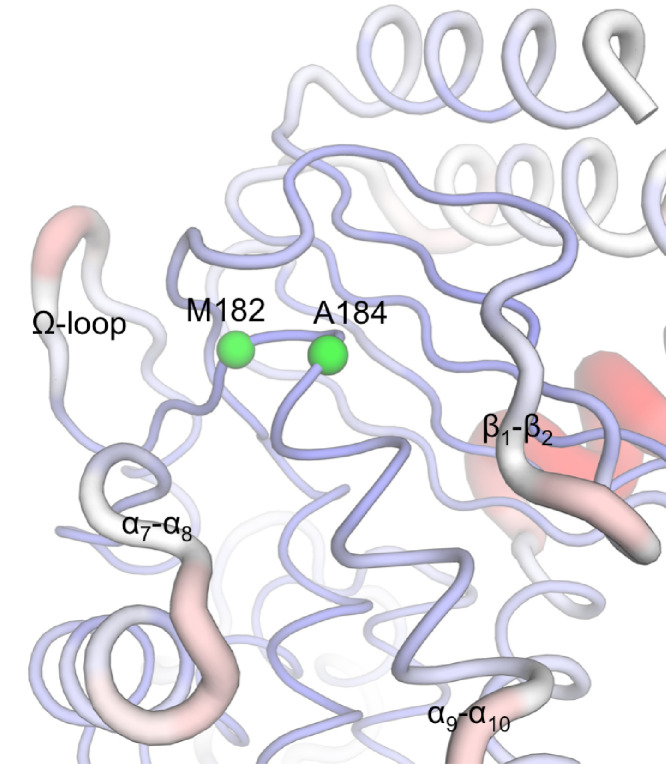
Antibiotics are crucial drugs for treating and preventing bacterial infections, but some bacteria are evolving ways to resist their effects. This ‘antibiotic resistance’ threatens lives and livelihoods worldwide. β-lactam antibiotics, like penicillin, are some of the most commonly used, but some bacteria can now make enzymes called β-lactamases, which destroy these antibiotics. Dozens of different types of β-lactamases now exist, each with different properties. Two of the most medically important are TEM-1 and KPC-2. One way to counteract β-lactamases is with drugs called inhibitors that stop the activity of these enzymes. The approved β-lactamase inhibitors work by blocking the part of the enzyme that binds and destroys antibiotics, known as the 'active site'. The β-lactamases have evolved, some of which have the ability to resist the effects of known inhibitors. It is possible that targeting parts of β-lactamases far from the active site, known as 'allosteric sites', might get around these new bacterial defences. A molecule that binds to an allosteric site might alter the enzyme's shape, or restrict its movement, making it unable to do its job. Galdadas, Qu et al. used simulations to understand how molecules binding at allosteric sites affect enzyme movement. The experiments examined the structures of both TEM-1 and KPC-2, looking at how their shapes changed as molecules were removed from the allosteric site. This revealed how the allosteric sites and the active site are linked together. When molecules were taken out of the allosteric sites, they triggered ripples of shape change that travelled via loop-like structures across the surface of the enzyme. These loops contain over half of the known differences between the different types of β-lactamases, suggesting mutations here may be responsible for changing which antibiotics each enzyme can destroy. In other words, changes in the 'ripples' may be related to the ability of the enzymes to resist particular antibiotics. Understanding how changes in one part of a β-lactamase enzyme reach the active site could help in the design of new inhibitors. It might also help to explain how β-lactamases evolve new properties. Further work could show why different enzymes are more or less active against different antibiotics.


Conflict of interest statement

IG, SQ, AO, EO, AM, MM, CT, FG, JS, RB, AM, SH No competing interests declared, PA Pratul K Agarwal is the founder and owner of Arium BioLabs LLC.

Figures

Figure 1.
Figure 1.. Crystal structures of (a) TEM-1 (PDB id 1PZP) and (b) KPC-2 (PDB id 6D18) β-lactamases in complex with ligands bound to allosteric and the orthosteric sites.
The helices around the allosteric binding sites and the loops that define the orthosteric binding site are highlighted. In case of KPC-2, allosteric ligand 2 is the site investigated here. See Table S1 for structural nomenclature.
Figure 1—figure supplement 1.
Figure 1—figure supplement 1.. Catalytic cycle of a class A β-lactamase illustrated on the core structure of penicillins.
Class A β-lactamases use an active site serine nucleophile to cleave the β-lactam bond of the substrate in a two-step acylation-deacylation reaction cycle that leads to overall hydrolysis. (1) The acylation reaction initiates with the reversible binding of the antibiotic in the active site and the formation of the enzyme-substrate complex. In the next step, a general base-catalyzed nucleophilic attack on the β-lactam carbonyl by the serine hydroxyl takes place through a tetrahedral intermediate (2) to form a transient acyl-enzyme adduct (3). In the deacylation step, the acyl-enzyme adduct (3) undergoes a general base-catalyzed attack by a hydrolytic water molecule to form a second tetrahedral intermediate (4), which then forms a postcovalent product complex (5), from which the hydrolyzed product is released.
Figure 1—figure supplement 2.
Figure 1—figure supplement 2.. Naming of the loops based on the secondary structure it connects.
The loops are named based on the secondary structure it connects. For example, loop α1-β1 connects α1 helix and β1 sheet. It must be noted that the boundaries of the secondary structure are approximate and may vary by ±2 residues based on the visualization software used. This work employed ChimeraX to define secondary structure. The mutations listed are those that fall on the communication pathway.
Figure 2.
Figure 2.. Root-mean-square fluctuation (RMSF) differences between the ApoEQ and IBEQ states of the (a) TEM-1 and (b) KPC-2 systems.
The average change in RMSF in the ApoEQ (black), the IBEQ (red), the difference ApoEQ-IBEQ (green), and the associated ρ value (blue) is illustrated. The ρ values were obtained by conducting a Student’s t-test to compare ApoEQ and IBEQ systems and to assess the significance of the differences.
Figure 2—figure supplement 1.
Figure 2—figure supplement 1.. Schematic description of the long equilibrium (EQ) and short nonequilibrium (NE) simulations.
Twenty replicates of IBEQ simulations were run starting from the minimized crystal structure. From the equilibrated part of each replica (50 ns onward), the final conformation of the protein-ligand complex was extracted at every 5 ns, the perturbation (removal of the ligand) was introduced, and a short ApoNE simulations was run for 5 ns. In total, 800 ApoNE simulations were performed for each system. In addition to these simulations, 20 replicas of the ApoEQ were also simulated.
Figure 2—figure supplement 2.
Figure 2—figure supplement 2.. Conformational drift measured by Cα root mean square deviation.
(a) Time series of the Cα root-mean-square deviation (RMSD) of (i) TEM-1 ApoEQ, (ii) TEM-1 IBEQ, (iii) KPC-2 ApoEQ, and (iv) KPC-2 IBEQ systems, measured over the course of the 250 ns of each replica. The black line represents the average of the 20 replicates. (b) RMSD calculated as a function of the fraction of the total Cα atoms considered for structural alignment in (i) TEM-1 and (ii) KPC-2. The plots indicate that 80% of conformations in TEM-1 can be aligned to below 0.064 nm (ApoEQ; black) and 0.074 nm (IBEQ; red). Similarly, in KPC-2, 80% of the conformations could be superimposed to below 0.060 nm (ApoEQ; black) and 0.066 nm (IBEQ; red). This constitutes the core of the enzyme. (c) Fractional Cα RMSD calculated after identification of the core in (i) TEM-1 ApoEQ, (ii) TEM-1 IBEQ, (iii) KPC-2 ApoEQ, and (iv) KPC-2 IBEQ. The bottom black line denotes the stable core and consists of 80% Cα atoms. The top black line is the average of the remainder 20% Cα atoms calculated from all 20 replicates. These constitute the non-core Cα atoms that display deviation in all simulations.
Figure 2—figure supplement 3.
Figure 2—figure supplement 3.. Core Cα root-mean-square deviation (RMSD) superimposition from (a) TEM-1 and (b) KPC-2 IBEQ simulations.
The structural alignment was calculated from the equilibrated section of all IBEQ trajectories and rendered to illustrate 100 uniformly separated frames. The least mobile Cα atoms are colored blue and the most mobile atoms (red) provide the structural basis for the differential RMSDs.
Figure 2—figure supplement 4.
Figure 2—figure supplement 4.. Time evolution of the radius of gyration (Rg) over the course of the 250 ns of each replicate.
Time evolution of the Rg of the complete (a) TEM-1 ApoEQ, (b) TEM-1 IBEQ, (c) KPC-2 ApoEQ, and (d) KPC-2 IBEQ enzymes, measured over the course of the 250 ns of each replicate. The black line represents the average of 20 replicates.
Figure 2—figure supplement 5.
Figure 2—figure supplement 5.. Solvent accessible surface area (SASA) over the course of the 250 ns of each replicate.
SASA was calculated to assess structural distortion in the complete (a) TEM-1 ApoEQ, (b) TEM-1 IBEQ, (c) KPC-2 ApoEQ, and (d) KPC-2 IBEQ enzymes, measured over the course of the 250 ns of each replicate. The black line represents the average of 20 replicates.
Figure 2—figure supplement 6.
Figure 2—figure supplement 6.. Dynamical properties (root-mean-square deviation [RMSD], radius of gyration [Rg], and solvent accessible surface area [SASA]) used to assess structural stability of the systems over the course of the equilibrium simulation.
The values represent the averages calculated from the equilibrated part (50–250 ns) of all 20 replicate simulations of each system.
Figure 2—figure supplement 7.
Figure 2—figure supplement 7.. Probability to find each residue in a coil, helix, or strand over the course of the 250 ns of each replicate.
Probability to find each residue in a coil (C), helix (H), or strand (E). The secondary structure element was assigned to each residue in each frame of each of the 20 replicas per system using the DSSP algorithm as implemented in MDTraj python library. The secondary structure of TEM-1 and KPC-2 as assigned from the crystal structure (cryst.), as well as the most probable assignment according to the simulations (sim.) is depicted as a cartoon below each plot.
Figure 3.
Figure 3.. Average positional Cα deviations between the ApoEQ and IBEQ states of (a) TEM-1 and (b) KPC-2.
Important structural motifs are highlighted and labeled on the plots. The brown vertical lines represent the standard deviation of the mean. The averaged Cα positional deviations mapped onto the averaged ApoEQ structures of (c) TEM-1 and (d) KPC-2 to visualize the largest relative displacements. The average deviation was determined from a combination of all 20 ApoEQ and 20 IBEQ trajectories. The thickness of the cartoon corresponds to the Cα deviation.
Figure 3—figure supplement 1.
Figure 3—figure supplement 1.. Positional Cα root-mean-square fluctuation (RMSF) of (a) TEM-1 ApoEQ, (b) TEM-1 IBEQ, (c) KPC-2 ApoEQ, and (d) KPC-2 IBEQ systems.
The black line represents the average RMSF calculated from the last 200 ns of all 20 replicate simulations. This average value is mapped onto the structure to highlight regions of high flexibility.
Figure 3—figure supplement 2.
Figure 3—figure supplement 2.. Snapshot of the last frame from TEM-1 IBEQ and KPC-2 IBEQ replicate simulations.
Snapshot of the last frame from (a) TEM-1 IBEQ and (b) KPC-2 IBEQ replicate simulations, highlighting the spatial position of the ligands in the allosteric binding sites. FTA is represented as blue sticks and GTV is colored in red.
Figure 3—figure supplement 3.
Figure 3—figure supplement 3.. Average Cα deviation between the IBEQ and ApoNE calculated using the subtraction method for (a) TEM-1 and (b) KPC-2.
Average from all 800 simulations at various time points is illustrated. The average Cα deviation between the IBEQ and ApoNE simulations is plotted as a dotted line for comparison.
Figure 4.
Figure 4.. Communication pathways in (a, b) TEM-1 and (c) KPC-2.
The average Cα deviations correspond to the average difference in the position of each Cα atom between all 800 pairs of IBEQ and ApoNE simulations at specific time points. The averaged Cα deviations are mapped onto the average ApoEQ structure. The arrows mark the direction of the propagation of the signal, caused by the perturbation (removal of the ligand). The red and the black arrows highlight different paths taken by the propagating signals (also see movies Figure 4—video 1, Figure 4—video 2, Figure 4—video 3).
Figure 5.
Figure 5.. Dynamic cross-correlation maps (DCCMs) computed for (a) TEM-1 and (b) KPC-2 Apo equilibrium (ApoEQ), inhibitor-bound equilibrium (IBEQ), and Apo nonequilibrium (ApoNE) trajectories.
The DCCMs for equilibrium trajectories were calculated as an average of 20 replica simulations, while the ApoNE DCCM indicates an averaged DCCM from an ensemble of 40 short (5 ns) MD trajectories. Green regions indicate no correlation, yellow indicates moderate negative correlation, while orange and red indicate significant negative correlations and blue regions indicate positive correlations. In TEM-1 ApoNE, regions showing significant changes from ApoEQ and IBEQ bound simulations have been marked by black dashed ellipses.
Figure 5—figure supplement 1.
Figure 5—figure supplement 1.. TEM-1 averaged dynamic cross-correlation map (DCCM) computed from all nonequilibrium trajectories.
The regions showing significant correlations are identified: β1-β2:α2-β4, α3-α4:α2-β4, β4-α3:α7-α8, β3-α2:Ω, α9-α10:β1-β2, β3-α2:β8-β9, α5-α6:α12, α1-β1:hinge-α11, α4-β5:β8-β9, β7:α11, and α11:α12.
Figure 5—figure supplement 2.
Figure 5—figure supplement 2.. Selected dynamic cross-correlation maps (DCCMs) computed for individual 5 ns nonequilibrium molecular dynamics (MD) trajectories of KPC-2.
These individual trajectories show different behavior from the averaged results (see Figure 5), as these trajectories show several regions of significant correlations similar to the TEM-1 nonequilibrium DCCM.
Figure 6.
Figure 6.. Variant positions in (a, b) TEM-1 and (c) KPC-2 mapped onto the averaged ApoEQ structures, also showing allosteric communication pathways (see Figure 4) identified by nonequilibrium simulations.
The position of the variant is shown as yellow spheres centered at the corresponding Cα. Only the sites of mutations that lie on the allosteric communication pathways have been annotated. The color scheme and cartoon thickness of the rendered structures represents a snapshot of average Cα deviation between IBEQ and ApoNE. Many of these clinically important variant positions lie on the allosteric communication pathway: 45 of the 90 for TEM-1, 15 out of the 25 for KPC-2 single point variants lie on the pathways. This suggests that these variations affect the allosteric behavior of the enzymes.
Figure 6—figure supplement 1.
Figure 6—figure supplement 1.. Spatial position of M182 and A184 on TEM-1.
These residues (green spheres) are not on the communication pathway per se but are in close vicinity and surrounded by the Ω-loop, α7-α8 loop, β1-β2 loop, and α9-α10 loop, which are involved in the communication network.

Similar articles

Cited by

References

    1. Abraham MJ, Murtola T, Schulz R, Páll S, Smith JC, Hess B, Lindahl E. GROMACS: high performance molecular simulations through multi-level parallelism from laptops to supercomputers. SoftwareX. 2015;1-2:19–25. doi: 10.1016/j.softx.2015.06.001. - DOI
    1. Abreu B, Lopes EF, Oliveira ASF, Soares CM. F508del disturbs the dynamics of the nucleotide binding domains of CFTR before and after ATP hydrolysis. Proteins: Structure, Function, and Bioinformatics. 2020;88:113–126. doi: 10.1002/prot.25776. - DOI - PubMed
    1. Agarwal PK, Geist A, Gorin A. Protein dynamics and enzymatic catalysis: investigating the peptidyl-prolyl cis-trans isomerization activity of cyclophilin A. Biochemistry. 2004;43:10605–10618. doi: 10.1021/bi0495228. - DOI - PubMed
    1. Agarwal PK, Schultz C, Kalivretenos A, Ghosh B, Broedel SE. Engineering a Hyper-catalytic enzyme by photoactivated conformation modulation. The Journal of Physical Chemistry Letters. 2012;3:1142–1146. doi: 10.1021/jz201675m. - DOI
    1. Agarwal PK. A biophysical perspective on enzyme catalysis. Biochemistry. 2019;58:438–449. doi: 10.1021/acs.biochem.8b01004. - DOI - PMC - PubMed

Publication types

MeSH terms

Substances