. 2021 Mar 23:10:e60197.
doi: 10.7554/eLife.60197.

Effects of domestication on the gut microbiota parallel those of human industrialization

Affiliations

Effects of domestication on the gut microbiota parallel those of human industrialization

Aspen T Reese et al. Elife. .

Abstract

Domesticated animals experienced profound changes in diet, environment, and social interactions that likely shaped their gut microbiota and were potentially analogous to ecological changes experienced by humans during industrialization. Comparing the gut microbiota of wild and domesticated mammals plus chimpanzees and humans, we found a strong signal of domestication in overall gut microbial community composition and similar changes in composition with domestication and industrialization. Reciprocal diet switches within mouse and canid dyads demonstrated the critical role of diet in shaping the domesticated gut microbiota. Notably, we succeeded in recovering wild-like microbiota in domesticated mice through experimental colonization. Although fundamentally different processes, we conclude that domestication and industrialization have impacted the gut microbiota in related ways, likely through shared ecological change. Our findings highlight the utility, and limitations, of domesticated animal models for human research and the importance of studying wild animals and non-industrialized humans for interrogating signals of host-microbial coevolution.

Keywords: canid; domestication; ecology; evolutionary biology; gut microbiota; human; industrialization; mouse; rat.

Plain language summary

Living inside our gastrointestinal tracts is a large and diverse community of bacteria called the gut microbiota that plays an active role in basic body processes like metabolism and immunity. Much of our current understanding of the gut microbiota has come from laboratory animals like mice, which have very different gut bacteria to mice living in the wild. However, it was unclear whether this difference in microbes was due to domestication, and if it could also be seen in other domesticated-wild pairs, like pigs and wild boars or dogs and wolves. A few existing studies have compared the gut bacteria of two species in a domesticated-wild pair. But, studies of isolated pairs cannot distinguish which factors are responsible for altering the microbiota of domesticated animals. To overcome this barrier, Reese et al. sequenced microbial DNA taken from fecal samples of 18 species of wild and related domesticated mammals. The results showed that while domesticated animals have different sets of bacteria in their guts, leaving the wild has changed the gut microbiota of these diverse animals in similar ways. To explore what causes these shared patterns, Reese et al. swapped the diets of two domesticated-wild pairs: laboratory and wild mice, and dogs and wolves. They found this change in diet shifted the gut bacteria of the domesticated species to be more similar to that of their wild counterparts, and vice versa. This suggests that altered eating habits helped drive the changes domestication has had on the gut microbiota. To find out whether these differences also occur in humans, Reese et al. compared the gut microbes of chimpanzees with the microbiota of people living in different environments. The gut microbial communities of individuals from industrialized populations had more in common with those of domesticated animals than did the microbes found in chimpanzees or humans from non-industrialized populations. This suggests that industrialization and domestication have had similar effects on the gut microbiota, likely due to similar kinds of environmental change. Domesticated animals are critical for the economy and health, and understanding the central role gut microbes play in their biology could help improve their well-being. Given the parallels between domestication and industrialization, knowledge gained from animal pairs could also shed light on the human gut microbiota. In the future, these insights could help identify new ways to alter the gut microbiota to improve animal or human health.


Conflict of interest statement

AR, KC, CD, LS, MB, PC, RR, ME, RC No competing interests declared

Figures

Figure 1.
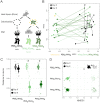
Figure 1.. The mammalian gut microbiota carries a global signature of domestication.
(A) Sampling scheme for cross-species study. (B) Nonmetric multidimensional scaling (NMDS) ordination of Bray–Curtis dissimilarities illustrates a significant signal (p<0.001, R2 = 0.15, F = 6.081, permutational MANOVA) of domestication (closed versus open circles; N = 82 domesticated and 99 wild) and clustering by host dyad (color; N = 5–20 individuals per species). (C) Distance to dyad (color) mean along Bray–Curtis ordination NMDS axis 1 differs by domestication status (p=0.006, Mann–Whitney U test). (D) Bray–Curtis dissimilarity between individuals is lowest among conspecifics, but wild–domesticated pairs also have lower dissimilarity than unrelated pairs (p<0.001, bootstrapped Mann-Whitney U tests). * indicates p<0.05. Large circles are means; bars show standard deviations.
Figure 1—figure supplement 1.
Figure 1—figure supplement 1.. Alternative factors associated with gut microbiota variation among wild and domesticated mammals.
Diet type (A), digestive physiology (B), and collection locale (C) are significantly associated (permutational MANOVAs) with variation in microbial community composition among wild and domesticated mammals, visualized here with nonmetric multidimensional scaling (NMDS) ordination of Bray–Curtis dissimilarity. Site abbreviations are as listed in 'Materials and methods'.
Figure 1—figure supplement 2.
Figure 1—figure supplement 2.. Microbial parameter comparisons between wild and domesticated mammals and between chimpanzees and humans.
Bray–Curtis nonmetric multidimensional scaling (NMDS) ordination shifts for domestication groups (A) and dyads (B), OTU richness (C), Shannon index (D), bacterial density (E), potential human pathogen (see Kembel et al., 2012; Reese et al., 2016) abundance (F), and potential pathogen richness (G) varied by domestication status for at least one domestication type (agriculture, companion, or laboratory) in our cross-species dataset. Trends often mirrored those seen in comparing US humans to wild chimpanzees. Among domesticated animals, dissimilarity from US humans (H) was greater for agricultural animals than for companion or laboratory animals. However, among wild animals, dissimilarity from US humans did not differ by type. * indicates p<0.05, • indicates p<0.10, Mann–Whitney U test. Large circles are means; bars show standard deviations.
Figure 1—figure supplement 3.
Figure 1—figure supplement 3.. Relatedness was correlated with ordination shifts but not dissimilarity within a dyad.
(A) The absolute value of shifts along nonmetric multidimensional scaling (NMDS) axis 1 for individuals relative to their dyad average was higher for dyads with a greater time since divergence (p=0.012, rho = 0.19, Spearman correlation). (B, C) Average Bray–Curtis dissimilarity between members of wild–domestic dyads was not correlated with time since divergence (p=0.380; B) or time since domestication (p=0.854; C). Large circles are means; bars show standard deviations.
Figure 1—figure supplement 4.
Figure 1—figure supplement 4.. Domestication explained few global gut microbial community characteristics in our cross-species dataset.
Potential pathogen richness (B) but not abundance (A) was significantly higher in wild animals. (C–E) Microbial density (quantified as copies of the 16S rRNA gene per gram feces [C]) and alpha-diversity metrics (Shannon index [D] and OTU richness [E]) did not vary consistently between wild and domesticated animals. Generally, greater differences were observed in comparisons between wild chimpanzees and a US human population. * indicates p<0.05, • indicates p<0.10, Mann–Whitney U test. Large circles are means; bars show standard deviations.
Figure 2.
Figure 2.. Gut microbial differences between wild and domesticated mice can be partially overcome by diet swap.
(A) Design scheme for fully factorial host taxon by diet mouse experiment (N = 10 laboratory mice or three wild mice per diet group). (B) Nonmetric multidimensional scaling (NMDS) ordination of Bray–Curtis dissimilarities showing changes for mice from day 0 (open circle) to day 28 (filled circle) by experimental groups (color). Composition varied by host taxon (p<0.001, R2 = 0.173, F = 64.255, permutational MANOVA), diet (p<0.001, R2 = 0.042, F = 15.427), and a host taxon by diet interaction (p<0.001, R2 = 0.020, F = 7.557). (C) Shannon index differed between host taxa on day 0 (p=0.011, Mann–Whitney U test). (D) Animals on reciprocal diets (DomH/WildD and WildH/DomD) but not control diets tended to move in opposite directions along Bray–Curtis ordination NMDS axis 1 from day 0 to day 28 (p=0.048 and p=0.25, respectively, one-sample Wilcoxon test). (E) At the end of the experiment, distance to the mean of the diet control at baseline (DomH/DomD and WildH/WildD) was lower for wild mice than for laboratory mice (p=0.048, Mann–Whitney U test). * indicates p<0.05, Mann–Whitney U test. Large circles are means; bars show standard deviations.
Figure 2—figure supplement 1.
Figure 2—figure supplement 1.. Microbiota composition at all time points during the mouse diet swap experiment.
Nonmetric multidimensional scaling (NMDS) ordination of all time points illustrates significant effects (permutational MANOVA tests) of host taxon and diet on Bray–Curtis dissimilarity.
Figure 2—figure supplement 2.
Figure 2—figure supplement 2.. Select microbial and host metabolic parameters under mouse diet swap.
(A) Shannon index by experimental groups over time.(B) OTU richness by experimental groups over time. (C) Microbial load by experimental groups over time. (D) Total fecal production over 1 week differs between experimental groups. (E) Calories remaining in feces as a function of total calories consumed varies by diet in DomH mice. * in (D) and (E) indicates p<0.05, Mann–Whitney U test. Large circles are means; bars show standard deviations.
Figure 3.
Figure 3.. Laboratory mice can be re-wilded through colonization with a wild gut microbial community.
(A) Design scheme for colonization/diet mouse experiment (N = 9–10 mice per treatment group). (B) Nonmetric multidimensional scaling (NMDS) ordination of Bray–Curtis dissimilarities showing changes for mice from day 0 (open circles) to day 8 (filled circles) by experimental groups (color). (C, D) At the end of the experiment (filled circle), distance to the wild community donor decreased most in animals colonized with wild communities (p=0.004 WildC/DomD and p=0.002 WildC/WildD, Mann–Whitney U test; C), but all experimental groups exhibited change along Bray–Curtis ordination NMDS axis 1 (p=0.002 PBSC/WildD, p=0.004 WildC/DomD, and p=0.002 WildC/WildD, one-sample Wilcoxon tests; D) during the course of the experiment. * in (C) indicates p<0.05, Mann–Whitney U test comparing day 0 to day 8 for each experimental group. Large circles are means; bars in (C) show standard deviations.
Figure 3—figure supplement 1.
Figure 3—figure supplement 1.. Select microbial and host metabolic parameters under wild colonization treatment.
(A) Nonmetric multidimensional scaling (NMDS) ordination of all time points illustrates significant effects (permutational MANOVA tests) of colonization and diet treatment on Bray–Curtis dissimilarity.(B) Microbial load by experimental groups over time. (C) Total fecal production over 1 week differs between experimental groups. (D) Shannon index by experimental groups over time. * indicates p<0.05, Kruskal–Wallis test. Large circles are means; bars show standard deviations.
Figure 4.
Figure 4.. Microbial differences between wild and domesticated canids can be partially overcome by diet shifts.
(A) Design scheme for fully factorial host taxon by diet canid experiment (N = 9 dogs or N = 10 wolves per diet group). (B) Nonmetric multidimensional scaling (NMDS) ordination of Bray–Curtis dissimilarities showing changes for canids from day 0 (open circle) to day 7 (filled circle) by experimental groups (color). Composition varied by host taxon (p<0.001, R2 = 0.098, F = 13.70, permutational MANOVA), diet (p<0.001, R2 = 0.058, F = 8.15), and a host taxon by diet interaction (p<0.001, R2 = 0.028, F = 3.93). (C) Shannon index differed between dogs and wolves on day 0 (p=0.003, Mann–Whitney U test). (D) Canids on reciprocal diets (DomH/WildD and WildH/DomD) but not control diets moved in opposite directions along Bray–Curtis ordination NMDS axis 1 over time (p=0.004 and 0.002, respectively, one-sample Wilcoxon tests). (E) At the end of the experiment, distance to the mean of diet controls at baseline (DomH/DomD and WildH/WildD) was lower for dogs than for wolves on reciprocal diets (p=0.001, Mann–Whitney U test). * indicates p<0.05, Mann–Whitney U test. Large circles are means; bars show standard deviations.
Figure 4—figure supplement 1.
Figure 4—figure supplement 1.. Microbiota composition at all time points during the canid diet swap experiment.
Nonmetric multidimensional scaling (NMDS) ordination of all time points illustrates significant effects (permutational MANOVA tests) of host taxon and diet on Bray–Curtis dissimilarity even after a single day.
Figure 4—figure supplement 2.
Figure 4—figure supplement 2.. Select microbial parameters under canid diet swap.
(A) Microbial loads of experimental groups over time.(B) Shannon index by experimental groups over time. (C) OTU richness differed between genotypes on day 0. * indicates p<0.05, Mann–Whitney U test. (D) OTU richness by experimental groups over time. (E) Change in OTU richness from day 0 to day 7 differed significantly from 0 in opposite directions for animals on altered diets (DomG/WildD and WildG/DomD). * indicates p<0.05, one-sample Wilcoxon test, and dashed line indicates a shift of 0. Large circles are means; bars show standard deviations.
Figure 5.
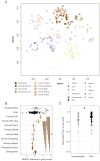
Figure 5.. Differences in gut microbial communities between industrialized humans and wild chimpanzees parallel those observed between domesticated and wild mammals.
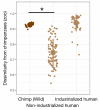
(A) Nonmetric multidimensional scaling (NMDS) ordination of Bray–Curtis dissimilarities in the gut microbiota illustrates that industrialized human populations (US and US Jha) exhibit similar trends relative to wild chimpanzees as domesticated animals do to wild animals, but that non-industrialized human populations (Hadza, Chepang, Raji, Raute, and Tharu) do not (N = 5–7 individuals per primate population and 5–20 individuals per other animal species). (B) Distance along the first Bray–Curtis ordination NMDS axis relative to group mean differs in the same direction for the two industrialized human populations relative to wild chimpanzees or non-industrialized human populations as for domesticated animals relative to wild animals (p<0.05, Mann–Whitney U tests, N = 7–99). (C) The gut microbial communities of wild animals are more dissimilar to those of industrialized humans than are those of domesticated animals (p<0.001, bootstrapped Mann–Whitney U test, N = 82 domesticated and 99 wild). * indicates p<0.05, Mann–Whitney U test. Large shapes are means; bars in (C) show standard deviations.
Figure 5—figure supplement 1.
Figure 5—figure supplement 1.. Trends in gut microbial taxa previously linked to differing human lifestyles.
Abundance of gut microbial taxa previously identified as distinguishing among human lifestyles (Smits et al., 2017) trended in similar directions between domesticated and wild animals as between industrialized humans and wild chimpanzees, except for the bacterial families Prevotellaceae and Spirochaetes. Human populations represented include the Hadza (Tanzanian hunter-gatherers), Chepang (Nepalese foragers), Raji (Nepalese foragers transitioning to subsistence farming), Raute (Nepalese foragers transitioning to subsistence farming), Tharu (Nepalese subsistence farmers), and Americans drawn from Jha et al., 2018 as well as Americans sampled and sequenced by our team. Large shapes are means; bars show standard deviations.
Figure 5—figure supplement 2.
Figure 5—figure supplement 2.. Dissimilarity in the gut microbiota among chimpanzees and humans.
Bray–Curtis dissimilarity among samples taken from captive zoo chimpanzees, wild chimpanzees, and human populations shows that the gut microbial communities of captive chimpanzees are more similar to those of non-industrialized humans, but not industrialized humans, than to those of wild chimpanzees. * indicates p<0.05, Bonferroni-corrected Mann–Whitney U test comparing to wild chimpanzees; all groups were statistically greater than zoo chimpanzees’ dissimilarity to other zoo chimpanzees. Large shapes are means; bars show standard deviations.
Author response image 1.
Author response image 2.

Comment in

  • Taming the beasts inside.
    Ryu EP, Davenport ER. Ryu EP, et al. Elife. 2021 Mar 23;10:e67634. doi: 10.7554/eLife.67634. Elife. 2021. PMID: 33755018 Free PMC article.

References

    1. Alberdi A, Aizpurua O, Bohmann K, Zepeda-Mendoza ML, Gilbert MTP. Do vertebrate gut metagenomes confer rapid ecological adaptation? Trends in Ecology & Evolution. 2016;31:689–699. doi: 10.1016/j.tree.2016.06.008. - DOI - PubMed
    1. Alessandri G, Milani C, Mancabelli L, Mangifesta M, Lugli GA, Viappiani A, Duranti S, Turroni F, Ossiprandi MC, van Sinderen D, Ventura M. Metagenomic dissection of the canine gut microbiota: insights into taxonomic, metabolic and nutritional features. Environmental Microbiology. 2019;21:1331–1343. doi: 10.1111/1462-2920.14540. - DOI - PubMed
    1. Allen JM, Mailing LJ, Niemiro GM, Moore R, Cook MD, White BA, Holscher HD, Woods JA. Exercise alters gut microbiota composition and function in lean and obese humans. Medicine & Science in Sports & Exercise. 2018;50:747–757. doi: 10.1249/MSS.0000000000001495. - DOI - PubMed
    1. Amato KR, Mallott EK, McDonald D, Dominy NJ, Goldberg T, Lambert JE, Swedell L, Metcalf JL, Gomez A, Britton GAO, Stumpf RM, Leigh SR, Knight R. Convergence of human and old world monkey gut microbiomes demonstrates the importance of human ecology over phylogeny. Genome Biology. 2019;20:201. doi: 10.1186/s13059-019-1807-z. - DOI - PMC - PubMed
    1. Antwis RE, Lea JMD, Unwin B, Shultz S. Gut microbiome composition is associated with spatial structuring and social interactions in semi-feral welsh mountain ponies. Microbiome. 2018;6:207. doi: 10.1186/s40168-018-0593-2. - DOI - PMC - PubMed

Publication types