. 2021 Sep 29;37(18):2938-2945.
doi: 10.1093/bioinformatics/btab194.

Probabilistic thermodynamic analysis of metabolic networks

Affiliations

Probabilistic thermodynamic analysis of metabolic networks

Mattia G Gollub et al. Bioinformatics. .

Abstract

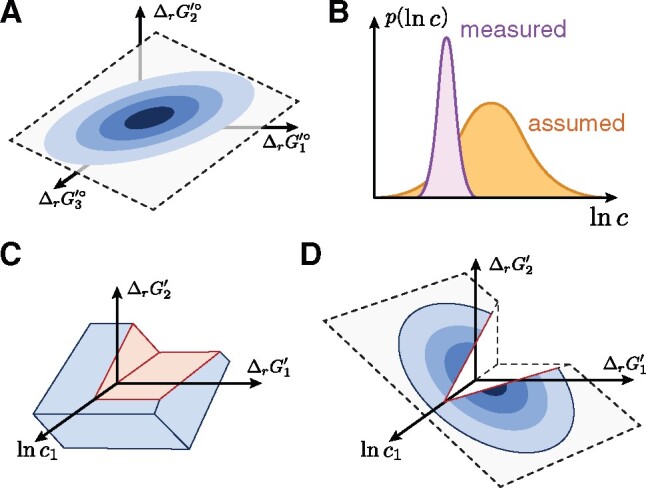
Motivation: Random sampling of metabolic fluxes can provide a comprehensive description of the capabilities of a metabolic network. However, current sampling approaches do not model thermodynamics explicitly, leading to inaccurate predictions of an organism's potential or actual metabolic operations.

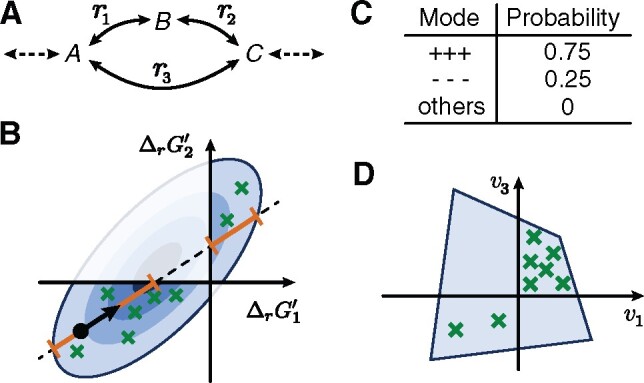
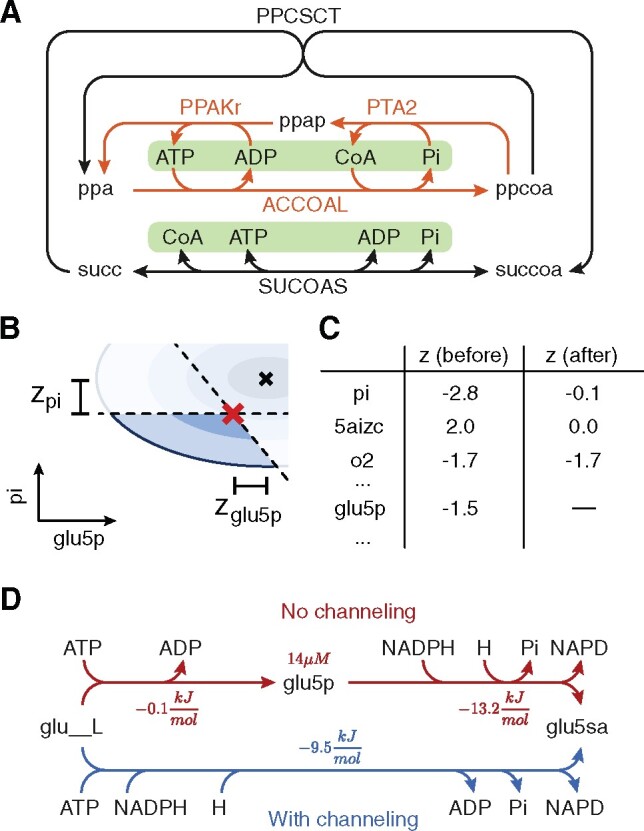
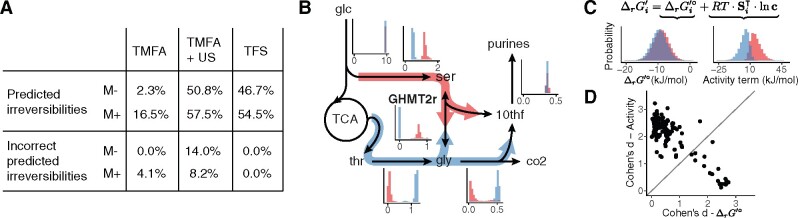
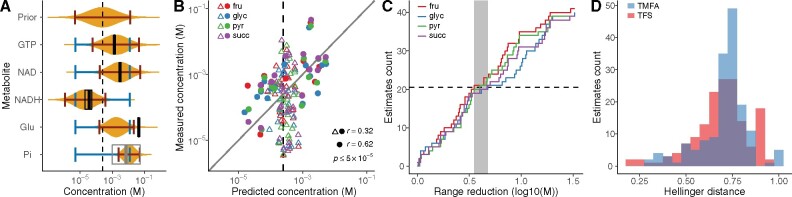
Results: We present a probabilistic framework combining thermodynamic quantities with steady-state flux constraints to analyze the properties of a metabolic network. It includes methods for probabilistic metabolic optimization and for joint sampling of thermodynamic and flux spaces. Applied to a model of Escherichia coli, we use the methods to reveal known and novel mechanisms of substrate channeling, and to accurately predict reaction directions and metabolite concentrations. Interestingly, predicted flux distributions are multimodal, leading to discrete hypotheses on E.coli's metabolic capabilities.

Availability and implementation: Python and MATLAB packages available at https://gitlab.com/csb.ethz/pta.

Supplementary information: Supplementary data are available at Bioinformatics online.


Figures

Fig. 1.
Fig. 1.
Integration of thermodynamics in CBMs. (A) Group contribution methods provide estimates of standard reaction energies. The uncertainties of multiple estimates may be correlated and lie in a lower dimensional subspace. (B) Probability distributions of metabolite concentrations can be constructed from measured or assumed data. (C) The space of reaction energies and metabolite concentrations defined by TMFA, with regions that are not feasible at steady-state removed (red). The space is defined by independent bounds on each variable of ln c and ΔrG°, leading to an overapproximation of the uncertainty. (D) PTA models the complete uncertainty information probabilistically, leading to a joint probability distribution over the reaction energies of the entire network. Steady-state flux constraints restrict it to feasible orthants
Fig. 2.
Fig. 2.
Overview of TFS. (A) Example network, where left-to-right fluxes are positive. At steady state v2 = v1 and ΔrG3=ΔrG1+ΔrG2. (B) We sample the thermodynamic space using a modified Hit-and-Run algorithm. At each step, we limit sampling to portions of the space that allow steady-state flux distributions (orange). (C) As a result, we estimate the probability of each mode. (D) Finally, we sample the flux space drawing from each mode a number of samples proportional to its probability
Fig. 3.
Fig. 3.
Thermodynamic assessment of iML1515-CAN. (A) Forced internal cycle in propionate metabolism (orange). The irreversibility of ACCOAL conflicts with the direction of phosphate acetyltransferase (PTA2) and propionate kinase (PPAKr). Moreover, due to the direction of PPCSCT and a shared pool of cofactors (green), it also incorrectly implies that conversion of succinyl-CoA to succinate in the TCA by succinyl-CoA synthetase (SUCOAS) is unfavorable. (B) After using PMO to find t* (red cross), we compute the z-scores of each metabolite and metabolites, i.e. the normalized distance from the mean (black cross). (C) Metabolites with high z-score (‘before’) are selected. After literature search, 29 out of the 36 flagged by the analysis led to improvements in the model, as shown by smaller z-scores in the curated model (‘after’). (D) A symptomatic case suggesting substrate channeling. An unfavorable reaction produces an intermediate (glutamate-5-phosphate) that must have low concentration to maintain thermodynamic feasibility and is followed by a favorable reaction. The total reaction energies with and without channeling are not identical because the estimated concentrations differ
Fig. 4.
Fig. 4.
Reaction directions and fluxes. (A) Precision and accuracy of predicting directionalities with different methods. Predicted irreversibilities are given as percentage of the average number of reversible reactions in the different conditions. The percentage of incorrectly predicted irreversibilities is relative to the average number of fluxes that are reversible in the models and have 13C estimates. (B) Example of multimodal predictions of fluxes with TFS for the synthesis of purines and glycine. Orange: serine is converted to glycine, donating one carbon to form 10-formyltetrahydrofolate (10thf), a cofactor for purine synthesis. Blue: glycine is synthesized from threonine and is converted to CO2 and 10thf. Histograms show predicted flux distributions, clustered by the direction of GHMT2r. (C) Distribution of ΔrG° (left) and the activity term (right) of GHMT2r, clustered by the direction of the reaction. Si is the i-th row of SΓ. (D) Cohen’s d for the distributions of the standard reaction energies and of the activity terms in the two clusters for all reactions in Γ
Fig. 5.
Fig. 5.
Metabolite concentrations. (A) Examples of distributions predicted by TFS (orange), the respective 95% confidence intervals (red), ranges predicted by TMFA (blue) and mean and 95% confidence intervals of the metabolomics measurements (black, range from literature in gray). (B) Mean concentrations predicted by TFS agree with measured values (Pearson’s r =0.32, Root Mean Square Error RMSE =0.87 in log10 scale). Reducing the coverage to metabolites with a KL between prior and posterior distribution above 0.2 (full circles) increases the agreement to r =0.63, RMSE =0.72. (C) Cumulative distribution of the reduction in the width of the predicted interval of TFS over TMFA for the validated metabolites. (D) Hellinger distances between the distribution of the predicted and measured metabolite concentrations for TMFA and TFS

References

    1. Abernathy M.H. et al. (2019) Comparative studies of glycolytic pathways and channeling under in vitro and in vivo modes. AIChE J., 65, 483–490.
    1. Bélisle C.J. et al. (1993) Hit-and-run algorithms for generating multivariate distributions. Math. Oper. Res., 18, 255–266.
    1. Binns M. et al. (2015) Sampling with poling-based flux balance analysis: optimal versus sub-optimal flux space analysis of actinobacillus succinogenes. BMC Bioinformatics, 16, 49. - PMC - PubMed
    1. Chiappino-Pepe A. et al. (2017) Bioenergetics-based modeling of plasmodium falciparum metabolism reveals its essential genes, nutritional requirements, and thermodynamic bottlenecks. PLoS Comput. Biol., 13, e1005397. - PMC - PubMed
    1. Desouki A.A. et al. (2015) Cyclefreeflux: efficient removal of thermodynamically infeasible loops from flux distributions. Bioinformatics, 31, 2159–2165. - PubMed

Publication types