

PTENε suppresses tumor metastasis through regulation of filopodia formation
- PMID: 33755220
- PMCID: PMC8126949
- DOI: 10.15252/embj.2020105806
PTENε suppresses tumor metastasis through regulation of filopodia formation
Abstract
PTEN is one of the most frequently mutated genes in malignancies and acts as a powerful tumor suppressor. Tumorigenesis is involved in multiple and complex processes including initiation, invasion, and metastasis. The complexity of PTEN function is partially attributed to PTEN family members such as PTENα and PTENβ. Here, we report the identification of PTENε (also named as PTEN5), a novel N-terminal-extended PTEN isoform that suppresses tumor invasion and metastasis. We show that the translation of PTENε/PTEN5 is initiated from the CUG816 codon within the 5'UTR region of PTEN mRNA. PTENε/PTEN5 mainly localizes in the cell membrane and physically associates with and dephosphorylates VASP and ACTR2, which govern filopodia formation and cell motility. We found that endogenous depletion of PTENε/PTEN5 promotes filopodia formation and enhances the metastasis capacity of tumor cells. Overall, we identify a new isoform of PTEN with distinct subcellular localization and molecular function compared to the known members of the PTEN family. These findings advance our current understanding of the importance and diversity of PTEN functions.
Keywords: PTEN5; PTENε; alternative initiation; filopodia formation; metastasis.
© 2021 The Authors. Published under the terms of the CC BY NC ND 4.0 license.
Conflict of interest statement
The authors declare that they have no conflict of interest.
Figures
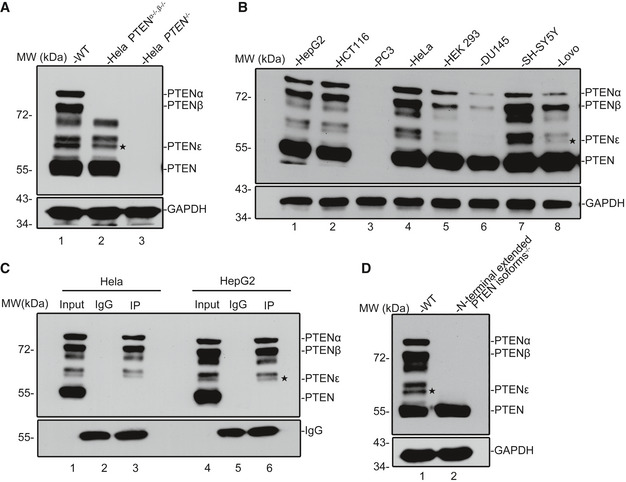
Western blot of PTEN variants in WT (lane 1), PTENα−/−, β−/− (lane 2), and PTEN −/− (lane 3) Hela cells with a polyclonal antibody against full‐length PTEN. Except for PTENα, PTENβ, and canonical PTEN, immunoblotting revealed four additional bands with molecular weights lower than PTENβ in WT and PTEN α−/−, β−/− Hela cells. Hela PTEN −/− cells have no expression of PTEN variants or canonical PTEN. The asterisks shown here and in other immunoblot images throughout this manuscript indicate the corresponding protein band of PTENε.
Western blot of PTEN variants in a panel of human cancer cell lines using a rabbit monoclonal antibody against the C‐terminal region of PTEN (Cell Signaling Technology, 138G6). The PTEN‐null prostate cancer cell line PC3 was used as a negative control.
Immunoprecipitation of PTEN variants with a homemade PTENα antibody before immunoblotting with a PTEN monoclonal antibody in Hela and HepG2 cells (Cell Signaling Technology, 138G6).
Western blot of PTEN variants in WT (lane 1) and N‐terminal extended PTEN isoforms−/− (lane 2) Hela cells with a PTEN monoclonal antibody (Cell Signaling Technology, 138G6).
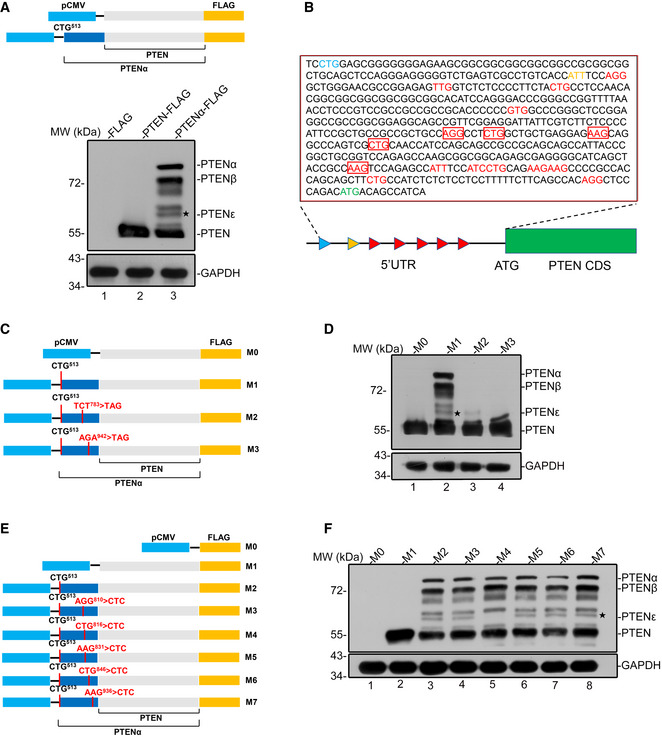
A pcDNA3.1 plasmid containing PTENα or canonical PTEN with a C‐terminal FLAG tag was used for the detection of PTENα, PTENβ, canonical PTEN, and other unknown PTEN isoforms (upper panel); indicated plasmids in the upper panel were transfected into HEK293 cells followed by Western blotting analysis using FLAG antibody. GAPDH was used as a control (lower panel).
The sequence of the 5′ UTR region of Homo sapiens PTEN mRNA. The codons that differ from AUG by only one nucleotide are highlighted in red. The initiation codons of PTENα, PTENβ, and canonical PTEN are separately highlighted in blue, yellow, and green. The potential initiation codons of PTENε are highlighted in red boxes.
A different set of PTEN and PTENα constructs with a C‐terminal FLAG tag, in which one of two sites (UCU783 or AGA942) was mutated to a UAG stop codon.
Mutation of AGA942 into UAG eliminates PTENε expression, while the UCU783 > UAG mutation has no such effect. C‐terminal FLAG‐tagged PTENα expression plasmids with and without UCU783 > UAG or AGA942 > UAG mutation as indicated in (C) were introduced into HEK293 cells separately, followed by immunoblotting with FLAG and GAPDH antibodies.
A different set of PTENα constructs with a C‐terminal FLAG tag, in which one of the non‐AUG initiation codons between UCU783 and AGA942 (AGG810, CUG816, AAG831, CUG846, AAG936) was mutated to the CUC codon.
Mutation of CUG816 but not any other potential non‐AUG initiation codon eliminates PTENε expression. C‐terminal FLAG‐tagged PTENα expression plasmids with or without mutations as indicated in (E) were introduced into HEK293 cells separately, followed by immunoblotting with FLAG and GAPDH antibodies.
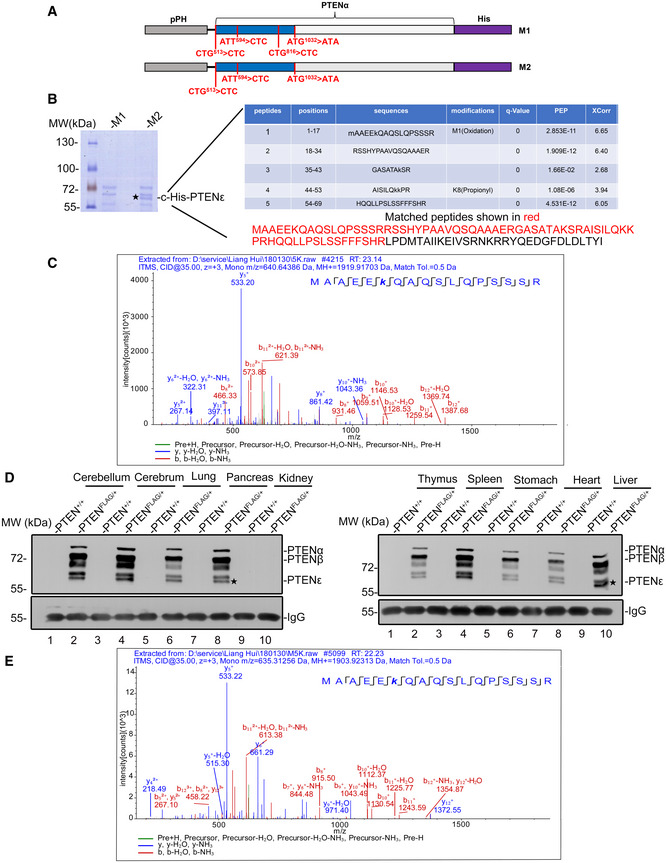
Two pFastBac1 plasmids containing PTENα with a C‐terminal His‐tag with or without CUG816 > CUC mutation was used for in vitro purification and mass spectrometry sequencing. The initiation codon of canonical PTEN (AUG1032) was mutated to AUA and the initiation codons of PTENα (CUG513) and PTENβ (AUU594) were mutated to CUC to avoid co‐purification of PTEN, PTENα, and PTENβ with PTENε.
His‐selected affinity purification of PTENε. Sf9‐expressed His‐PTENε was purified using nickel affinity chromatography. Combined fractions were separated by SDS–PAGE. The protein band ranked third by molecular weight in the M2 lane can be eliminated by the CUG816 > CUC mutation (M1 lane vs. M2 lane), indicating it is PTENε. Mass spectrometry analysis of the band of PTENε protein revealed five segments of peptide that match the N‐terminal extended sequence of PTENε, including the most proximal N‐terminal peptide of PTENε, MAAEEKQAQSLQPSSSR.
The MS/MS spectrum of the peptide (MAAEEKQAQSLQPSSSR) that matches the N‐terminal sequence of PTENε.
Verification of expression of FLAG‐tagged PTENα, PTENβ, and PTENε in PtenFLAG knock‐in mice. Various tissues from PtenFLAG knock‐in mice or control wild‐type mice were lysed for immunoprecipitation with anti‐FLAG M2 magnetic beads before being immunoblotted with the anti‐PTENα antibody raised in our laboratory.
The MS/MS spectrum of the peptide (MAAEEKQAQSLQPSSSR) of endogenous PTENε in mice that matches the N‐terminal sequence of PTENε. Protein lysates of PtenFLAG knock‐in liver tissues were subjected to immunoprecipitation with anti‐FLAG M2 agarose. The bound proteins were separated with SDS–PAGE, and gel slices of the band ranked fifth by molecular weight were analyzed by mass spectrometry.
- A
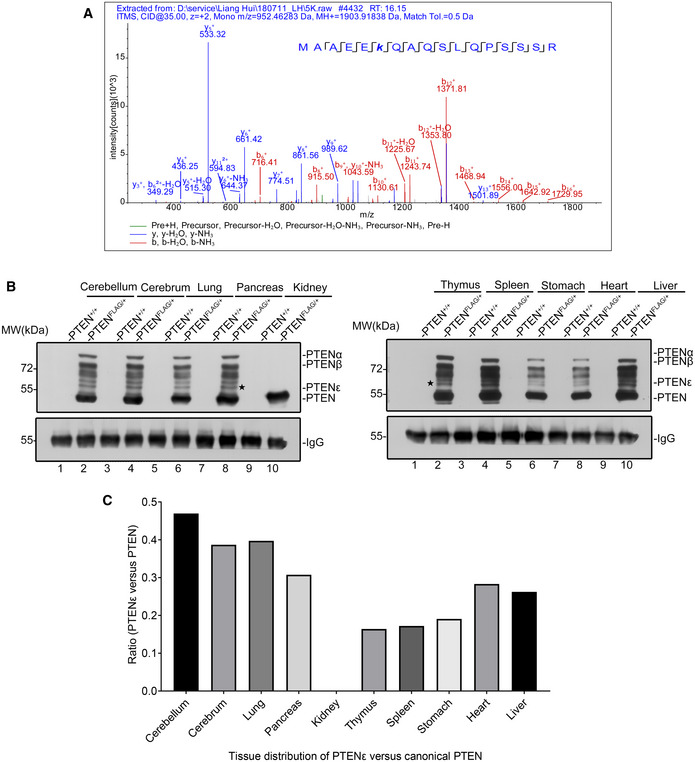
The MS/MS spectrum of the peptide (MAAEEKQAQSLQPSSSR) of endogenous PTENε in Hela cells that matches the most N‐terminal sequence of PTENε. Protein lysates of Hela cells were subjected to sequential immunoprecipitation with the anti‐PTENα antibody. The bound proteins were separated with SDS–PAGE, and gel slices of the band ranked fifth by molecular weight were analyzed by mass spectrometry.
- B, C
Detection of the relative expression of PTEN isoforms vs. canonical PTEN in PtenFLAG knock‐in mice. Various tissues from PtenFLAG knock‐in mice or control wild‐type mice were lysed for immunoprecipitation with the anti‐FLAG M2 magnetic beads before immunoblotting with the anti‐PTEN antibody (B). The protein level of canonical PTEN and PTENε was measured by evaluating the gray value of corresponding protein bands in each panel (C).
- A
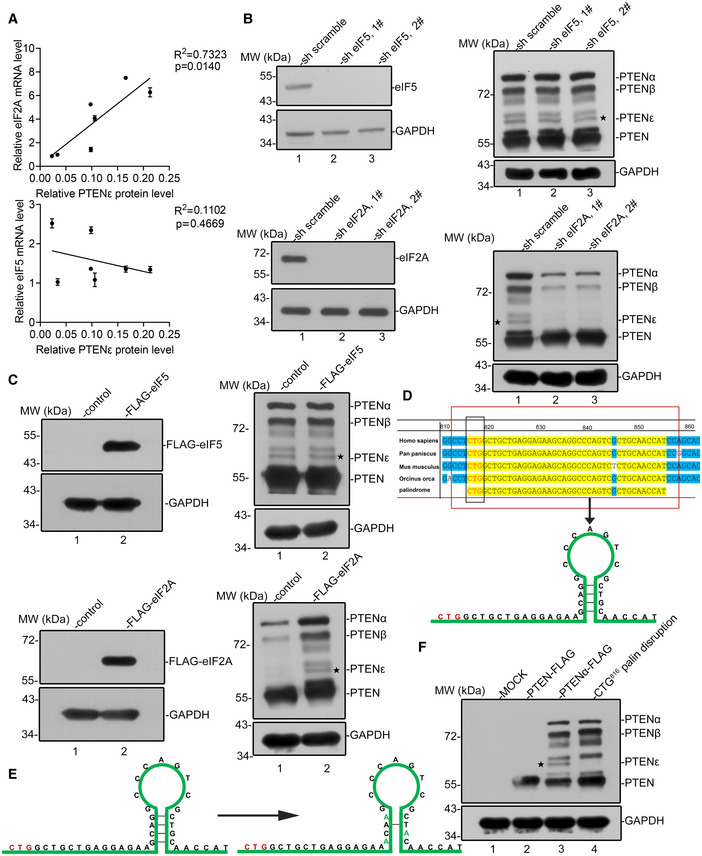
Correlation analysis of PTENε protein level with eIF2A or eIF5 mRNA level. The mRNA level of eIF2A and eIF5 in cell lines as listed in Fig 1B was measured by RT–PCR. PTENε protein level in cell lines listed in Fig 1B was measured by evaluating the gray value of corresponding protein bands. PTENε protein level is positively correlated with the eIF2A mRNA level (P < 0.05), while it has no significant correlation with the eIF5 mRNA level (P > 0.05). The Pearson correlation test was employed to analysis the correlation between PTENε and eIF2A or eIF5, and data are presented as the mean ± SD based on three independent experiments.
- B
Reduction of PTENε in response to eIF2A knockdown. Hela cells were infected with lentivirus expressing eIF2A shRNA, eIF5 shRNA, or scramble shRNA separately. The knockdown of eIF2A or eIF5 was validated by Western blot (left panel). Lysates of Hela cells were collected and subjected to Western blot analysis with antibodies against PTEN and GAPDH (right panel).
- C
Overexpression of eIF2A induces the relative expression of PTENε. FLAG‐tagged eIF2A or eIF5 were overexpressed in DU145 cells before Western blot analysis of PTENε expression with an antibody against PTEN. GAPDH was used as a loading control.
- D
A palindromic motif 14 bp downstream CUG816 in the 5′UTR of PTEN is evolutionarily conserved. (upper panel) Phylogenetic analysis of the 5′UTR of PTEN mRNA in bonobo (Pan paniscus), killer whale (Orcinus orca), and mouse (Mus musculus). The CUG816 initiation codon of PTENε is highlighted in a blue box, and the 14 bp downstream palindromic sequence is highlighted in a red box. The putative hairpin structure shown in the lower panel was predicted by the Mfold web server.
- E, F
Abolition of PTENε expression by disruption of the palindromic motif. (E) Disruption of the CUG816 downstream palindromic motif by mutagenesis. C‐terminal FLAG‐tagged PTENε expression plasmids with or without disruption of the palindromic motif were introduced into HEK293 cells, followed by immunoblotting with FLAG and GAPDH antibodies (F).
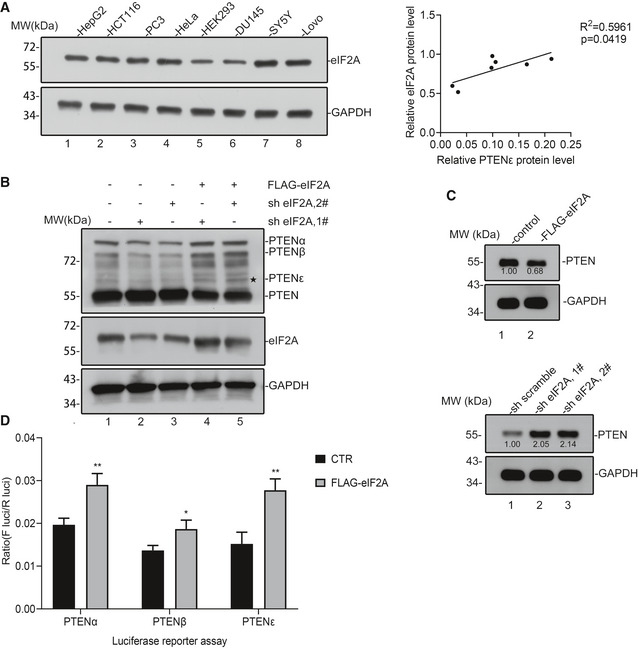
Correlation analysis of PTENε protein with endogenous eIF2A protein. The eIF2A protein level in cell lines as listed in Fig 1B was measured by evaluating the gray value of relevant protein bands. Pearson’s correlation test was utilized to perform the correlation analysis between endogenous eIF2A and PTENε through the GraphPad Prism 8 software.
Reduced expression of PTENε in eIF2A knockdown Hela cells was rescued by eIF2A reintroduction. Wild‐type FLAG‐eIF2A was reintroduced into eIF2A knockdown cells used in Fig 4B, and the lysates of these Hela cells were collected and subjected to Western blot analysis with antibodies against PTEN, eIF2A, and GAPDH.
The influence of eIF2A alteration on canonical PTEN expression. The relative expression of canonical PTEN in eIF2A overexpression or knockdown cells was quantified by Western blot. PTEN protein level in the aforementioned cells was measured by evaluating the gray value of corresponding protein bands. GAPDH was used as the negative control.
Luciferase reporter activity driven by PTEN variants after eIF2A overexpression. HEK293 cells were co‐transfected with pCMV‐tag2b‐eIF2A or pCMV‐basic plasmid and Luc2‐IRES‐Report plasmids (GS0112, GENESEED Biotech Co.) carrying the specific N‐terminal extended nucleotide of corresponding PTEN isoforms compared with canonical PTEN. Luciferase activity was measured 24 h after transfection. All data are presented as mean ± SD of three independent experiments and were analyzed with the unpaired t‐test. *P < 0.05; **P < 0.01.
- A
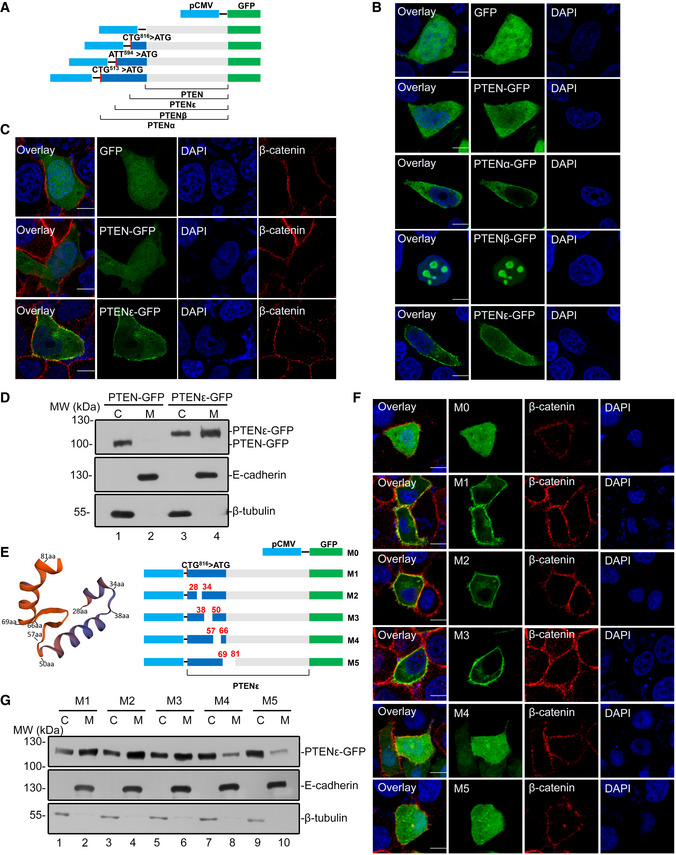
A set of different constructs of PTEN, PTENα, PTENβ, and PTENε with a C‐terminal GFP tag. The AUG start codon of canonical PTEN was mutated to AUA in PTENα, PTENβ, and PTENε constructs to abolish the expression of canonical PTEN and the corresponding start site of these PTEN isoforms was mutated into AUG to enhance their expression.
- B
Subcellular localization of C‐terminal GFP‐tagged PTENα, PTENβ, PTENε, and PTEN. The constructs indicated in the data (A) were introduced into Hela PTEN −/− cells. Thirty‐six hours after transfection, cells were stained with DAPI, followed by imaging with confocal microscopy. The scale bars represent 5 μm.
- C
The transfected Hela PTEN −/− cells in (B) were stained with an anti‐β‐catenin antibody and DAPI before being imaged with confocal microscopy. The scale bars represent 5 μm.
- D
HEK293 cells were transfected with C‐terminal GFP‐tagged PTEN and PTENε and subjected to cell fractionation, followed by Western blotting with GFP, E‐cadherin, and β‐tubulin antibodies. C: cytoplasm. M: cell plasma membrane.
- E
Prediction of N‐terminal structure of PTENε by SWISS‐MODEL (left panel); a different set of C‐terminal GFP‐tagged PTENε plasmids with or without fragment deletion in PTENε N‐terminal sequence were constructed.
- F, G
To determine the sequences that are critical for the membrane localization of PTENε. Hela and HEK293 cells were transfected with constructs indicated in (E). Thirty‐six hours after transfection, transfected Hela cells were stained with anti‐β‐catenin antibody and DAPI, followed by imaging with confocal microscopy. The scale bars represent 5 μm (F). The transfected HEK293 cells were conducted with cell fractionation before Western blotting with GFP, E‐cadherin, and β‐tubulin antibodies (G). C: cytoplasm. M: cell plasma membrane.
- A
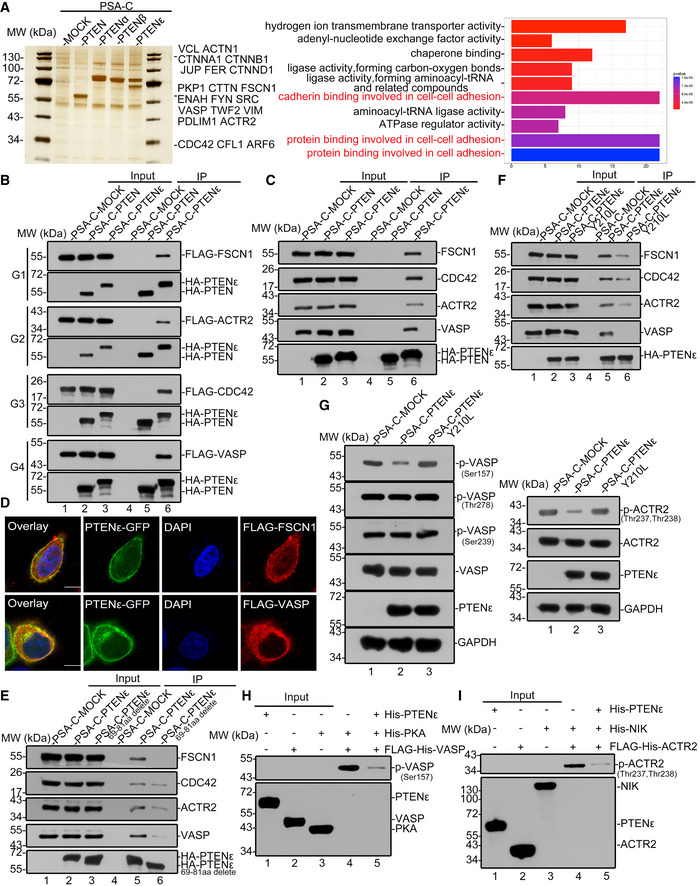
In vivo S‐tag‐PTENε pull‐down analysis. Whole‐cell extracts from HEK293 cells transfected with S‐tag‐PTENε were immunoprecipitated with S‐protein beads followed by mass spectrometric peptide sequencing. S‐tagged‐PTEN, S‐tagged‐PTENα, S‐tagged‐PTENβ, or mock construct were introduced into HEK293 cells separately, and the transfected cells were treated in the same way as described above. Cell adhesion associated protein was found in the PTENε pull‐down list (left panel). Molecular function analysis of PTENε interacting proteins compared with canonical PTEN, PTENα, PTENβ, and MOCK groups (right panel, statistical significance was determined by Fisher’s exact test.). Mass spectrometry analysis data (as indicated in Figs 3C and E, and EV1A, and 6A) are available via ProteomeXchange with identifier PXD022245.
- B
Exogenous immunoprecipitation of PTENε with FLAG‐tagged CDC42, ACTR2, VASP, and FSCN1. The plasmid expressing PTEN, PTENε, or mock carrying C‐terminal S‐tag and HA tag was co‐transfected with FLAG‐tagged CDC42, ACTR2, VASP, or FSCN1 plasmid in HEK293 cells separately. Cell lysates were incubated with S‐protein agarose followed by Western blotting with antibodies against the FLAG tag and HA tag. G1–4 stand for immunoprecipitation group 1–4.
- C
Immunoprecipitation of PTENε with endogenous CDC42, ACTR2, VASP, and FSCN1. The plasmid expressing PTEN, PTENε, or mock plasmid carrying C‐terminal S‐tag and HA tag was transfected in HEK293 cells separately. Cell lysates were incubated with S‐protein agarose followed by Western blotting with antibodies against CDC42, VASP, ACTR2, FSCN1, and HA tag.
- D
Images of immunofluorescence staining for PTENε and its interacting proteins (VASP and FSCN1). Hela PTEN −/− cells were co‐transfected by a plasmid expressing C‐terminal GFP‐tagged PTENε with FLAG‐tagged targets (FSCN1, VASP) separately, followed by staining with an anti‐FLAG antibody and DAPI, and were imaged by confocal microscopy. The scale bars represent 5 μm.
- E
The cell plasma membrane localization of PTENε is required for its interaction with downstream targets. FLAG‐tagged CDC42, VASP, ACTR2, or FSCN1 plasmid was co‐transfected with a plasmid expressing PTENε with or without 69–81aa deletion carrying C‐terminal S‐tag and HA tag in HEK293 cells. Cell lysates were incubated with S‐protein agarose before Western blotting with antibodies against the FLAG tag and HA tag.
- F
PTENε protein phosphatase activity is required for its interaction with CDC42, FSCN1, VASP, and ACTR2. Wild‐type PTENε and PTENε with protein phosphatase activity abolished mutation (Y210L, analogous to PTEN (Y138L)) were separately co‐transfected with FLAG‐tagged targets (CDC42, FSCN1, ACTR2 or VASP) in HEK293 cells. Cell lysates were incubated with S‐protein agarose followed by Western blotting with antibodies against the FLAG tag and HA tag.
- G
The level of phospho‐VASP and phospho‐ACTR2 in PTENε overexpressed Hela cells. Wild‐type PTENε and PTENε with protein phosphatase activity abolished mutation (Y210L, analogous to PTEN (Y138L)) carrying C‐terminal S‐tag and HA tag were introduced into Hela PTEN −/− cells, followed by immunoblotting with antibodies against p‐ACTR2 (Thr237 and Thr238), p‐VASP(Ser157), p‐VASP (Ser239), p‐VASP (Thr278), VASP, ACTR2, GAPDH, and HA tag.
- H, I
Purified ACTR2 or VASP was phosphorylated in vitro by NIK or PKA and subsequently used in a phosphatase assay with His‐PTENε or without purified PTENε protein as a control, followed by immunoblotting with antibodies against p‐ACTR2 (Thr237 and Thr238) and p‐VASP (Ser157). Purified proteins (PTENε, PKA, NIK, ACTR2, and VASP) were detected by anti‐His antibody (ZSGB‐BIO, TA‐02).
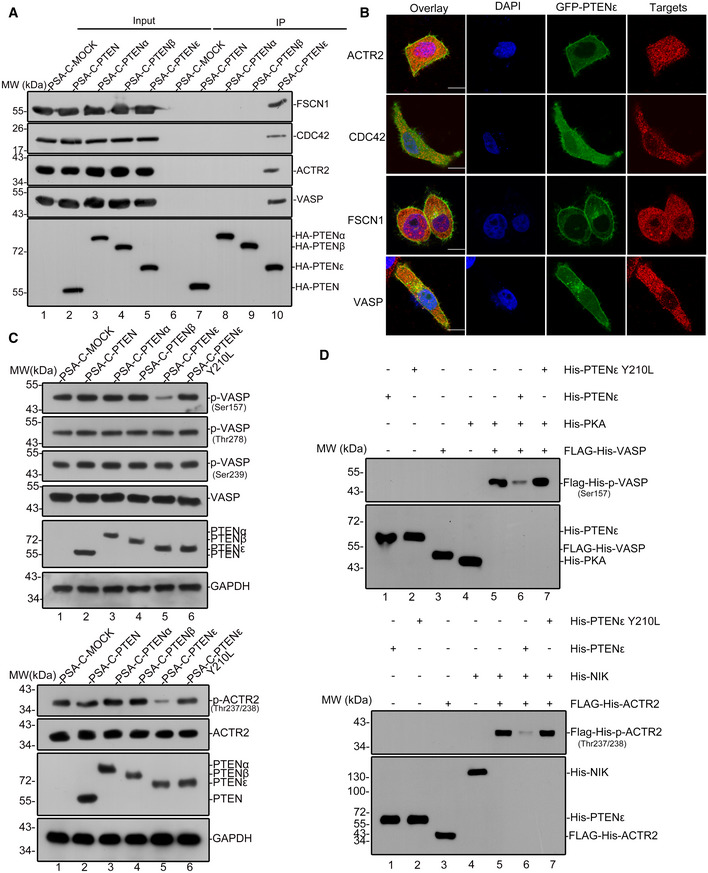
PTENε, but not other known PTEN isoforms, interacts with filopodia formation‐related proteins. HEK293 cells were transfected with C‐terminal HA and S‐tagged PTEN, PTENα, PTENβ, PTENε, or mock plasmid separately, followed by immunoprecipitation with S‐protein beads and Western blotting with antibodies against CDC42, VASP, ACTR2, or FSCN1, and HA, respectively.
Images of immunofluorescence staining for PTENε and endogenous interacting proteins (VASP, FSCN1, CDC42, and ACTR2). C‐terminal GFP‐tagged PTENε was introduced into Hela PTEN −/− cells. Then, these transfected cells were seeded on coverslips and sequentially stained with monoclonal antibodies (Santa Cruz, sc‐8401(CDC42), sc‐21743(FSCN1), sc‐166103(ACTR2), and Cell Signaling Technology, 3132(VASP)) and DAPI separately. Then, all the coverslips were imaged by confocal microscopy. The scale bars represent 5 μm.
Overexpression of PTENε, but not other PTEN variants, reduces the endogenous phosphorylation of ACTR2 (lower panel) and VASP (upper panel). HA and S‐tagged canonical PTEN, PTENα, PTENβ, PTENε, and PTENε Y210L were introduced into Hela PTEN −/− cells, followed by immunoblotting with antibodies against p‐ACTR2 (Thr237 and Thr238), p‐VASP(Ser157), p‐VASP (Ser239), p‐VASP (Thr278), VASP, ACTR2, GAPDH, and HA tag.
Purified ACTR2 or VASP was phosphorylated in vitro by NIK or PKA and subsequently used in a phosphatase assay with wild‐type His‐PTENε, protein phosphatase‐deficient His‐PTENε Y210L or without purified PTENε protein as a control, followed by immunoblotting with antibodies against p‐ACTR2 (Thr237 and Thr238, lower panel) and p‐VASP (Ser157, upper panel). Purified proteins (PTENε, PTENε Y210L, PKA, NIK, ACTR2, and VASP) were detected by anti‐His antibody (ZSGB‐BIO, TA‐02).
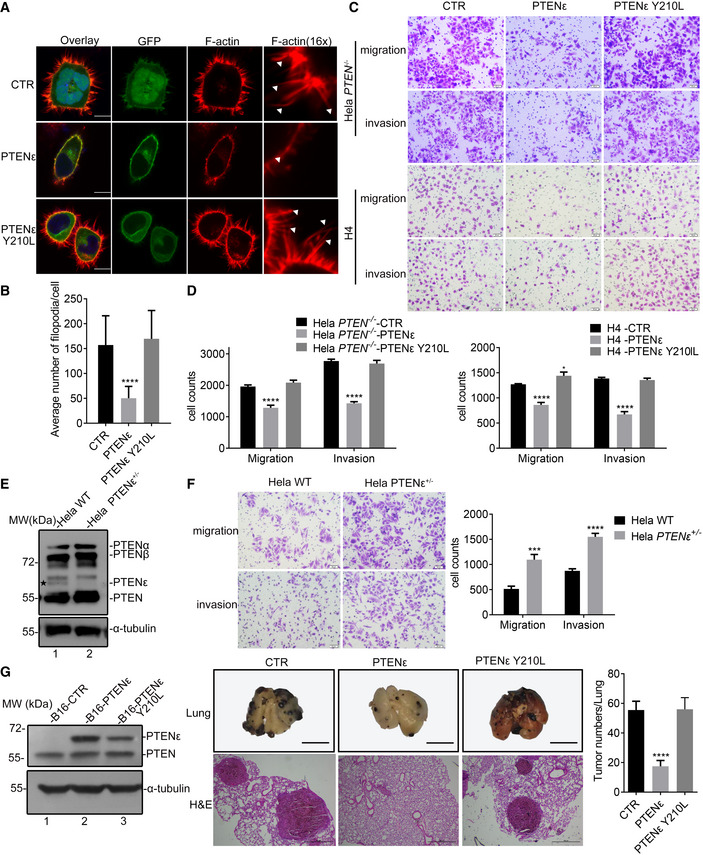
Immunofluorescence staining of F‐actin in PTENε or PTENε Y210L overexpressed Hela PTEN −/− cells and control cells. PTENε‐GFP, PTENε Y210L‐GFP, or mock construct was introduced into HeLa PTEN −/− cells, respectively. The transfected cells were stained with Phalloidin and DAPI before being imaged with confocal microscopy. The scale bars represent 5 μm (left panel). White arrows shown in the magnified immunofluorescence images indicate the filopodia in the cell membrane.
Quantification of the number of filopodia per cell by FiloQuant software and the data are presented as mean ± SD of three independent experiments and were analyzed with the unpaired t‐test. ****P < 0.0001.
Representative images of transwell migration and invasion assays in Hela PTEN −/− cells and H4 cells stably transfected with PTENε, PTENε Y210L, or an empty control (magnification, 200×). The scale bars represent 50 μm.
Statistical analysis of transwell migration and invasion assays in Hela PTEN −/− cells and H4 cells stably transfected with PTENε, PTENε Y210L, or an empty control (magnification, 100×; five random per well). Data are presented as the mean ± SEM based on three independent experiments and were analyzed with the unpaired t‐test. *P < 0.05. ****P < 0.0001.
Adenine base editing‐mediated endogenous PTENε knockout in Hela cells. Immunoblotting analyses were used to verify the level of PTENε loss in Hela cells.
Representative images of transwell migration and invasion assays in Hela PTENε+/− cells at 200× magnification (left panel, the scale bars represent 50 μm). (right panel) Migrated or invaded cells were counted at five random fields at 100× magnification per well to assess cell migration and invasion ability. Data are presented as the mean ± SEM based on three independent experiments and were analyzed with the unpaired t‐test. ***P < 0.001; ****P < 0.0001.
Left panel: Immunoblotting analyses were used to verify the level of overexpressed PTENε or PTENε Y210L in B16 cells. Middle panel: Representative images showing the lung metastasis of PTENε or PTENε Y210L overexpressed B16 cells or control cells in the mouse pulmonary metastasis model (n = 4). H & E, hematoxylin–eosin staining. The scale bars represent 600 mm (upper panel) and 500 μm (lower panel) separately. Right panel: The representative bar graphs showing the quantification of tumor metastatic ability was displayed by measuring the number of tumor nodules (data are presented as mean ± SD based on three independent replicates). The overexpression of PTENε attenuated tumor metastatic ability compared with the vector control group. ****P < 0.0001 in the unpaired t‐test.
- A
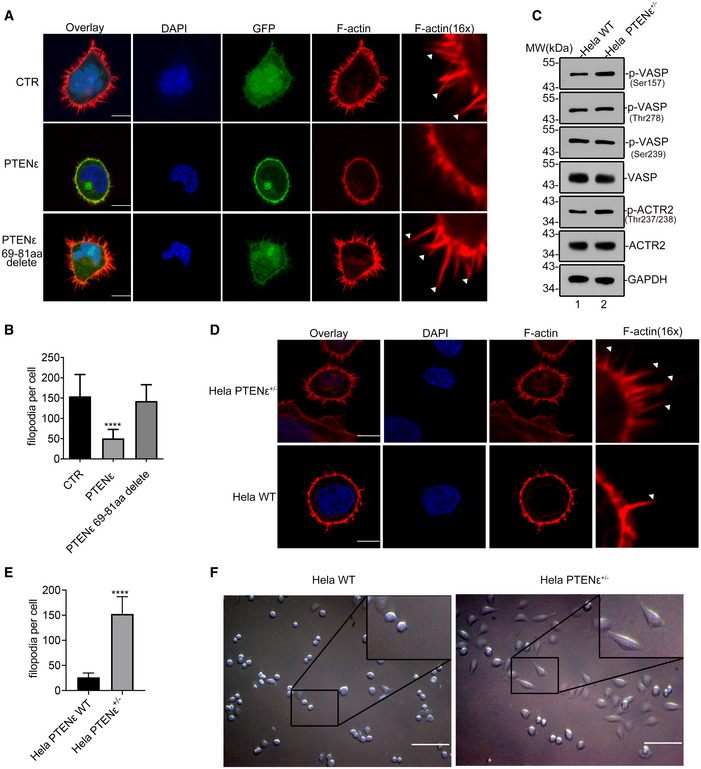
Immunofluorescence staining of F‐actin in wild‐type PTENε or mutant PTENε overexpressed Hela PTEN −/− cells and control cells. PTENε‐GFP, PTENε 69–81aa delete‐GFP, or mock construct was introduced into Hela PTEN −/− cells. The transfected cells were stained with Phalloidin and DAPI before being imaged with confocal microscopy. The scale bars represent 5 μm (left panel). White arrows shown in the magnified immunofluorescence images indicate the filopodia in the cell membrane.
- B
Quantification of the number of filopodia per cell by FiloQuant software. The data are presented as mean ± SD of three independent experiments and were analyzed with the unpaired t‐test. ****P < 0.0001.
- C
The phosphorylation of VASP and ACTR2 in PTENε depleted Hela cells. Hele WT and Hela PTENε+/− cell lysates were immunoblotted with antibodies against p‐ACTR2 (Thr237 and Thr238), p‐VASP (Ser157), p‐VASP (Ser239), p‐VASP (Thr278), VASP, ACTR2, and GAPDH.
- D, E
The influence of endogenous PTENε depletion on filopodia formation. (D) Immunofluorescence staining of F‐actin in Hela PTENε+/− cells and wild‐type cells. Hela PTENε+/− cells and wild‐type cells were stained with Phalloidin and DAPI before being imaged with confocal microscopy. The scale bars represent 5 μm. White arrows shown in the magnified immunofluorescence images indicate the filopodia in the cell membrane. (E) Quantification of the number of filopodia per cell by FiloQuant software and the data are presented as mean ± SD of three independent experiments and were analyzed with the unpaired t‐test. ****P < 0.0001.
- F
The influence of PTENε deficiency on Hela cell morphology. The morphology of Hela PTENε+/− cells was observed with a Nikon microscope. Representative images of each group were shown at a higher magnification. The scale bars represent 80 μm.
References
-
- Ali M, Rogers LK, Pitari GM (2015) Serine phosphorylation of vasodilator‐stimulated phosphoprotein (VASP) regulates colon cancer cell survival and apoptosis. Life Sci 123: 1–8 - PubMed
-
- Blume C, Benz PM, Walter U, Ha J, Kemp BE, Renne T (2007) AMP‐activated protein kinase impairs endothelial actin cytoskeleton assembly by phosphorylating vasodilator‐stimulated phosphoprotein. J Biol Chem 282: 4601–4612 - PubMed
Publication types
MeSH terms
Substances
LinkOut - more resources
Full Text Sources
Other Literature Sources
Research Materials
