

Physiological and metabolic characteristics of novel double-mutant female mice with targeted disruption of both growth hormone-releasing hormone and growth hormone receptor
- PMID: 33755309
- PMCID: PMC8045953
- DOI: 10.1111/acel.13339
Physiological and metabolic characteristics of novel double-mutant female mice with targeted disruption of both growth hormone-releasing hormone and growth hormone receptor
Abstract
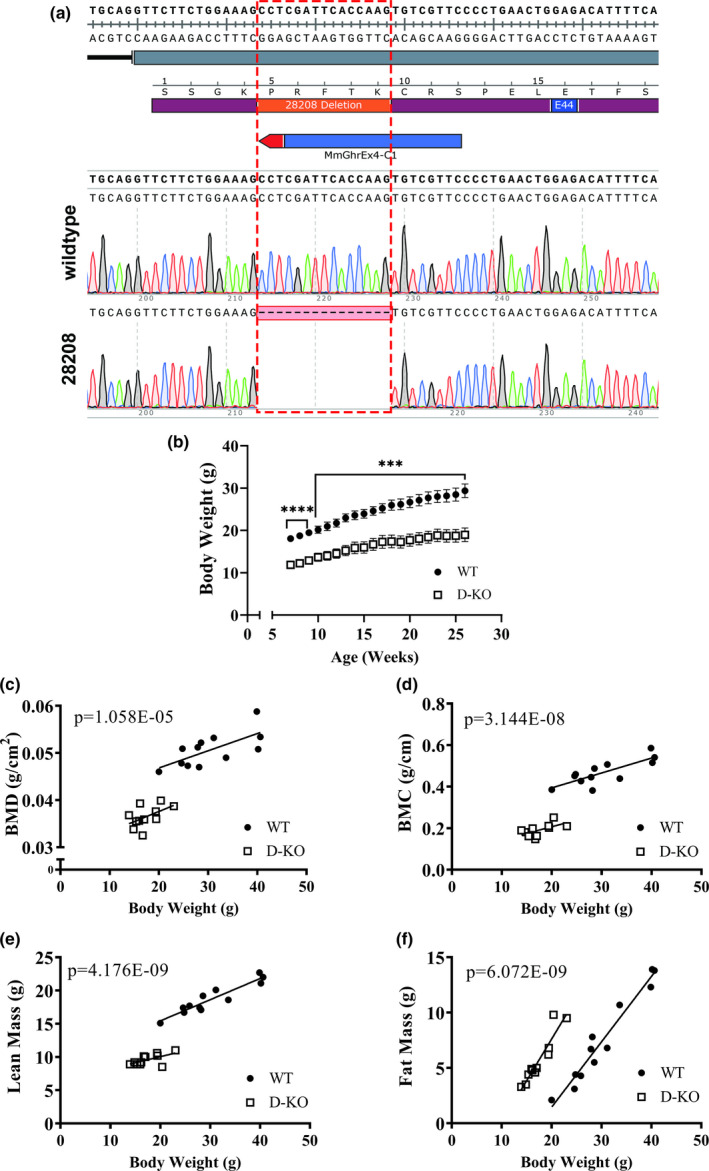
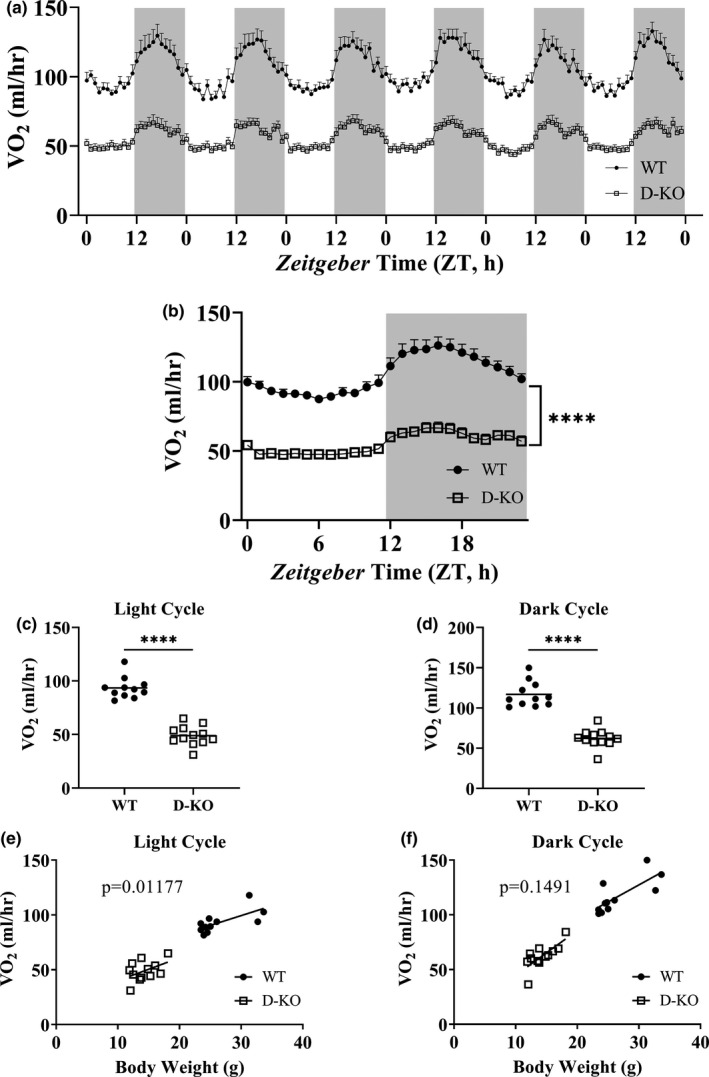
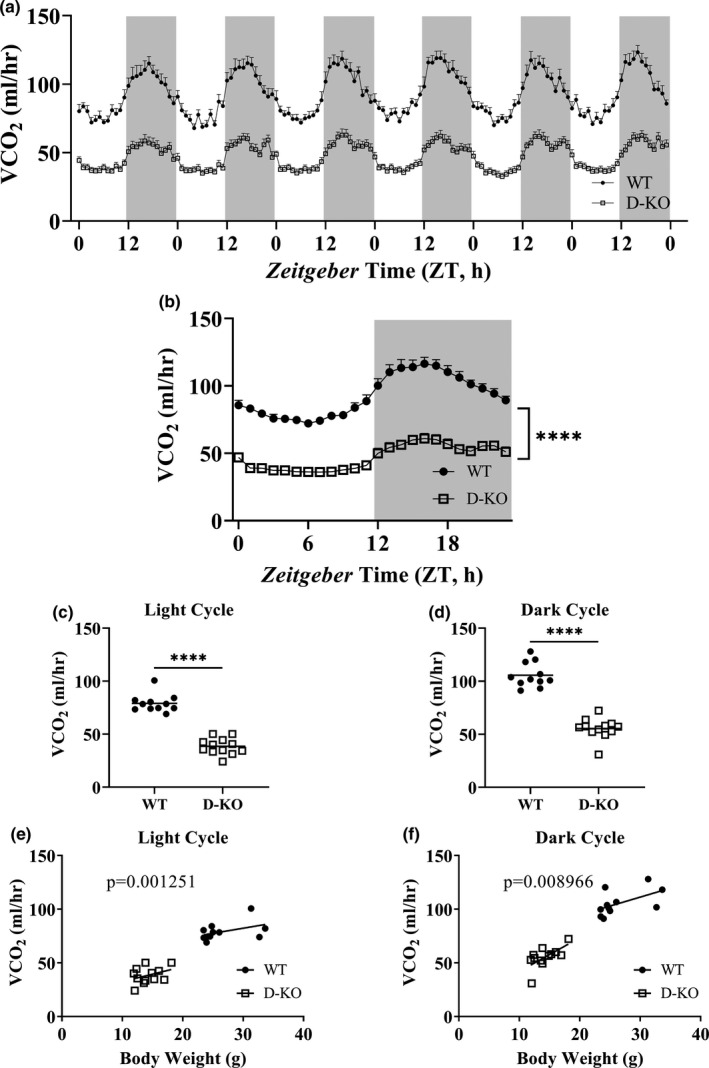
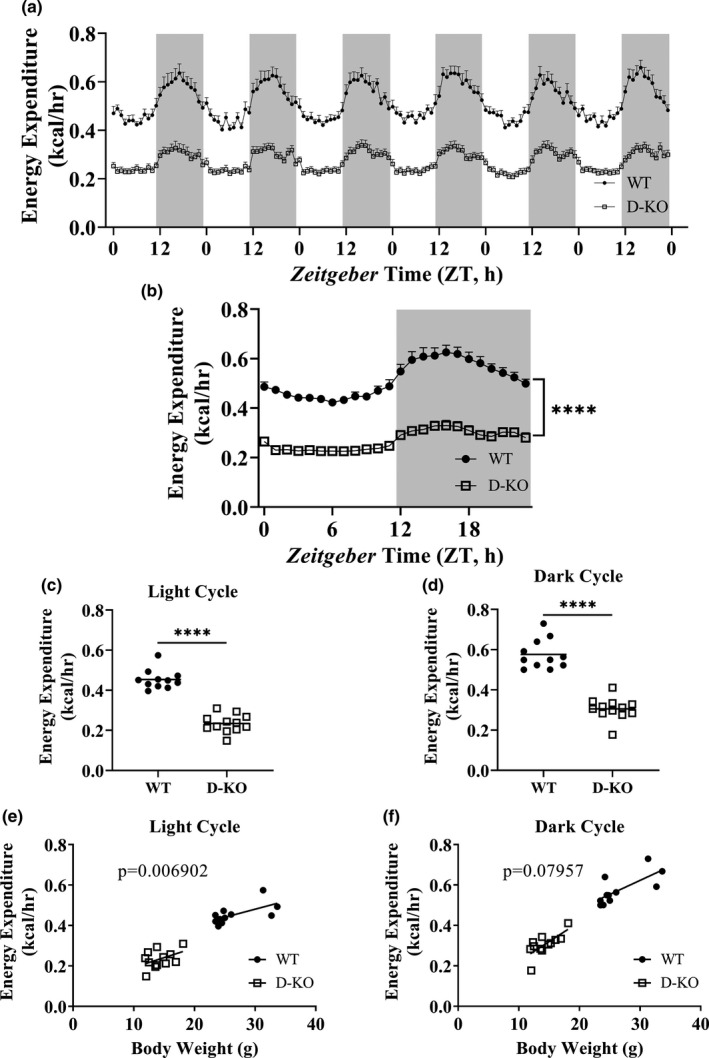
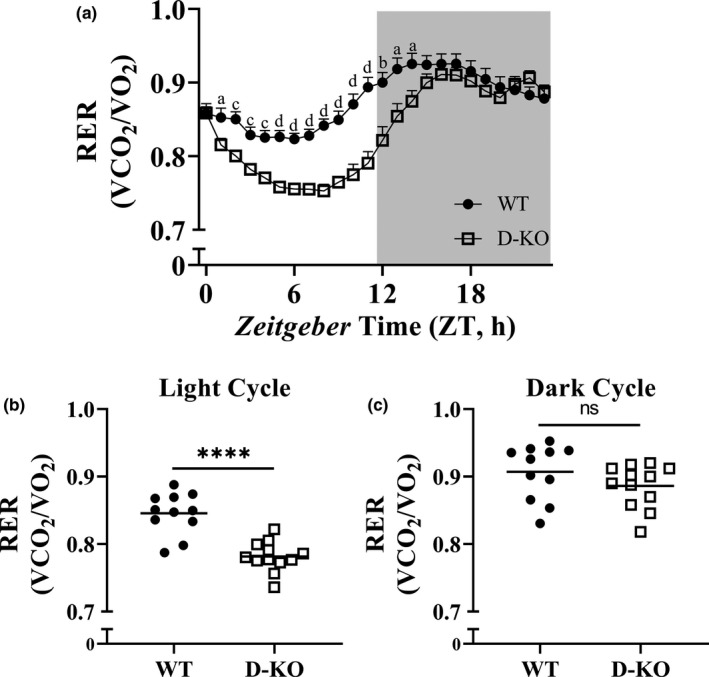
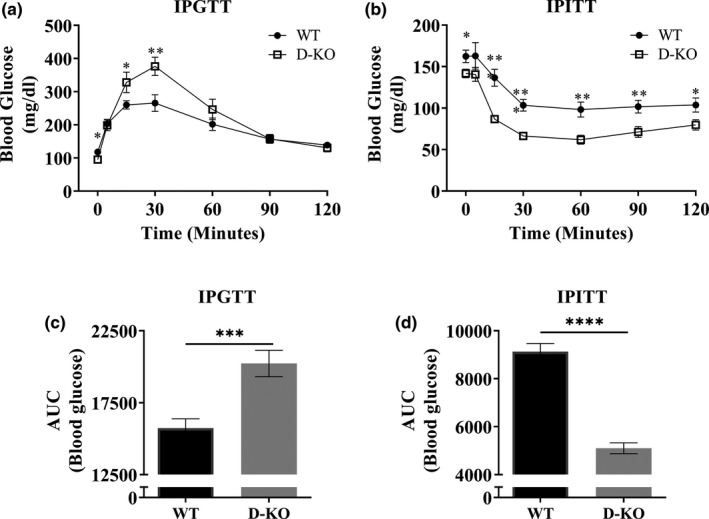
Mice with disruptions of growth hormone-releasing hormone (GHRH) or growth hormone receptor (GHR) exhibit similar phenotypes of prolonged lifespan and delayed age-related diseases. However, these two models respond differently to calorie restriction indicating that they might carry different and/or independent mechanisms for improved longevity and healthspan. In order to elucidate these mechanisms, we generated GHRH and GHR double-knockout mice (D-KO). In the present study, we focused specifically on the characteristics of female D-KO mice. The D-KO mice have reduced body weight and enhanced insulin sensitivity compared to wild-type (WT) controls. Growth retardation in D-KO mice is accompanied by decreased GH expression in pituitary, decreased circulating IGF-1, increased high-molecular-weight (HMW) adiponectin, and leptin hormones compared to WT controls. Generalized linear model-based regression analysis, which controls for body weight differences between D-KO and WT groups, shows that D-KO mice have decreased lean mass, bone mineral density, and bone mineral content, but increased adiposity. Indirect calorimetry markers including oxygen consumption, carbon dioxide production, and energy expenditure were significantly lower in D-KO mice relative to the controls. In comparison with WT mice, the D-KO mice displayed reduced respiratory exchange ratio (RER) values only during the light cycle, suggesting a circadian-related metabolic shift toward fat utilization. Interestingly, to date survival data suggest extended lifespan in D-KO female mice.
Keywords: CRISPR; GHR; GHRH; indirect calorimetry; insulin sensitivity; metabolism.
© 2021 The Authors. Aging Cell published by Anatomical Society and John Wiley & Sons Ltd.
Conflict of interest statement
All of the contributing authors declared no conflicts of interest.
Figures
Similar articles
-
Physiological and metabolic features of mice with CRISPR/Cas9-mediated loss-of-function in growth hormone-releasing hormone.Aging (Albany NY). 2020 May 18;12(10):9761-9780. doi: 10.18632/aging.103242. Epub 2020 May 18. Aging (Albany NY). 2020. PMID: 32422607 Free PMC article.
-
GH-Releasing Hormone Neurons Regulate the Hypothalamic-Pituitary-Somatotropic Axis via Short-Loop Negative Feedback.Endocrinology. 2025 Mar 24;166(5):bqaf062. doi: 10.1210/endocr/bqaf062. Endocrinology. 2025. PMID: 40172534
-
Growth hormone receptor-deficient pigs resemble the pathophysiology of human Laron syndrome and reveal altered activation of signaling cascades in the liver.Mol Metab. 2018 May;11:113-128. doi: 10.1016/j.molmet.2018.03.006. Epub 2018 Mar 15. Mol Metab. 2018. PMID: 29678421 Free PMC article.
-
Links between growth hormone and aging.Endokrynol Pol. 2013;64(1):46-52. Endokrynol Pol. 2013. PMID: 23450447 Free PMC article. Review.
-
Insulin-like growth factor 1 (IGF-1) and aging: controversies and new insights.Biogerontology. 2003;4(1):1-8. doi: 10.1023/a:1022448532248. Biogerontology. 2003. PMID: 12652183 Review.
Cited by
-
Effects of growth hormone-releasing hormone deficiency in mice beyond growth.Rev Endocr Metab Disord. 2025 Jun;26(3):371-384. doi: 10.1007/s11154-024-09936-3. Epub 2024 Dec 18. Rev Endocr Metab Disord. 2025. PMID: 39695049 Review.
-
Genes That Extend Lifespan May Do So by Mitigating the Increased Risk of Death Posed by Having Hypertension.Am J Hypertens. 2023 Nov 15;36(12):631-640. doi: 10.1093/ajh/hpad070. Am J Hypertens. 2023. PMID: 37561089 Free PMC article.
-
L-Serine Influences Epigenetic Modifications to Improve Cognition and Behaviors in Growth Hormone-Releasing Hormone Knockout Mice.Biomedicines. 2022 Dec 30;11(1):104. doi: 10.3390/biomedicines11010104. Biomedicines. 2022. PMID: 36672612 Free PMC article.
-
Growth hormone-releasing hormone deficiency confers extended lifespan and metabolic resilience during high-fat feeding in mid and late life.Aging Cell. 2024 Sep;23(9):e14238. doi: 10.1111/acel.14238. Epub 2024 Jun 12. Aging Cell. 2024. PMID: 38867381 Free PMC article.
-
Isolating the direct effects of growth hormone on lifespan and metabolism in mice.Aging Cell. 2024 Dec;23(12):e14412. doi: 10.1111/acel.14412. Epub 2024 Nov 20. Aging Cell. 2024. PMID: 39568151 Free PMC article.
References
-
- Aguiar‐Oliveira, M. H. , Oliveira, F. T. , Pereira, R. M. C. , Oliveira, C. R. P. , Blackford, A. , Valenca, E. H. O. , Santos, E. G. , Gois‐Junior, M. B. , Meneguz‐Moreno, R. A. , Araujo, V. P. , Oliveira‐Neto, L. A. , Almeida, R. P. , Santos, M. A. , Farias, N. T. , Silveira, D. C. R. , Cabral, G. W. , Calazans, F. R. , Seabra, J. D. , Lopes, T. F. , … Salvatori, R. (2010). Longevity in untreated congenital growth hormone deficiency due to a homozygous mutation in the GHRH receptor gene. Journal of Clinical Endocrinology and Metabolism, 95(2), 714–721. 10.1210/jc.2009-1879 - DOI - PMC - PubMed
Publication types
MeSH terms
Substances
Grants and funding
LinkOut - more resources
Full Text Sources
Other Literature Sources
Medical
Molecular Biology Databases
Research Materials
Miscellaneous
