

The immune suppressive microenvironment affects efficacy of radio-immunotherapy in brain metastasis
- PMID: 33755340
- PMCID: PMC8103101
- DOI: 10.15252/emmm.202013412
The immune suppressive microenvironment affects efficacy of radio-immunotherapy in brain metastasis
Abstract
The tumor microenvironment in brain metastases is characterized by high myeloid cell content associated with immune suppressive and cancer-permissive functions. Moreover, brain metastases induce the recruitment of lymphocytes. Despite their presence, T-cell-directed therapies fail to elicit effective anti-tumor immune responses. Here, we seek to evaluate the applicability of radio-immunotherapy to modulate tumor immunity and overcome inhibitory effects that diminish anti-cancer activity. Radiotherapy-induced immune modulation resulted in an increase in cytotoxic T-cell numbers and prevented the induction of lymphocyte-mediated immune suppression. Radio-immunotherapy led to significantly improved tumor control with prolonged median survival in experimental breast-to-brain metastasis. However, long-term efficacy was not observed. Recurrent brain metastases showed accumulation of blood-borne PD-L1+ myeloid cells after radio-immunotherapy indicating the establishment of an immune suppressive environment to counteract re-activated T-cell responses. This finding was further supported by transcriptional analyses indicating a crucial role for monocyte-derived macrophages in mediating immune suppression and regulating T-cell function. Therefore, selective targeting of immune suppressive functions of myeloid cells is expected to be critical for improved therapeutic efficacy of radio-immunotherapy in brain metastases.
Keywords: brain cancer; checkpoint inhibitors; microglia; tumor microenvironment; tumor-associated macrophages.
© 2021 The Authors. Published under the terms of the CC BY 4.0 license.
Conflict of interest statement
The authors declare that they have no conflict of interest.
Figures
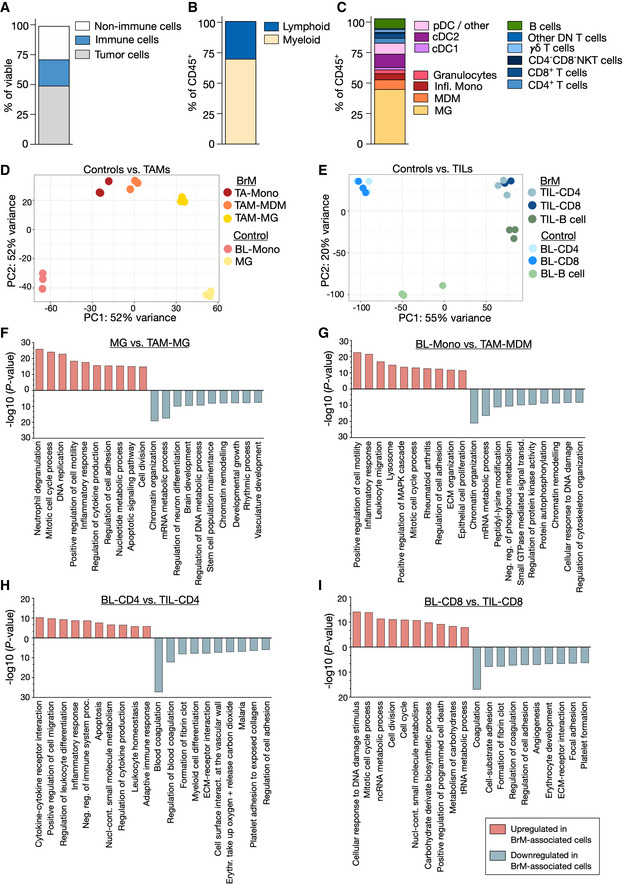
- A
Stacked column depicts proportions of cell types in the TME of 99LN‐BrM analyzed by flow cytometry (n = 4).
- B
Stacked column depicts the relative amount of myeloid and lymphoid cells in 99LN‐BrM analyzed by flow cytometry (n = 5).
- C
Stacked column depicts the relative amount of myeloid and lymphoid subpopulations in 99LN‐BrM based on three flow cytometry panels: myeloid cells (n = 5), dendritic cells (n = 7), and lymphoid cells (n = 6).
- D
Principal component analysis of tumor‐associated myeloid cells vs. blood monocytes and microglia from tumor‐free mice (n = 3 per condition).
- E
Principal component analysis of tumor‐infiltrating lymphocytes (TIL) vs blood lymphocytes from tumor‐free mice (n = 3 per condition).
- F–I
Functional gene annotation of altered cellular pathways in (F) TAM‐MG, (G) TAM‐MDM, (H) TIL‐CD4, and (I) TIL‐CD8 compared with control cell types from tumor‐free animals. Cutoffs: basemean > 20 and adjusted P‐value (Padj) < 0.05. Adjusted P‐values were obtained by Wald test and corrected for multiple testing using the Benjamini and Hochberg method. All DEGs based on Padj were subjected to analysis.
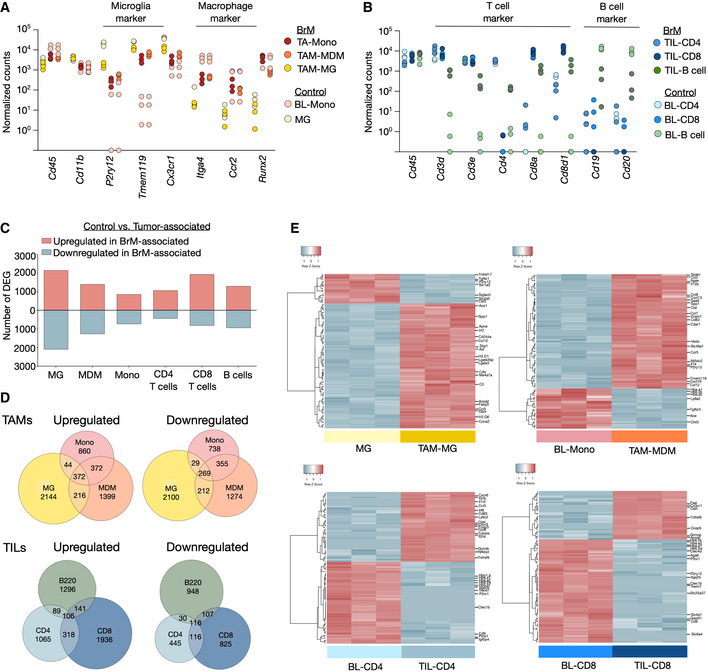
Expression of MG and monocyte/MDM restricted genes in tumor‐associated myeloid cells and control cells from tumor‐free animals (n = 3; note: individual samples showed no expression for specific genes and are indicated on the x‐axis). Values are depicted as normalized counts.
Expression of T‐ and B‐cell restricted genes in tumor‐infiltrating lymphocytes and blood lymphocytes from tumor‐free animals (n = 3; note: individual samples showed no expression for specific genes and are indicated on the x‐axis). Values are depicted as normalized counts.
Amount of significant DEG (cutoff: base mean (BM) > 20, Padj < 0.05) in different cell types based on RNAseq data of tumor‐associated vs. control cell types (n = 3).
Euler plots depict shared and unique DEGs (cutoff: BM > 20, Padj. < 0.05) in each cell type based on RNAseq data from tumor‐associated vs. control cell types (n = 3).
Unsupervised clustering of the top 100 DEG in control MG vs. TAM‐MG, BL‐Mono vs. TAM‐MDM. BL‐CD4 vs. TIL‐CD4 and BL‐CD8 vs. TIL‐CD8 (cutoff: BM > 20, Padj. < 0.05) (n = 3). Selected genes are annotated.
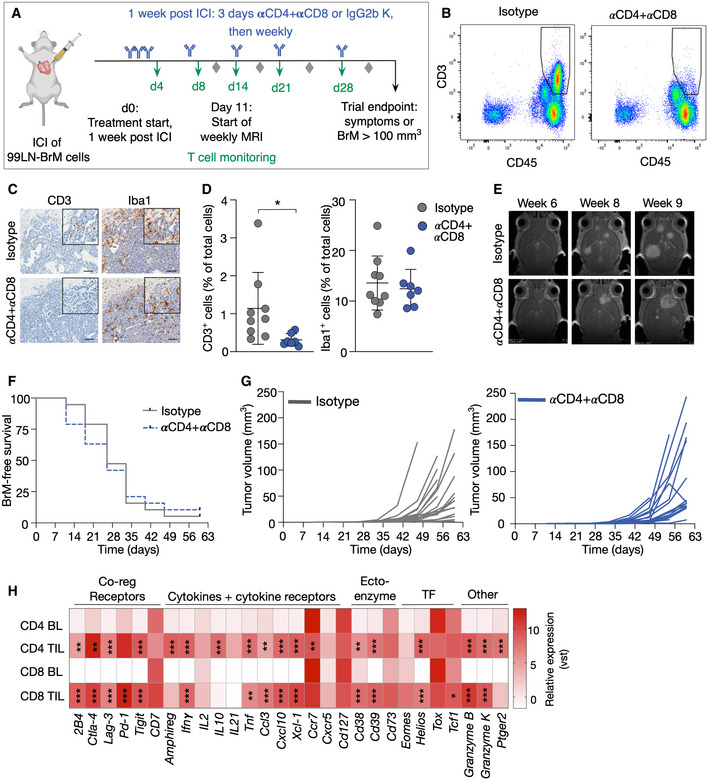
Experimental design of T‐cell depletion by αCD4 and αCD8a antibody treatment.
Representative flow cytometry blots of blood samples from mice of both groups 3 weeks after treatment start showing successful depletion of CD45+CD3+ T cells in the αCD4 + αCD8 treatment group.
Representative IHC images of CD3+ T cells and Iba1+ macrophages/MG in the isotype and αCD4 + αCD8 group. Scale bar; 100 µm.
Quantification of Iba1+ and CD3+ cells in IHC sections of BrM from the isotype (n = 9) and αCD4 + αCD8 group (n = 7).
Representative MRI pictures of BrM in early, medium, and late stage of both groups.
Kaplan–Meier curves depict BrM‐free survival of mice in the isotype and αCD4 + αCD8 group (Isotype n = 19, αCD4 + αCD8 n = 19).
Tumor growth curves depict the increase in absolute BrM volume for each mouse in both groups over time (isotype n = 19, αCD4 + αCD8 n = 19).
Heatmap displays the relative expression level of T‐cell effector and exhaustion marker in TIL‐CD4 and TIL‐CD8 compared with blood lymphocytes. Values display the average per group based on vst values (BL‐CD4 or BL‐CD8 with n = 3 for each group) vs. BrM‐associated TIL‐CD4 or TIL‐CD8 (n = 3 for each group).
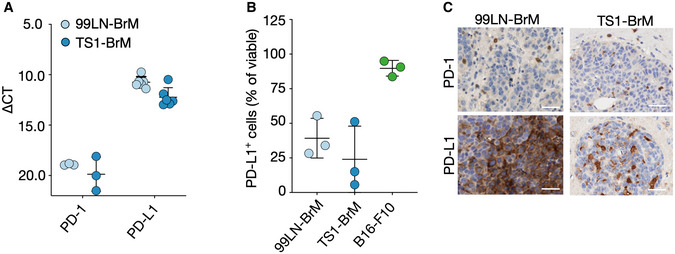
Expression of PD‐1 and PD‐L1 in the BrM cell lines 99LN‐BrM and TS1‐BrM measured by qRT‐PCR (n = 6 for PD‐L1 and n = 3 for PD‐1).
Proportion of 99LN‐BrM, TS1‐BrM and B16‐F10 cells positive for PD‐L1 measured by flow cytometry (n = 3).
Representative IHC images of PD‐1 and PD‐L1 expressing cells in 99LN‐BrM and TS1‐BrM (Scale bars = 50 µm).
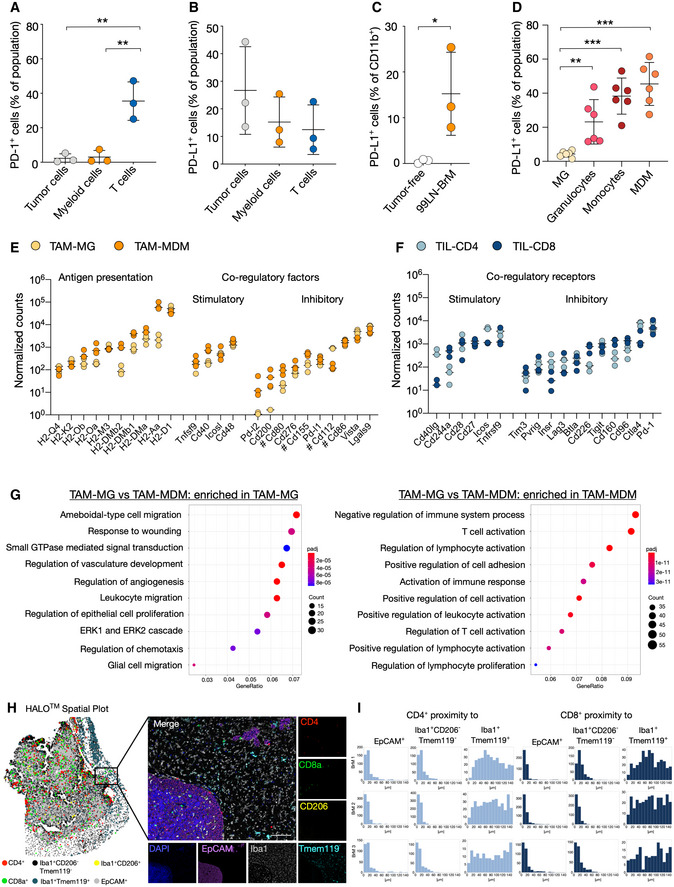
Surface expression of PD‐1 in vivo in 99LN‐BrM quantified by flow cytometry (n = 3).
PD‐L1 in 99LN BrM quantified by flow cytometry (n = 3).
Flow cytometric analysis of PD‐L1 in tumor‐free brain and 99LN‐BrM (n = 3).
Flow cytometric analysis of PD‐L1 expression on 99LN‐BrM‐associated myeloid cell types (n = 6).
Expression of genes associated with antigen presentation and co‐regulatory factors in TAM‐MG and TAM‐MDM. n = 3 per condition. Values are depicted as normalized counts. Genes labeled with # can have stimulatory effects depending on the co‐regulatory receptor on T cells.
Gene expression of co‐regulatory receptors in TIL‐CD4 and TIL‐CD8. n = 3 per condition. Values are depicted as normalized counts.
Functional gene annotation of altered cellular pathways in TAM‐MG vs. TAM‐MDM. Left panel depicts pathways enriched in TAM‐MG, and right panel depicts pathways enriched in TAM‐MDM. Adjusted P‐value (Padj) was obtained by Wald test and corrected for multiple testing using the Benjamini and Hochberg method.
Representative HALO spatial plot showing the spatial distribution of cell types with indicated marker combination in 99LN‐BrM and representative IF images of multiplexed histology. Scale bar; 100 µm.
HALO proximity histogram depicts the distance (µm) between the indicated cell types for individual mice (n = 3).
- A
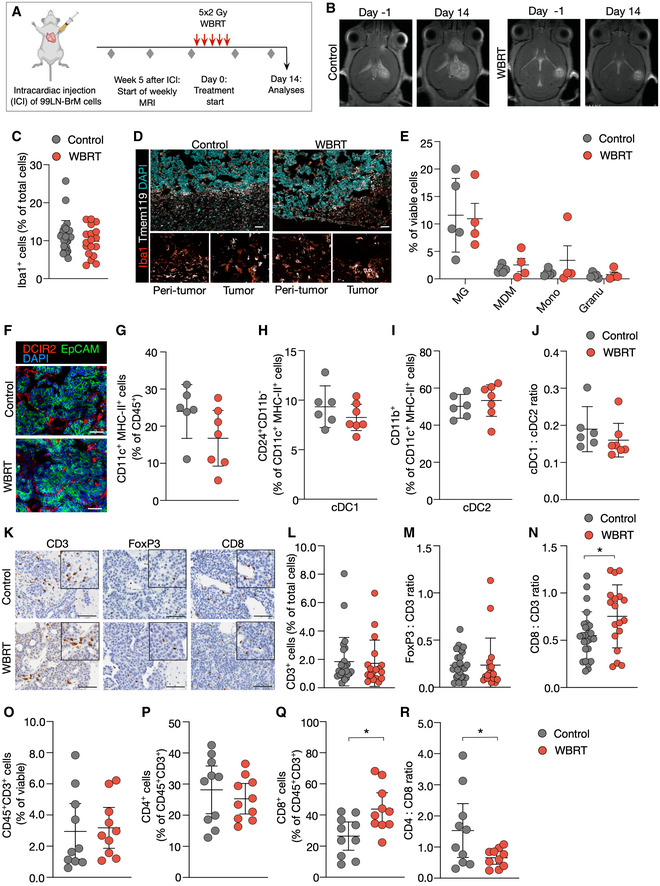
Experimental design of tumor initiation and application of WBRT.
- B
Representative MRI pictures of untreated and irradiated mice at d0 and d14 after treatment start.
- C
Quantification of Iba1+ macrophages in IHC sections of 99LN‐BrM at trial end point (Ctrl n = 27, WBRT n = 18).
- D
Representative IF images of 99LN‐BrM stained for the macrophage marker Iba1 (red) and the MG marker Tmem119 (white). Higher magnification images present areas in the peri‐tumor region and in the tumor core. DAPI was used as nuclear counterstain. Scale bar; 100 µm.
- E
Quantification of different myeloid populations in 99LN‐BrM tumors with and without irradiation by flow cytometry at d14 (Ctrl n = 5, WBRT n = 4).
- F
Representative IF images of 99LN‐BrM with and without WBRT stained for DCIR2 (red) and EpCAM (green). DAPI (blue) was used as nuclear counterstain. Scale bar; 100 µm.
- G
Quantification of CD11c+MHCII+ immune cells by flow cytometry in 99LN‐BrM with and without WBRT.
- H, I
Relative proportion of cDC1 and cDC2 in 99LN‐BrM with and without WBRT.
- J
cDC1:cDC2 ratio in 99LN‐BrM based on flow cytometry data (H + I).
- K
Representative IHC images of CD3+, FoxP3+, and CD8+ T cells in 99LN‐BrM sections with and without WBRT. Scale bar; 100 µm.
- L
Quantification of CD3+ cells in IHC sections of 99LN‐BrM. (Ctrl n = 26, WBRT n = 18).
- M
FoxP3:CD3 ratio in IHC sections of 99LN‐BrM. (Ctrl n = 25, WBRT n = 18).
- N
CD8:CD3 ratio in IHC sections of 99LN‐BrM. (Ctrl n = 25, WBRT n = 18).
- O–Q
Quantification of CD3+, CD4+, and CD8+ T cells in 99LN‐BrM tumors with and without irradiation by flow cytometry.
- R
CD4:CD8 ratio in 99LN‐BrM based on data (P + Q).
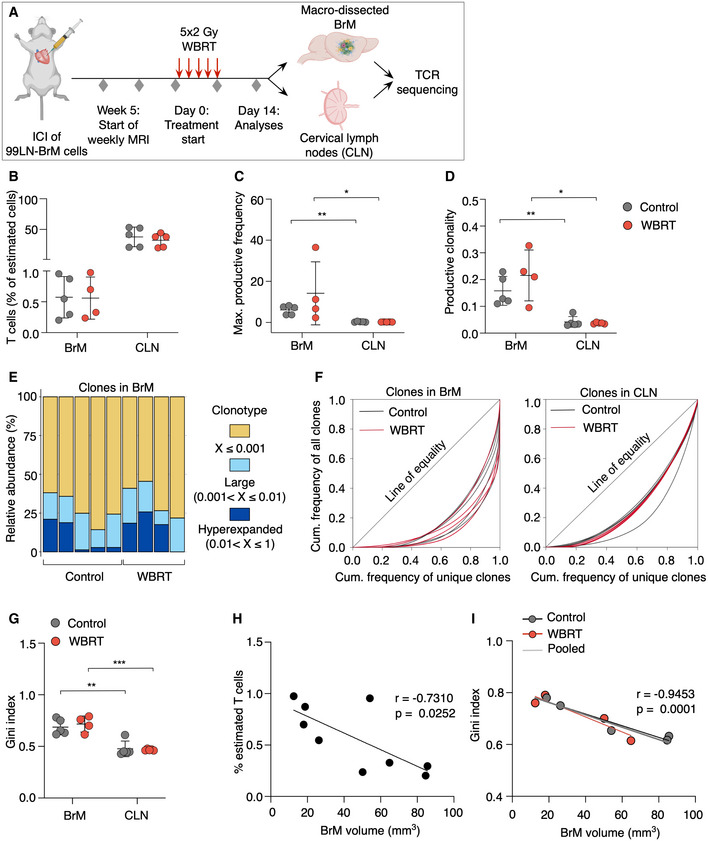
Experimental design of TCR sequencing.
Percent T cells of estimated cells in BrM and CLN of mice from control or WBRT group.
Maximal productive frequency of clones in BrM and CLN samples.
Productive clonality in BrM and CLN samples.
Clonal space homeostasis of BrM samples indicating the relative abundance of clones with a specific frequency.
Lorenz curves generated with the reads of all clones in a sample to visualize deviation from perfect equality.
Lorenz curves were used to determine the Gini index of each sample, which is a measure of inequality reflecting clonal expansion.
Percent of estimated T cells correlated with BrM volume.(r = −0.7310, P = 0.0252).
Gini indices of BrM samples correlated with BrM volume (r = −0.9453, P = 0.0001).
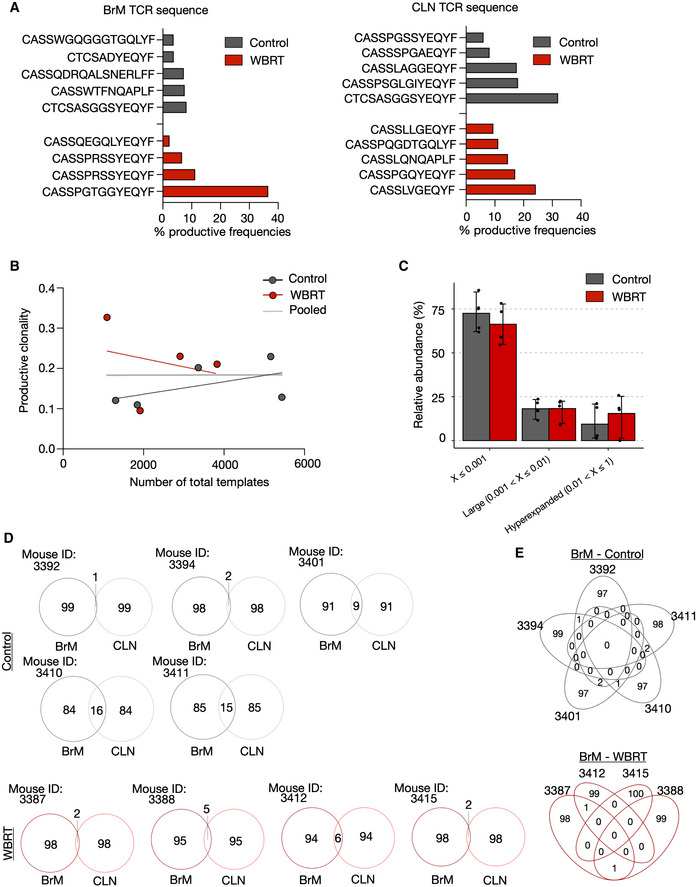
Bar graphs depict the percentage of the top clone from the total T‐cell pool in the individual samples.
Productive clonality of BrM samples plotted against total templates to exclude a correlation.
Comparison of relative abundance of clones with a specific frequency in control and WBRT BrM samples. Values are depicted as scatter plot in bars indicating mean with 95% confidence interval (CI).
Venn diagrams depict the overlap of the top 100 clones in BrM and CLN samples from the individual mice.
Overlap of the top 100 clones of BrM samples in the control and WBRT group.
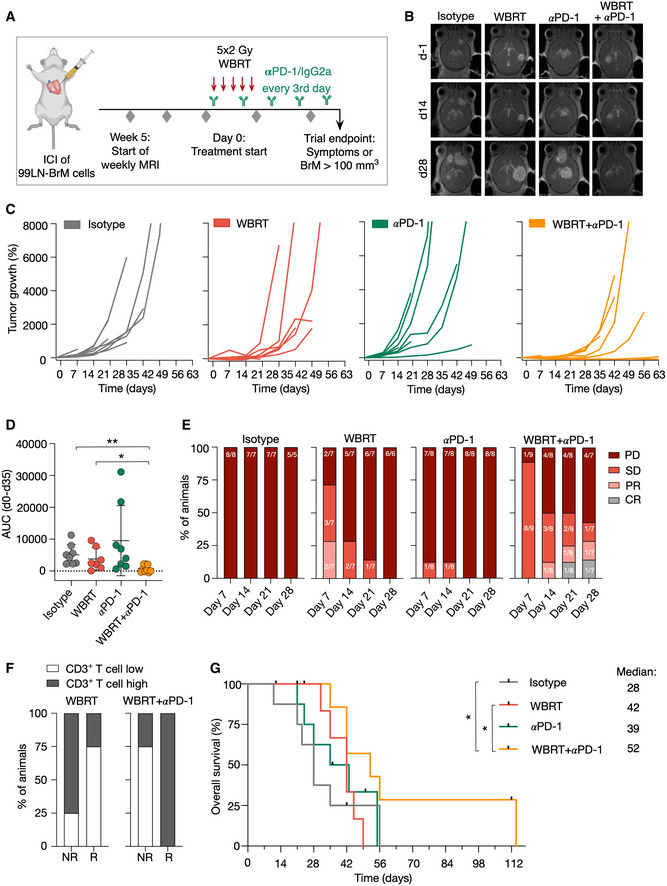
Experimental design of the combination trial.
Representative MRI images of 99LN‐BrM from mice at different time points after treatment start.
Tumor growth curves of individual mice grouped by treatment. Maximal values of 8,000% increase are shown from treatment start to d63.
Quantification of relative tumor growth of the individual mice as area under the curve normalized to the survival time in weeks.
Stacked columns depict the percentage of animals with progressive disease (PD), stable disease (SD), partial response (PR), and complete response (CR) at the indicated time points.
Percentage of mice that were categorized as CD3 T‐cell high or low stratified into responders and non‐responders in the WBRT and WBRT + αPD‐1 treatment group.
Kaplan–Meier curves show the percentage of symptom‐free mice.
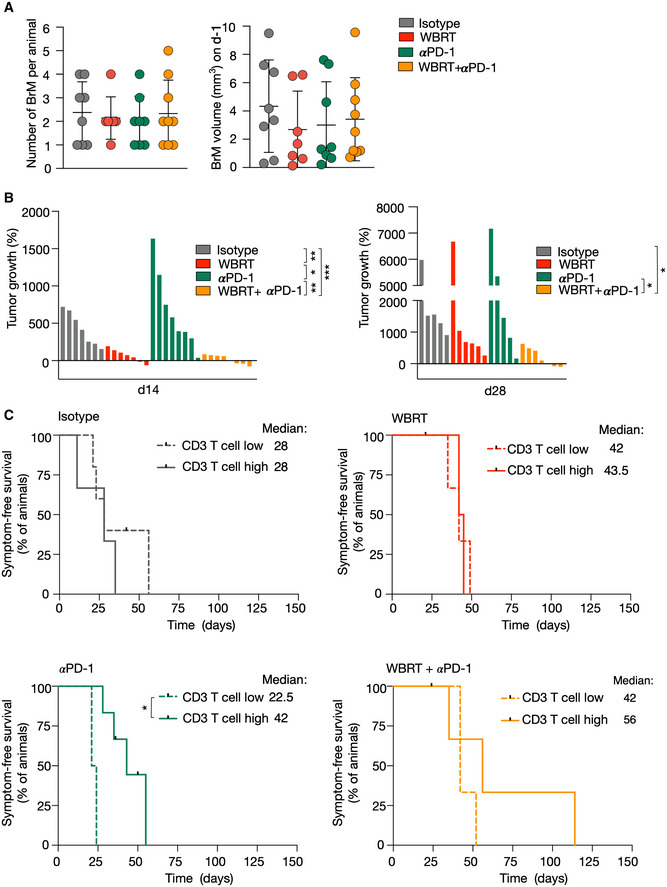
Number and volume of BrM in each treatment group on d‐1.
Waterfall plots depict percent increase in tumor volume of individual mice in each treatment group on days 14 and 28.
Kaplan–Meier curves show symptom‐free survival in the respective treatment groups when mice were categorized as CD3 T‐cell high or low subgroups.
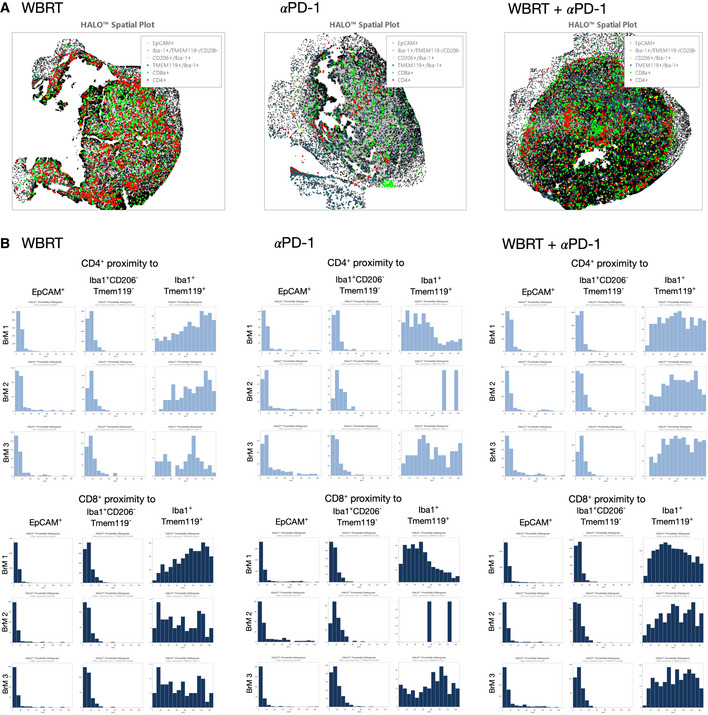
Representative halo spatial plot showing the spatial distribution of cell types with indicated marker combination in 99LN‐BrM in response to treatment with WBRT, αPD‐1, and WBRT + αPD‐1.
HALO proximity histograms depict the distance in µm between the indicated cell types in BrM lesions for individual mice in response to treatment (n = 3 per condition).
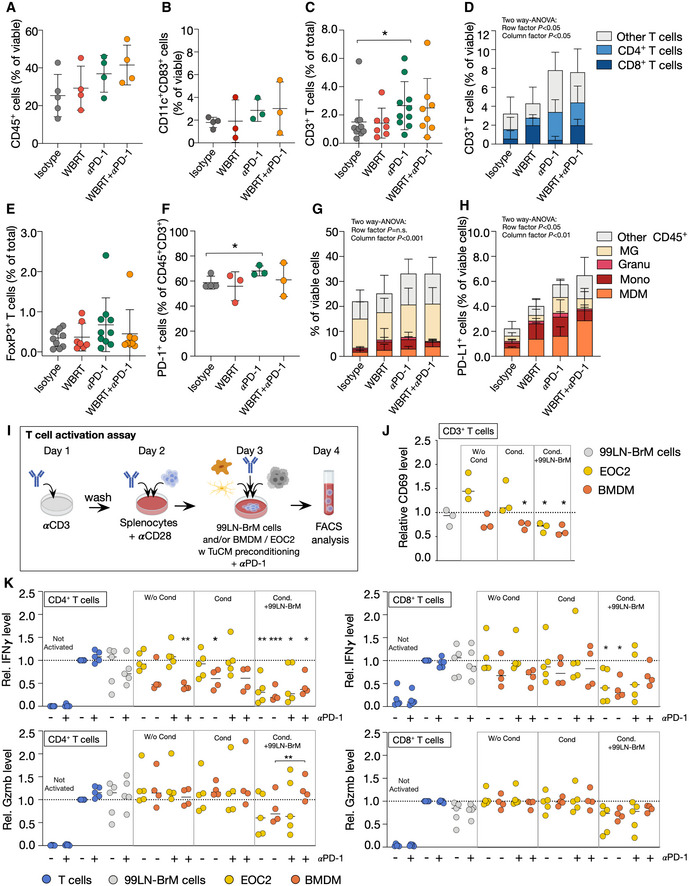
CD45+ immune cells infiltrating 99LN‐BrM (n = 5 for isotype, n = 4 for the other groups).
Flow cytometric analysis of dendritic cell (CD45+CD11c+CD83+) infiltration (n = 4 for isotype, n = 3 for all other groups).
Quantitative analysis of IHC CD3+ T cells at trial end point (n = 10 for isotype, n = 7 for WBRT, n = 10 for αPD‐1, and n = 8 for WBRT + αPD‐1 group).
Flow cytometric analysis of T‐cell subpopulations in 99LN‐BrM (n = 4 for isotype, n = 3 for all other groups).
Quantitative analysis of IHC FoxP3+ T cells at trial end point (n = 10 for isotype, n = 7 for WBRT, n = 10 for αPD‐1, and n = 8 for WBRT + αPD‐1 group).
Flow cytometric analysis of PD‐1 expression on T cells in response to different treatments (control n = 4, all other groups n = 3).
Composition of the myeloid compartment in 99LN‐BrM in the different treatment groups (n = 5 for isotype, all other groups n = 4).
Relative abundance (%) of PD‐L1+ myeloid cell types in BrM samples of the four treatment groups (n = 5 for isotype, all other groups n = 4).
Experimental design of the in vitro T‐cell activation assay.
Relative CD69 protein level on T cells cultivated with different cell types, unstimulated, or stimulated with tumor‐conditioned media (Cond.) (n = 3).
Relative Gzmb and IFNγ protein level on CD4+ and CD8+ T cells cultivated with different cell types, with or without αPD‐1 and unstimulated or stimulated with tumor‐conditioned media (Cond.) (n = 4 for conditions including BMDM, n = 5 for all other conditions).
References
-
- Adams S, Schmid P, Rugo HS, Winer EP, Loirat D, Awada A, Cescon DW, Iwata H, Campone M, Nanda R et al (2019) Pembrolizumab monotherapy for previously treated metastatic triple‐negative breast cancer: cohort A of the phase II KEYNOTE‐086 study. Ann Oncol 30: 397–404 - PubMed
-
- Berghoff AS, Ricken G, Wilhelm D, Rajky O, Widhalm G, Dieckmann K, Birner P, Bartsch R, Preusser M (2016) Tumor infiltrating lymphocytes and PD‐L1 expression in brain metastases of small cell lung cancer (SCLC). J Neurooncol 130: 19–29 - PubMed
Publication types
MeSH terms
Associated data
- Actions
LinkOut - more resources
Full Text Sources
Other Literature Sources
Medical
Molecular Biology Databases
Research Materials
