

A Deep Learning Approach for Segmentation, Classification, and Visualization of 3-D High-Frequency Ultrasound Images of Mouse Embryos
- PMID: 33755564
- PMCID: PMC8274381
- DOI: 10.1109/TUFFC.2021.3068156
A Deep Learning Approach for Segmentation, Classification, and Visualization of 3-D High-Frequency Ultrasound Images of Mouse Embryos
Abstract
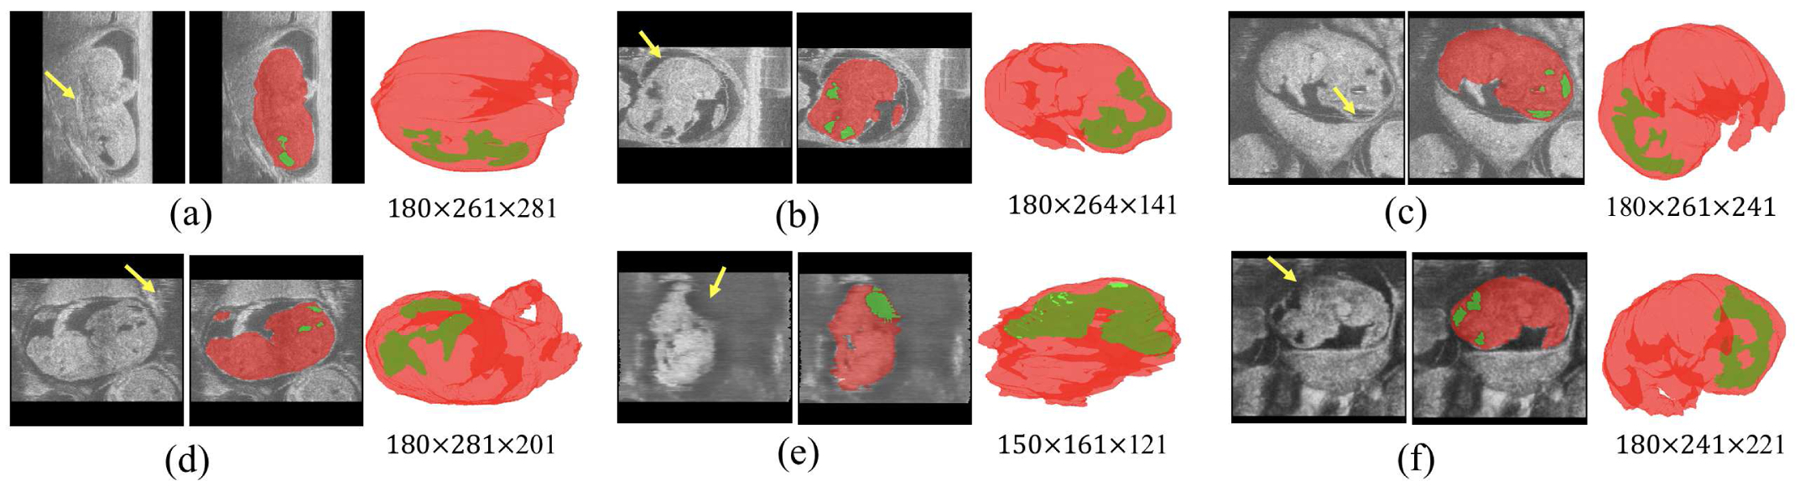
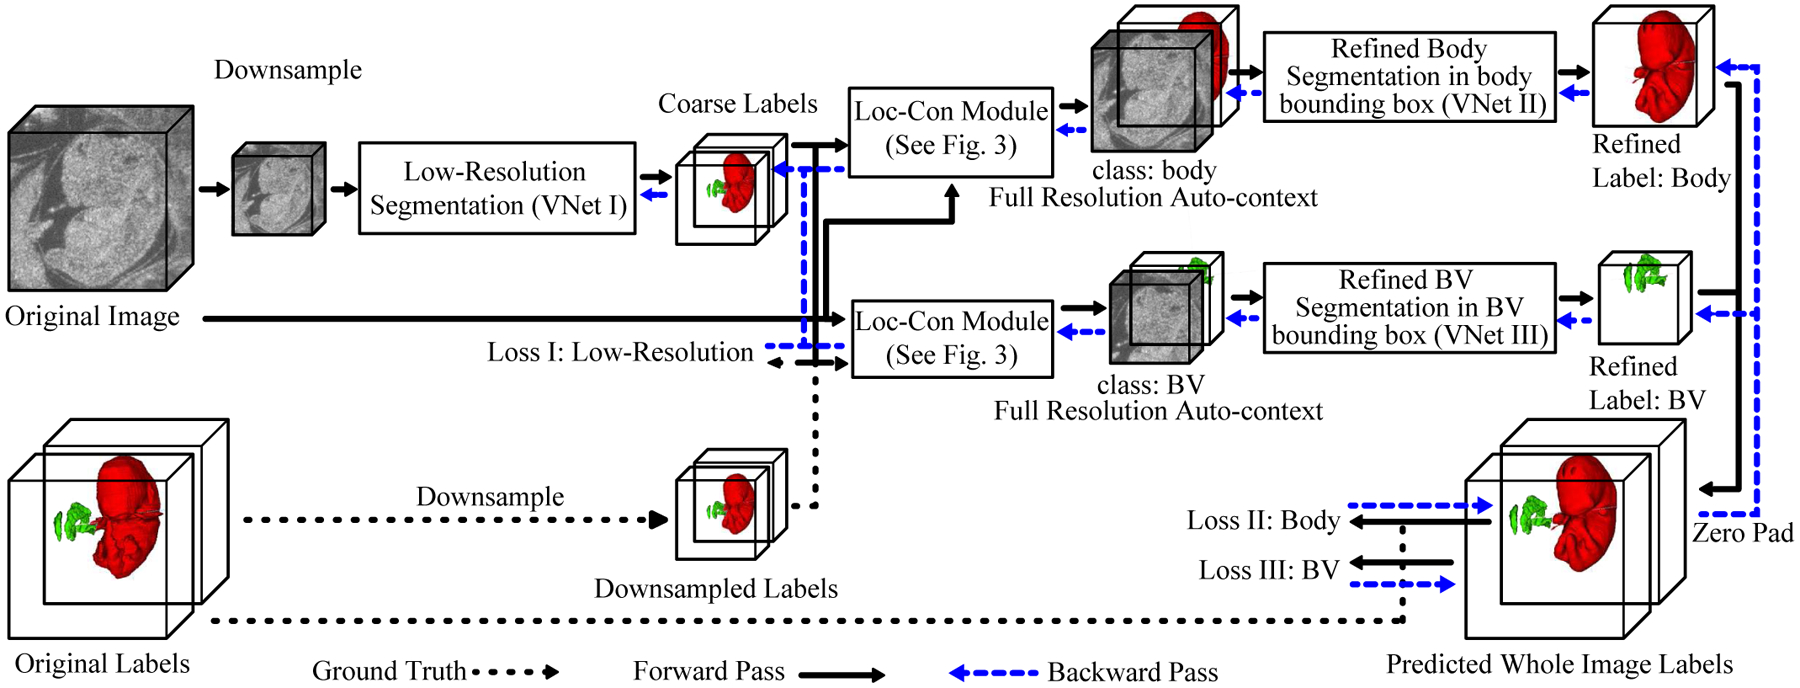
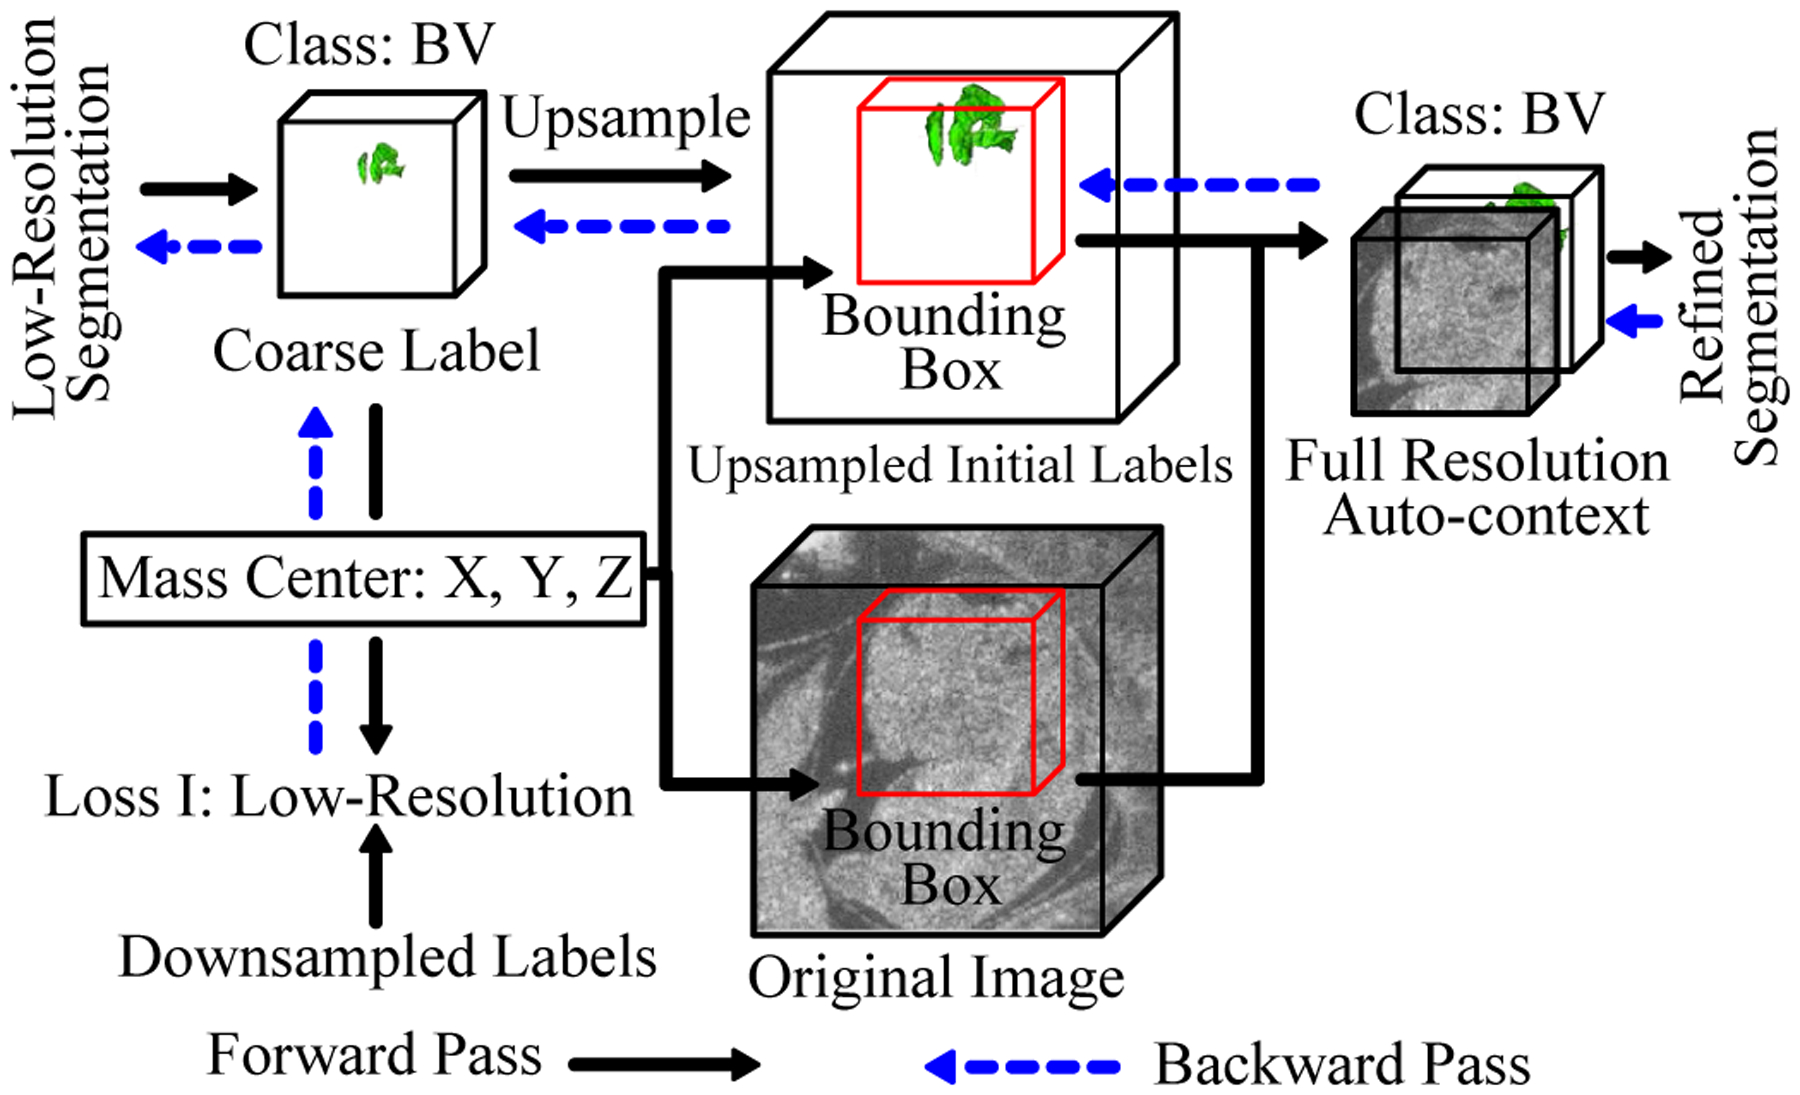
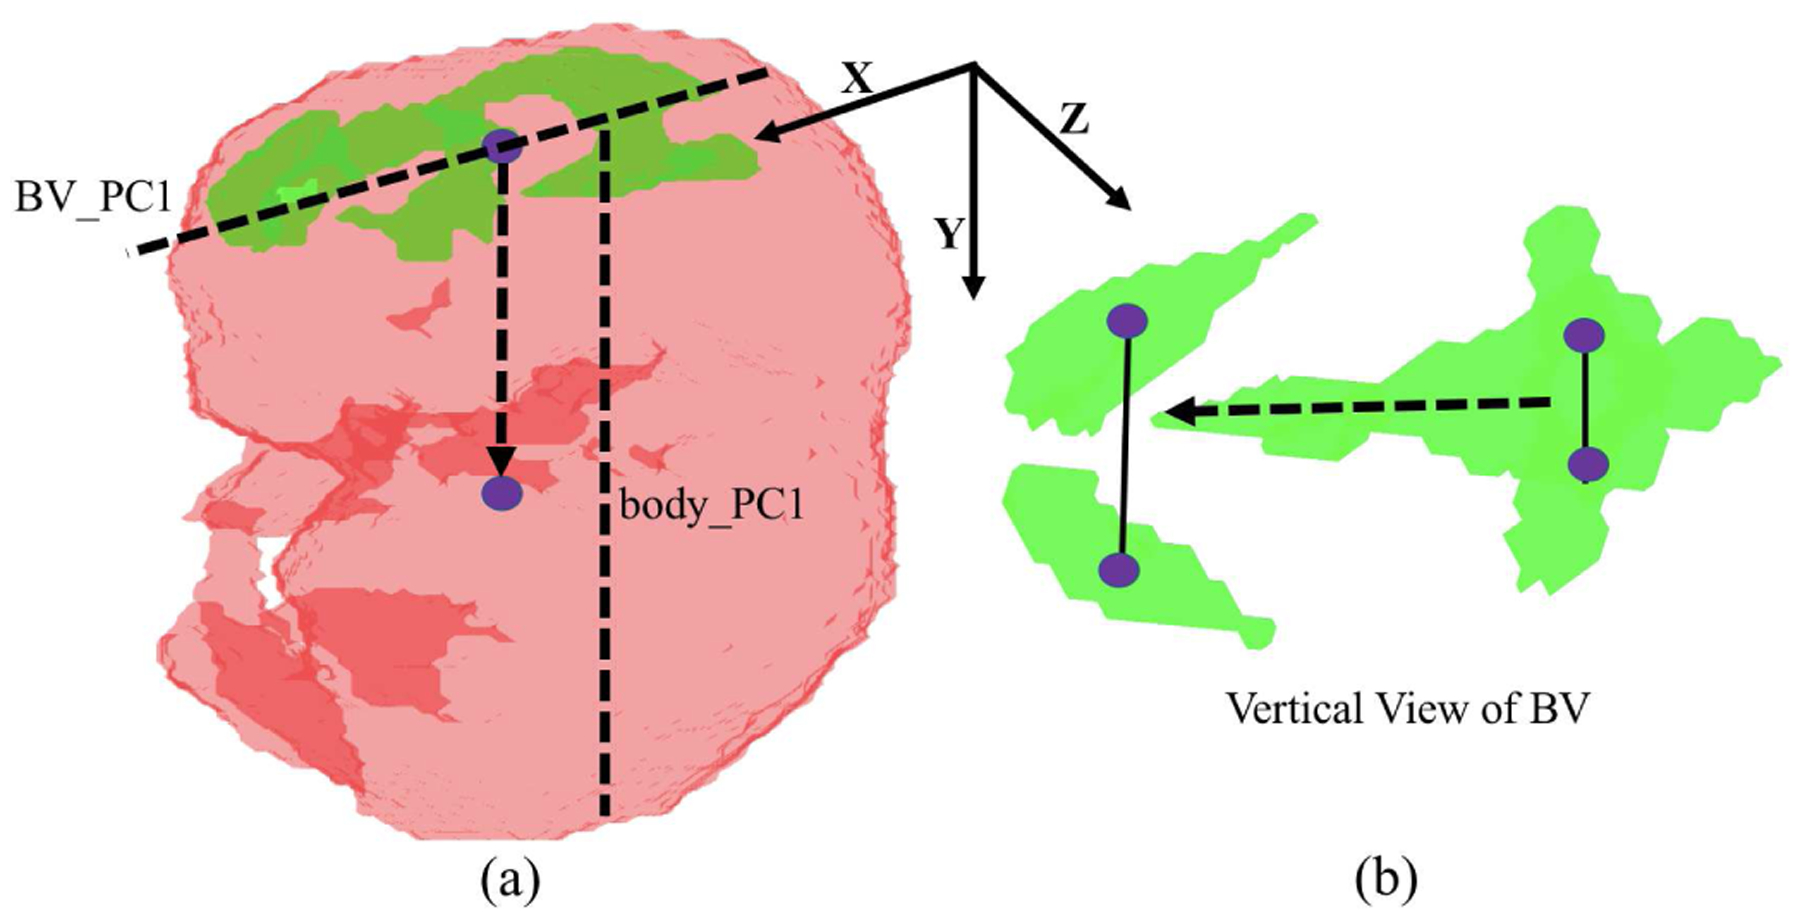
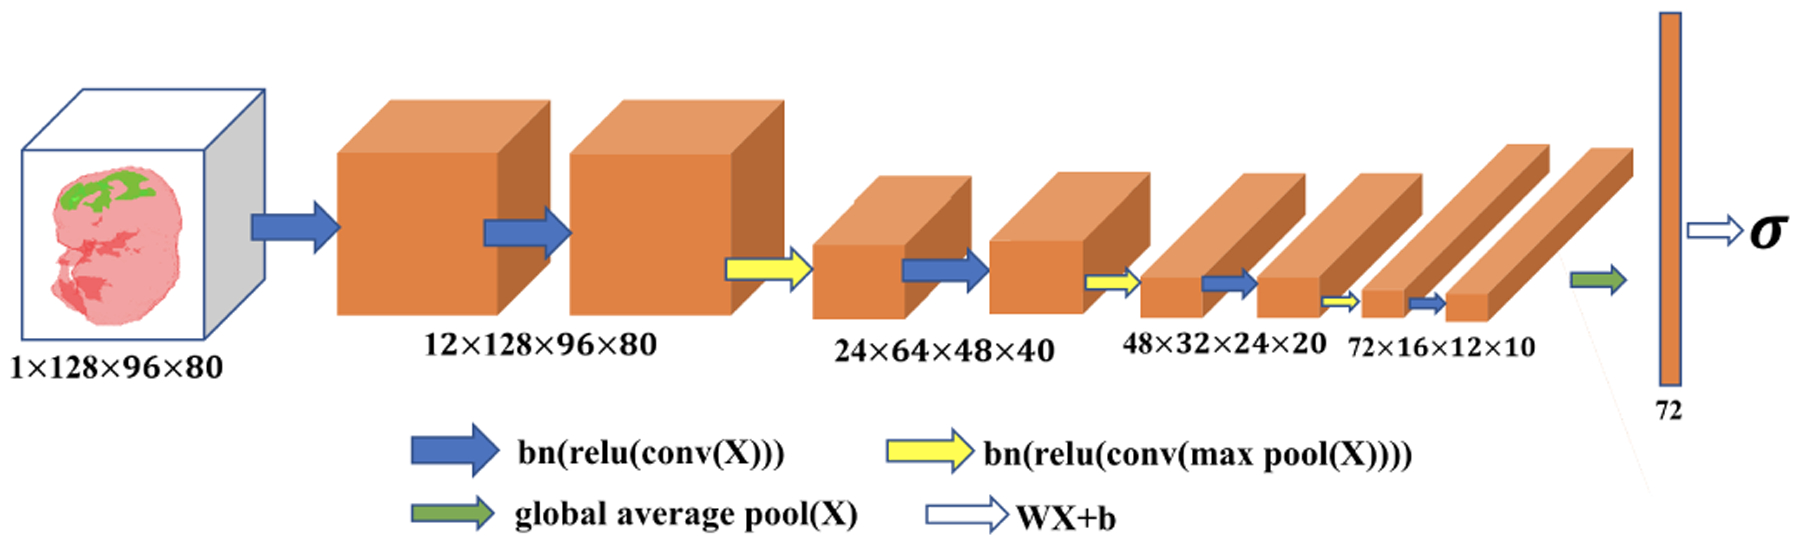
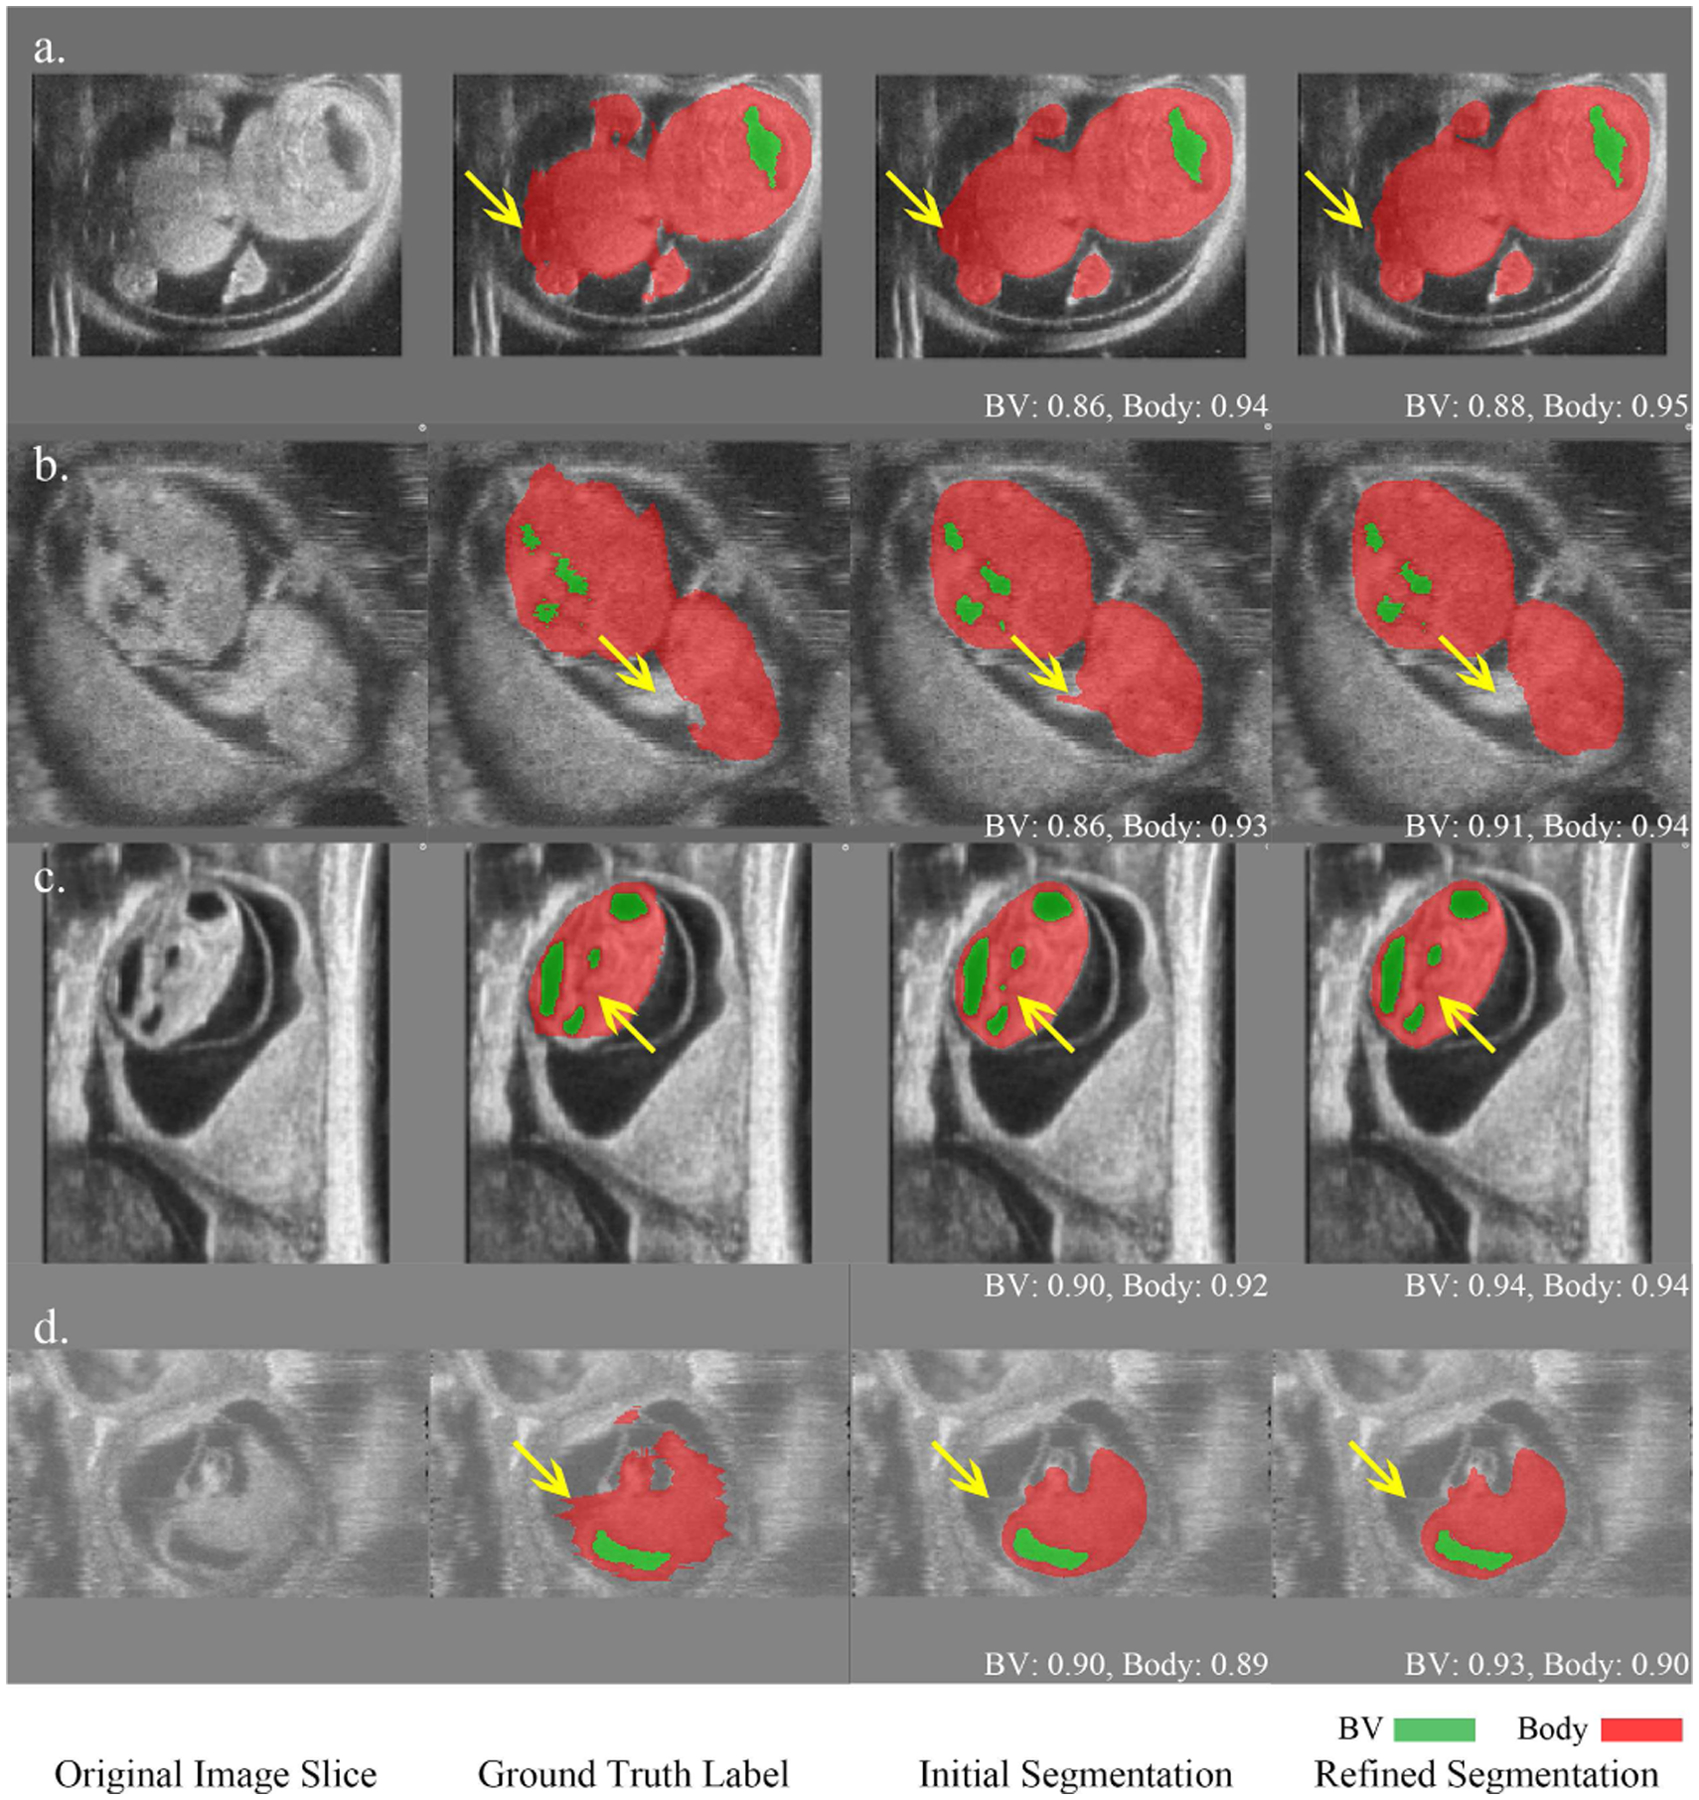
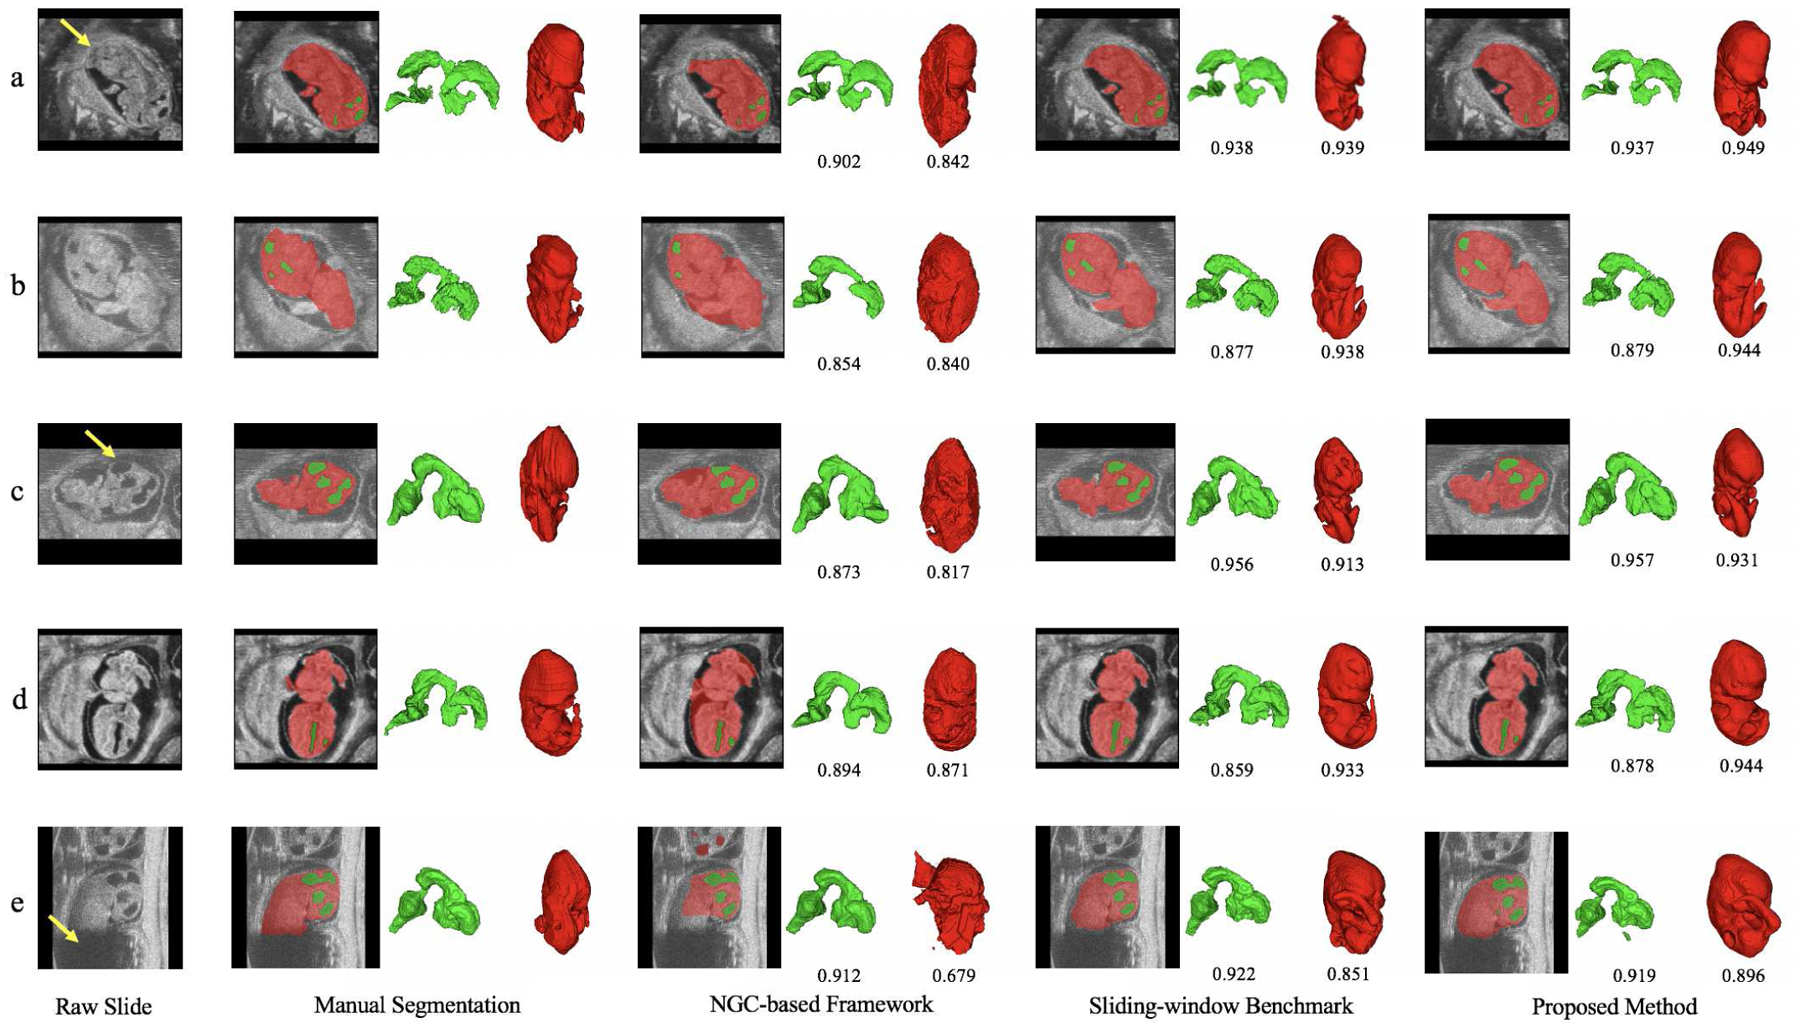
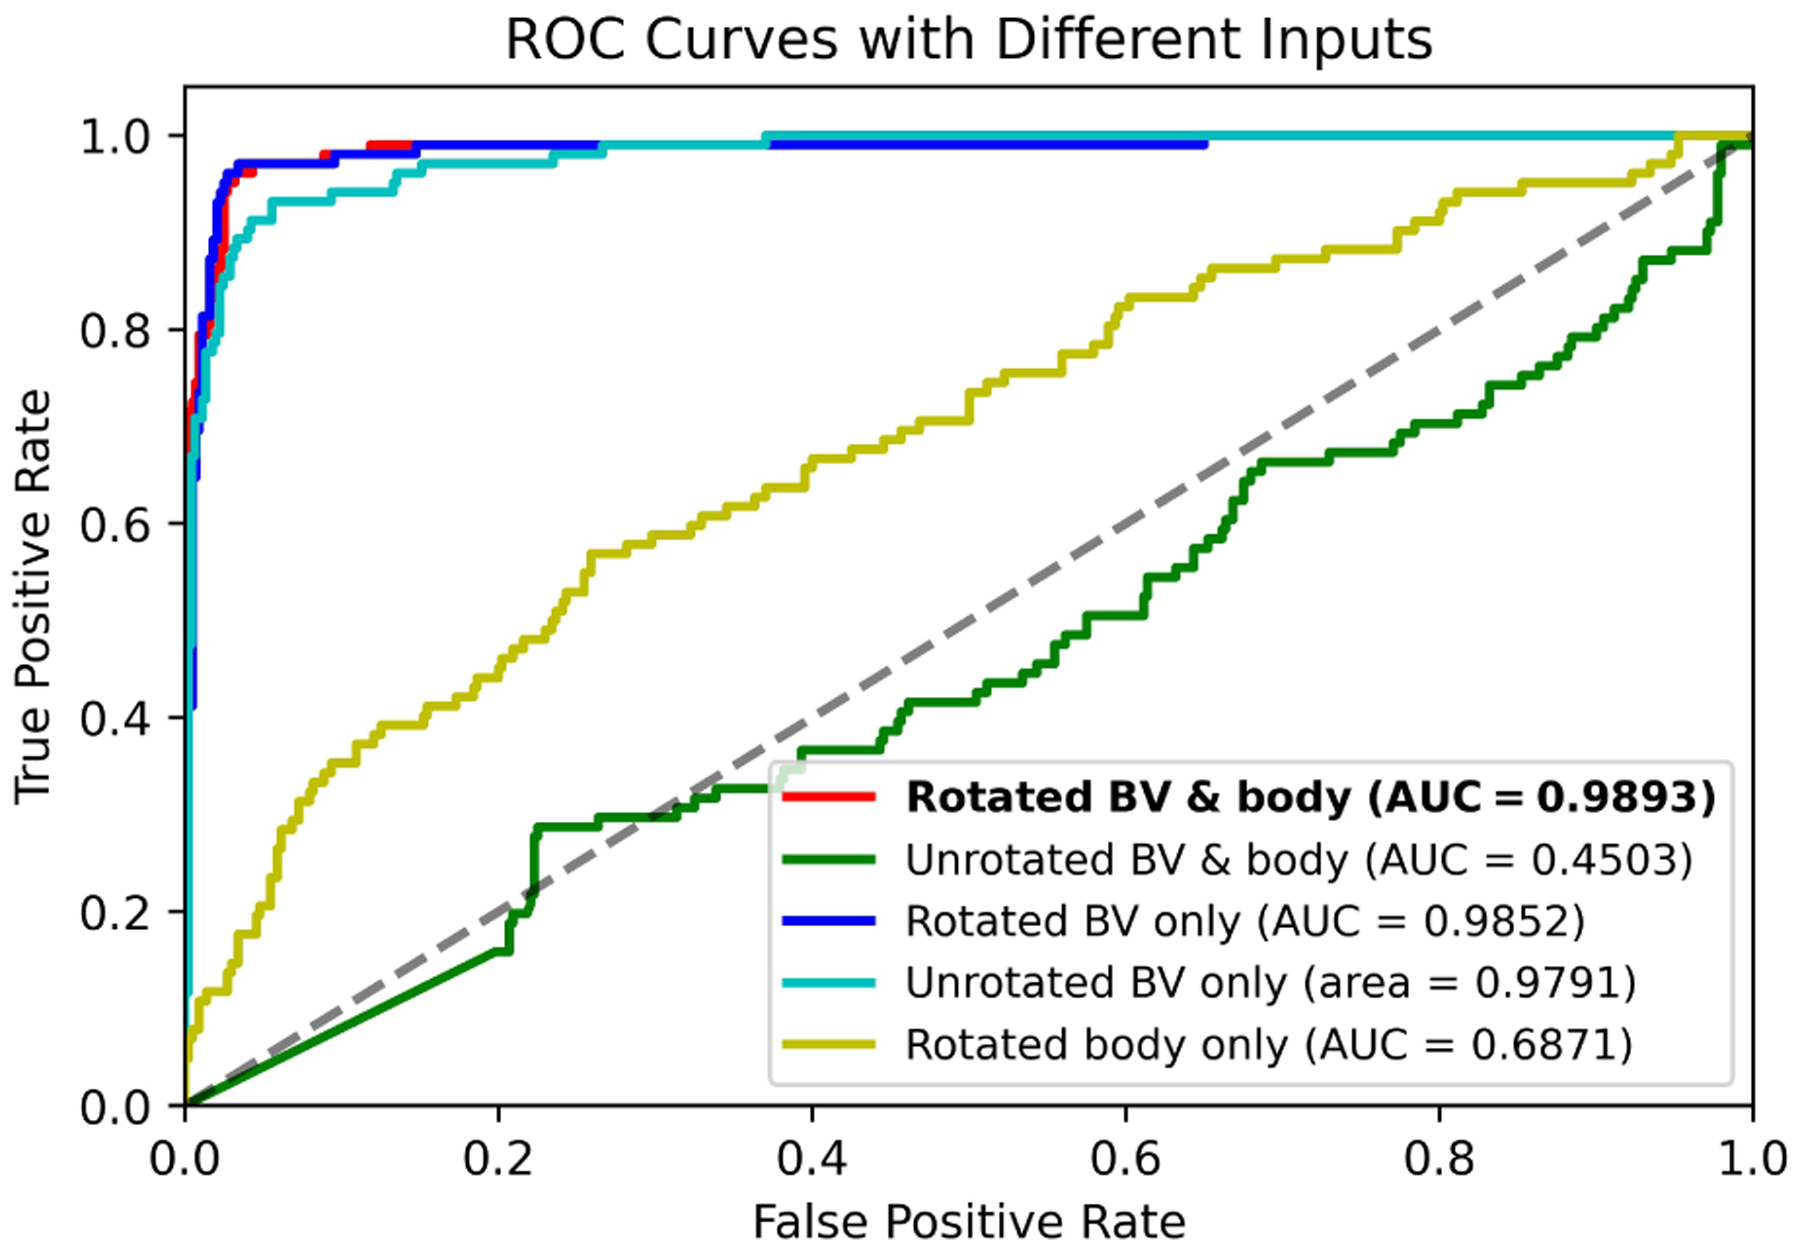
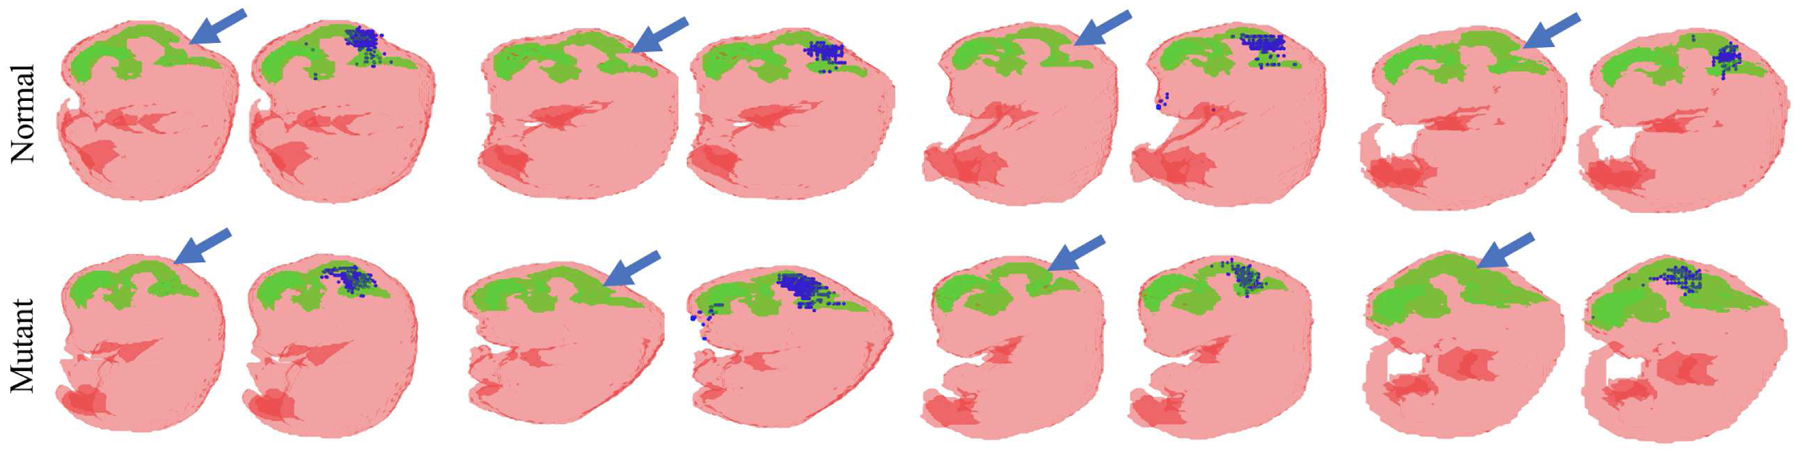
Segmentation and mutant classification of high-frequency ultrasound (HFU) mouse embryo brain ventricle (BV) and body images can provide valuable information for developmental biologists. However, manual segmentation and identification of BV and body requires substantial time and expertise. This article proposes an accurate, efficient and explainable deep learning pipeline for automatic segmentation and classification of the BV and body. For segmentation, a two-stage framework is implemented. The first stage produces a low-resolution segmentation map, which is then used to crop a region of interest (ROI) around the target object and serve as the probability map of the autocontext input for the second-stage fine-resolution refinement network. The segmentation then becomes tractable on high-resolution 3-D images without time-consuming sliding windows. The proposed segmentation method significantly reduces inference time (102.36-0.09 s/volume ≈ 1000× faster) while maintaining high accuracy comparable to previous sliding-window approaches. Based on the BV and body segmentation map, a volumetric convolutional neural network (CNN) is trained to perform a mutant classification task. Through backpropagating the gradients of the predictions to the input BV and body segmentation map, the trained classifier is found to largely focus on the region where the Engrailed-1 (En1) mutation phenotype is known to manifest itself. This suggests that gradient backpropagation of deep learning classifiers may provide a powerful tool for automatically detecting unknown phenotypes associated with a known genetic mutation.
Figures
Similar articles
-
DEEP MOUSE: AN END-TO-END AUTO-CONTEXT REFINEMENT FRAMEWORK FOR BRAIN VENTRICLE & BODY SEGMENTATION IN EMBRYONIC MICE ULTRASOUND VOLUMES.Proc IEEE Int Symp Biomed Imaging. 2020 Apr;2020:122-126. doi: 10.1109/isbi45749.2020.9098387. Epub 2020 May 22. Proc IEEE Int Symp Biomed Imaging. 2020. PMID: 33381278 Free PMC article.
-
DEEP BV: A FULLY AUTOMATED SYSTEM FOR BRAIN VENTRICLE LOCALIZATION AND SEGMENTATION IN 3D ULTRASOUND IMAGES OF EMBRYONIC MICE.IEEE Signal Process Med Biol Symp. 2018 Dec;2018:10.1109/SPMB.2018.8615610. doi: 10.1109/SPMB.2018.8615610. Epub 2019 Jan 17. IEEE Signal Process Med Biol Symp. 2018. PMID: 30911672 Free PMC article.
-
Ultrasonic Assessment of Liver Fibrosis Using One-Dimensional Convolutional Neural Networks Based on Frequency Spectra of Radiofrequency Signals with Deep Learning Segmentation of Liver Regions in B-Mode Images: A Feasibility Study.Sensors (Basel). 2024 Aug 26;24(17):5513. doi: 10.3390/s24175513. Sensors (Basel). 2024. PMID: 39275424 Free PMC article.
-
Automatic prostate segmentation using deep learning on clinically diverse 3D transrectal ultrasound images.Med Phys. 2020 Jun;47(6):2413-2426. doi: 10.1002/mp.14134. Epub 2020 Apr 8. Med Phys. 2020. PMID: 32166768
-
Deep learning-based automatic segmentation of images in cardiac radiography: A promising challenge.Comput Methods Programs Biomed. 2022 Jun;220:106821. doi: 10.1016/j.cmpb.2022.106821. Epub 2022 Apr 19. Comput Methods Programs Biomed. 2022. PMID: 35487181 Review.
Cited by
-
Longitudinal in Utero Analysis of Engrailed-1 Knockout Mouse Embryonic Phenotypes Using High-Frequency Ultrasound.Ultrasound Med Biol. 2023 Jan;49(1):356-367. doi: 10.1016/j.ultrasmedbio.2022.09.008. Epub 2022 Oct 22. Ultrasound Med Biol. 2023. PMID: 36283941 Free PMC article.
-
Deep learning multi-organ segmentation for whole mouse cryo-images including a comparison of 2D and 3D deep networks.Sci Rep. 2022 Sep 7;12(1):15161. doi: 10.1038/s41598-022-19037-3. Sci Rep. 2022. PMID: 36071089 Free PMC article.
-
From beasts to bytes: Revolutionizing zoological research with artificial intelligence.Zool Res. 2023 Nov 18;44(6):1115-1131. doi: 10.24272/j.issn.2095-8137.2023.263. Zool Res. 2023. PMID: 37933101 Free PMC article. Review.
-
Dental bur detection system based on asymmetric double convolution and adaptive feature fusion.Sci Rep. 2024 Dec 30;14(1):31874. doi: 10.1038/s41598-024-83241-6. Sci Rep. 2024. PMID: 39738621 Free PMC article.
-
Applications of Deep Learning Algorithms to Ultrasound Imaging Analysis in Preclinical Studies on In Vivo Animals.Life (Basel). 2023 Aug 16;13(8):1759. doi: 10.3390/life13081759. Life (Basel). 2023. PMID: 37629616 Free PMC article. Review.
References
-
- Wurst W, Auerbach AB, Joyner AL, “Multiple developmental defects in Engrailed-1 mutant mice: an early mid-hindbrain deletion and patterning defects in forelimbs and sternum,” in Development, vol. 120, no. 7, pp. 2065–75, 1994. - PubMed
-
- Kuo JW, Wang Y, Aristiz’abal O, Turnbull DH, Ketterling J, and Mamou J, “Automatic mouse embryo brain ventricle segmentation, gestation stage estimation, and mutant detection from 3D 40-MHz ultrasound data,” in Proc. IEEE Int. Ultrasonics Symp, 2015, pp. 1–4.
-
- Martínez-Martínez MA, Pacheco-Torres J, Borrell V, Canals S, “Phenotyping the central nervous system of the embryonic mouse by magnetic resonance microscopy”, NeuroImage, volume 97, pp. 95–106, 2014. - PubMed
Publication types
MeSH terms
Grants and funding
LinkOut - more resources
Full Text Sources
Other Literature Sources
