. 2021 May 10;6(9):e140382.
doi: 10.1172/jci.insight.140382.

LIN28B induces a differentiation program through CDX2 in colon cancer

Affiliations

LIN28B induces a differentiation program through CDX2 in colon cancer

Kensuke Suzuki et al. JCI Insight. .

Abstract

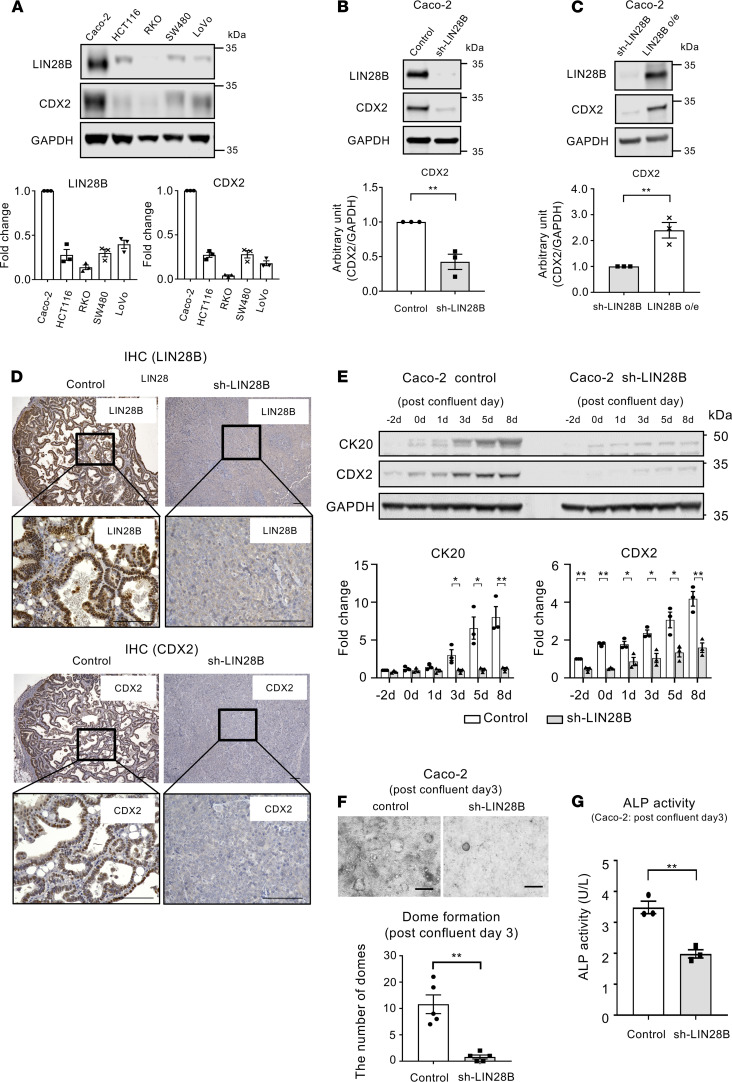
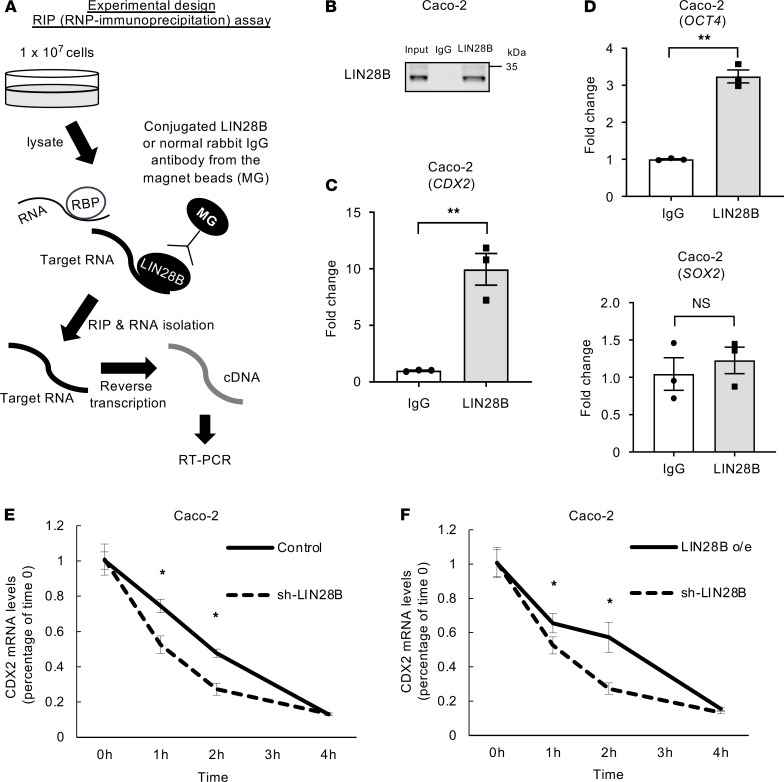
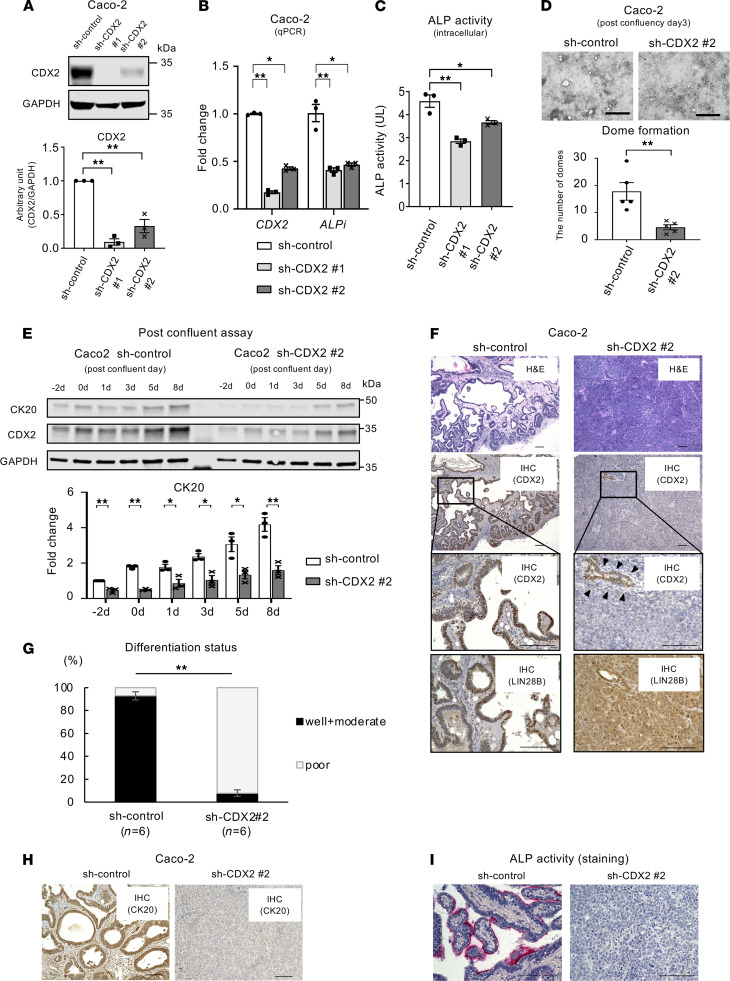
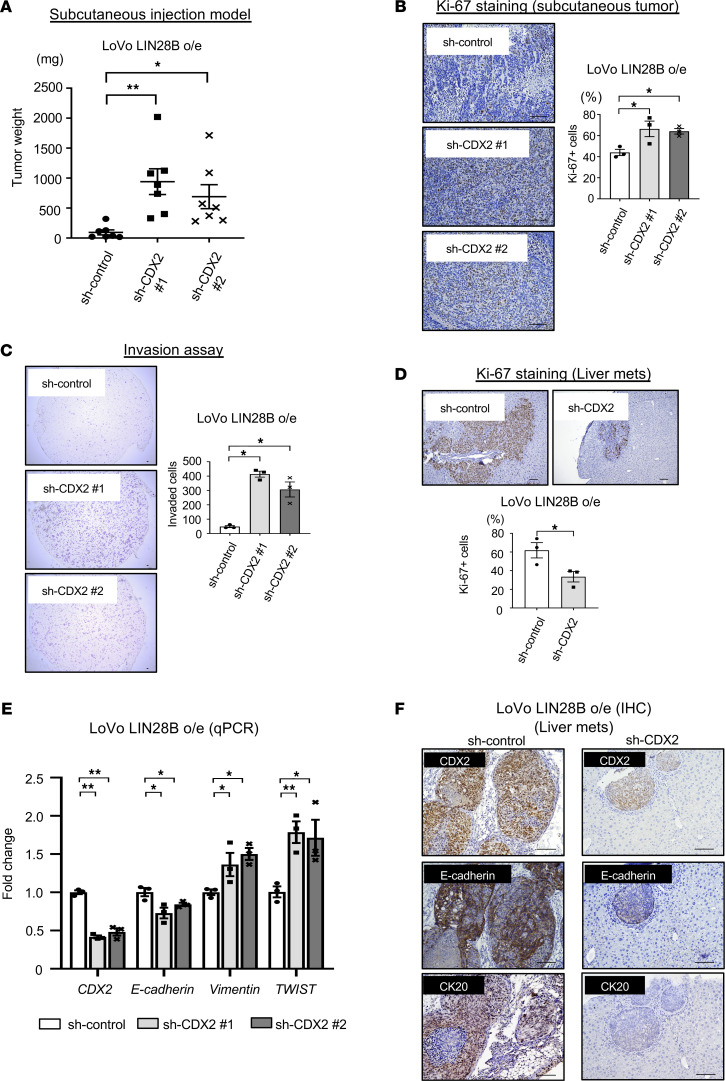
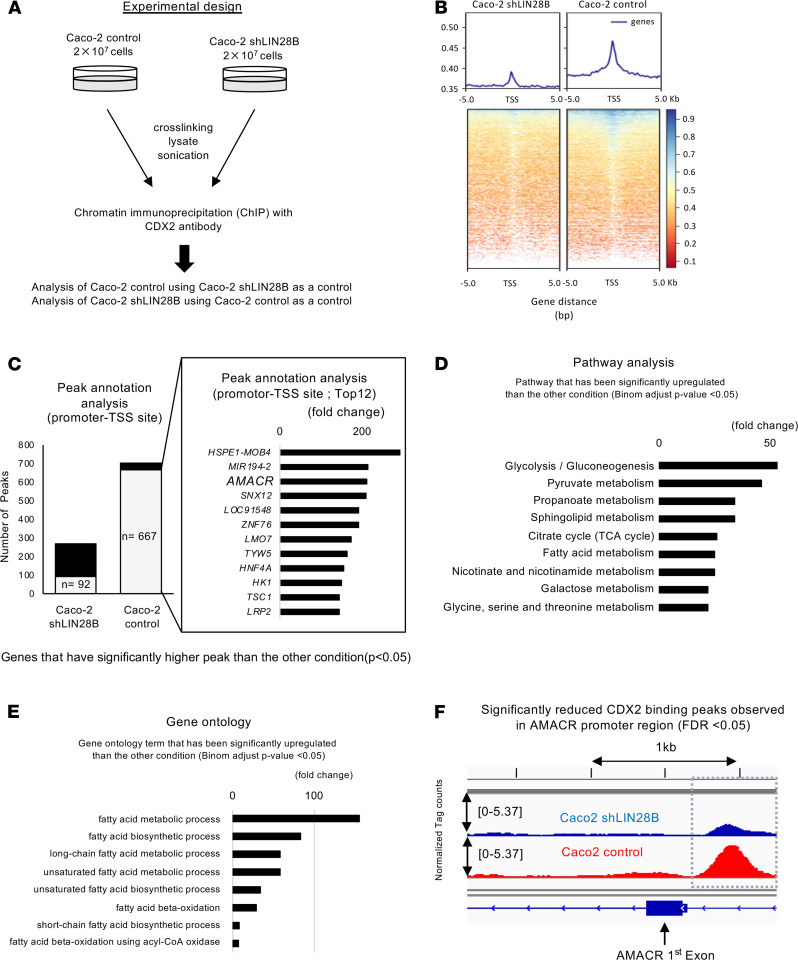
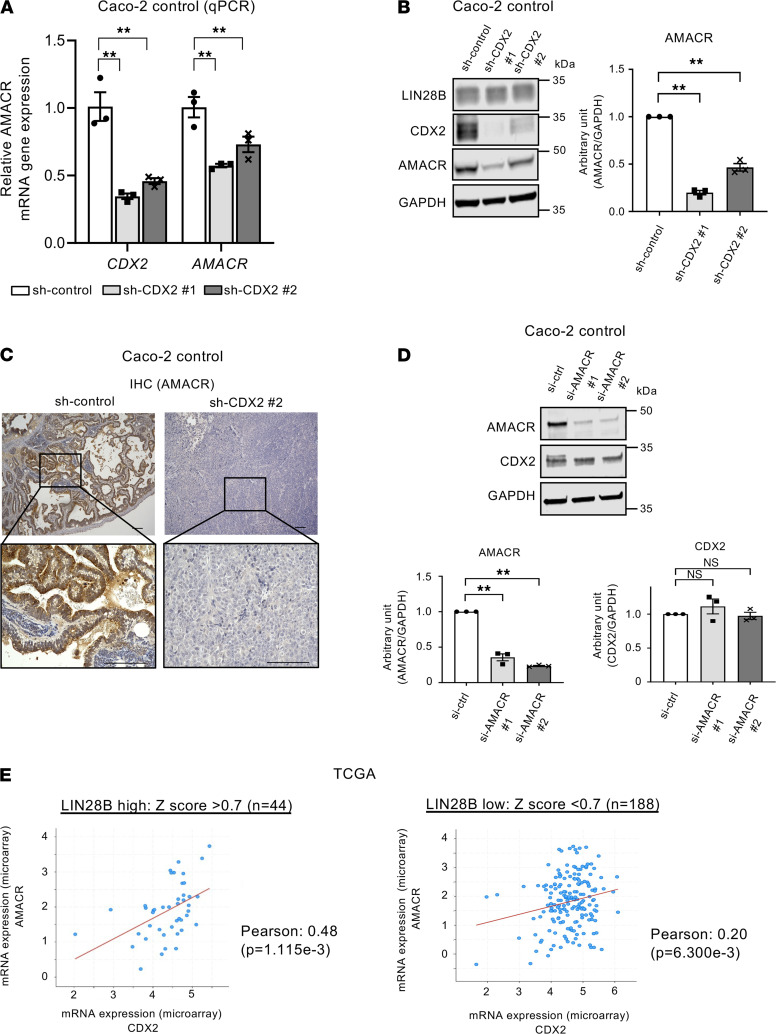
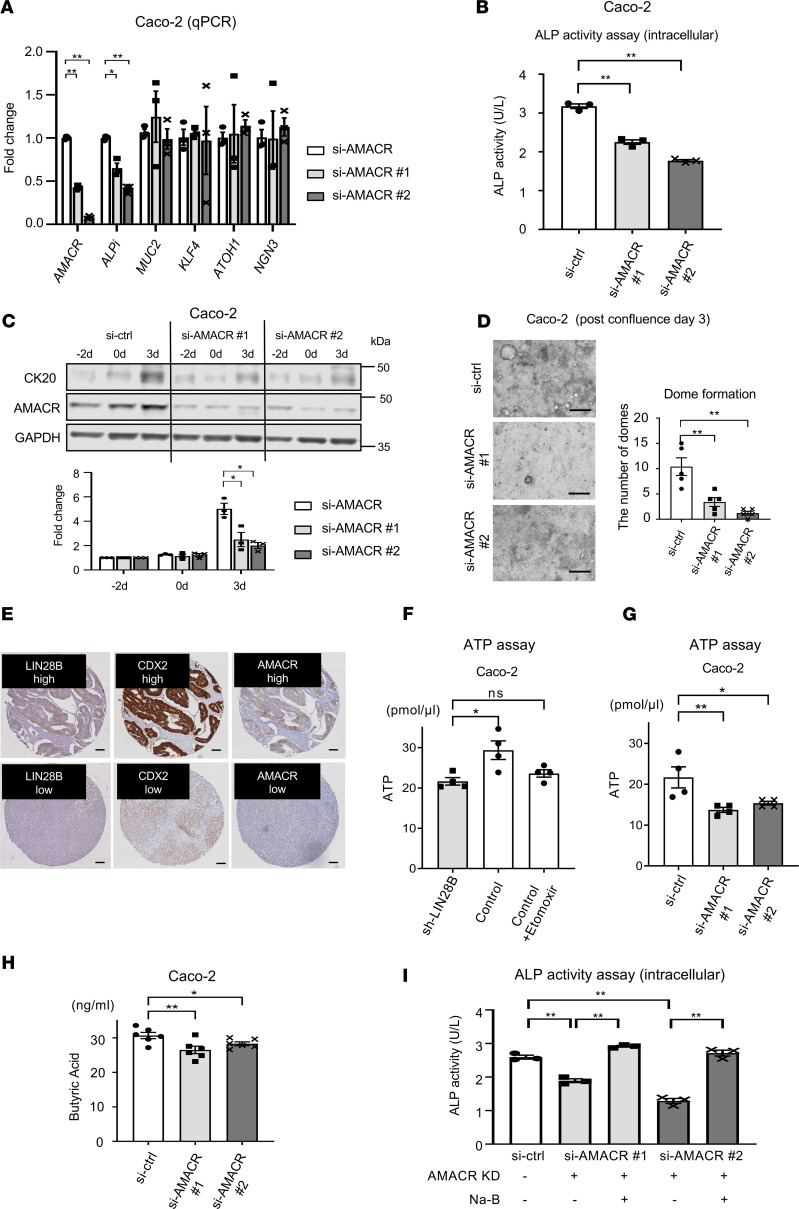
Most colorectal cancers (CRCs) are moderately differentiated or well differentiated, a status that is preserved even in metastatic tumors. However, the molecular mechanisms underlying CRC differentiation remain to be elucidated. Herein, we unravel a potentially novel posttranscriptional regulatory mechanism via a LIN28B/CDX2 signaling axis that plays a critical role in mediating CRC differentiation. Owing to a large number of mRNA targets, the mRNA-binding protein LIN28B has diverse functions in development, metabolism, tissue regeneration, and tumorigenesis. Our RNA-binding protein IP (RIP) assay revealed that LIN28B directly binds CDX2 mRNA, which is a pivotal homeobox transcription factor in normal intestinal epithelial cell identity and differentiation. Furthermore, LIN28B overexpression resulted in enhanced CDX2 expression to promote differentiation in subcutaneous xenograft tumors generated from CRC cells and metastatic tumor colonization through mesenchymal-epithelial transition in CRC liver metastasis mouse models. A ChIP sequence for CDX2 identified α-methylacyl-CoA racemase (AMACR) as a potentially novel transcriptional target of CDX2 in the context of LIN28B overexpression. We also found that AMACR enhanced intestinal alkaline phosphatase activity, which is known as a key component of intestinal differentiation, through the upregulation of butyric acid. Overall, we demonstrated that LIN28B promotes CRC differentiation through the CDX2/AMACR axis.

Keywords: Cell Biology; Colorectal cancer; Gastroenterology; Molecular biology.


Conflict of interest statement

Conflict of interest: The authors have declared that no conflict of interest exists.

Figures

Figure 1
Figure 1. LIN28B upregulates CDX2 expression in colorectal cancer.
(A) LIN28B and CDX2 expression in human colorectal cancer (CRC) cell lines by Western blotting (WB) analysis. Lower: the fold change of band intensity compared with the expression of target gene in Caco-2 cells (n = 3). (B) WB analysis of LIN28B and CDX2 in Caco-2 control and LIN28B knockdown (KD) cells. Lower: band intensities were normalized by densitometry to GAPDH (n = 3). (C) WB analysis of LIN28B and CDX2 in Caco-2 LIN28B KD and LIN28B long isoform expression (LIN28B o/e) cells. Lower: band intensities were normalized by densitometry to GAPDH (n = 3). (D) Representative IHC staining for LIN28B (left) and CDX2 (right) in the subcutaneous xenograft tumor of Caco-2 cells with control or LIN28B KD. Scale bars: 100 μm. (E) Upper: WB analysis of CK20 and CDX2 expression in Caco-2 cells with control or sh-LIN28B at the confluence time point. Lower: densitometry analysis. The value for CK20 or CDX2 at day –2 for the sh-control samples was referred to as 1. (F) Upper: representative image for dome formation in Caco-2 cell with control/LIN28B KD at postconfluence day 3. Scale bars: 500 μm. Lower: the graph indicates the number of domes. A dome was defined as greater than 100 μm diameter (n = 5). (G) ALP activity assay in Caco-2 control and LIN28B KD cells at postconfluence day 3 (n = 3). Data are presented as mean ± SEM. Unpaired, 2-tailed Student’s t tests were performed. *P < 0.05, **P < 0.01.
Figure 2
Figure 2. LIN28B stabilized CDX2 mRNA through direct binding.
(A) Experimental design of RIP assay. (B) Quality check of RNA immunoprecipitation (RIP) assay: analysis of LIN28B expression level by WB. The results of RIP assay by qRT-PCR of RIP materials for CDX2 (n = 3) (C), OCT4 (n = 3) (D; upper), and SOX2 (n = 3) (D; lower). mRNA stability assay in Caco-2 control and LIN28B KD cells (E) and in Caco-2 LIN28B KD and o/e cells (F) (n = 3). Data are presented as mean ± SEM. Unpaired, 2-tailed Student’s t tests were performed. *P < 0.05, **P < 0.01.
Figure 3
Figure 3. CDX2 regulates CRC tumor differentiation in the context of LIN28B overexpression.
(A) WB showing CDX2 KD using shCDX2 in Caco2 cells. Lower graph shows the densitometry normalized to GAPDH (n = 3). (B) CDX2 and ALPi expression (qPCR) in Caco-2 control/CDX2 KD cells (n = 3). (C) ALP activity assay in Caco-2 control/CDX2 KD cells (n = 3). (D) Upper: representative image for dome formation in Caco-2 control/CDX2 KD cells at postconfluence day 3. Scale bars: 500 μm. Right: the graph indicates the number of domes. A dome was defined as greater than 100 μm diameter (n = 5). (E) Upper: WB analysis of CK20 and CDX2 expression in Caco-2 cells with sh-control or sh-CDX2 at the confluence time point. Lower: densitometry. The value for CK20 at day 2 for the sh-control samples was referred to as 1 (n = 3). (F) Representative IHC in the subcutaneous xenograft tumor of Caco-2 cells with control or CDX2 KD for H&E (first panel), IHC of CDX2 (second and third panels), and IHC of LIN28B (fourth panel). (G) Cumulative ratio of differentiation status in subcutaneous xenograft tumors (n = 6). (H) Representative IHC of CK20 in the subcutaneous xenograft tumor of Caco-2 cells with control or CDX2 KD. (I) Representative ALP staining in the subcutaneous xenograft tumor of Caco-2 cells with control or CDX2 KD. Scale bars: 100 μm. Data are presented as mean ± SEM. Unpaired, 2-tailed Student’s t test (A, D, E, and G) or 1-way ANOVA followed by Dunnett’s multiple-comparison test as post hoc analysis (B and C) were performed. *P < 0.05, **P < 0.01.
Figure 4
Figure 4. CDX2 promotes metastatic CRC tumor colonization through mesenchymal-epithelial transition.
(A) Left: subcutaneous xenograft experiments with LoVo cells (n = 6 per cell type) showed a significant increase in tumor weight with CDX2 KD with sh-CDX2 no. 1 (472.38 ± 126.23 mg at euthanization) or sh-CDX2 no. 2 (353.38 ± 112.90 mg at euthanization) as compared with control cells (123.88 ± 48.86 mg at euthanization). Right: the images of tumors. Scale bars: 10 mm. (B) Ki-67 staining in the subcutaneous xenograft tumor of LoVo cells with control or CDX2 KD, representative images (upper) and the quantification (lower). Scale bars: 100 μm. n = 3. (C) Transwell chamber invasion assay of LoVo cells with control or CDX2 KD, representative images (upper) and the quantification (lower). Scale bars: 100 μm. n = 3. (D) Ki-67 staining in the liver metastatic tumor of LoVo cells with control or CDX2 KD, representative images (upper) and the quantification (lower). Scale bars: 100 μm. n = 3. (E) Epithelial-mesenchymal transition (EMT) marker expression (qPCR) in LoVo control/CDX2 KD cells (n = 3). (F) Representative IHC of CDX2, E-cadherin, and CK20 in the liver metastatic tumor of LoVo cells with control or CDX2 KD. Scale bars: 100 μm. Data are presented as mean ± SEM. Unpaired, 2-tailed Student’s t test (D) and 1-way ANOVA followed by Dunnett’s multiple-comparison test as post hoc analysis (A, B, C, and E) were performed. *P < 0.05, **P < 0.01.
Figure 5
Figure 5. CDX2 ChIP-Seq identifies AMACR as a novel target for the LIN28B/CDX2 axis.
(A) Experimental design of ChIP-Seq. (B) Heatmaps of CDX2 ChIP-Seq in Caco-2 cells with control or LIN28B KD. (C) Left: peak analysis annotated by promoter transcription starting sites; gray columns indicate the number of significant higher peaks compared with the other phenotype. Right: the gene list of peak annotation analysis. (D) Significant upregulated KEGG pathway analysis related to metabolism in Caco2 control cells compared with Caco2 LIN28B KD cells. (E) Significant upregulated gene ontology term analysis related to fatty acid metabolism in Caco2 control cells compared with Caco2 LIN28B KD cells. (F) CDX2 ChIP-Seq tag counts at the site of AMACR TSS promoter. The binomial test was performed with P < 0.05 as statistically significant (A and CE). CDX2 binding peaks were identified by applying FDR cutoff 0.05.
Figure 6
Figure 6. CDX2 expression has a positive correlation with AMACR expression in CRC in the context of LIN28B overexpression.
(A) CDX2 and AMACR expression (qPCR) in Caco-2 control/CDX2 KD cells (n = 3). (B) Left: WB analysis of CDX2 and AMACR in Caco-2 control and CDX2 KD cells. Right: band intensities were normalized by densitometry to GAPDH (n = 3). (C) Representative IHC staining for AMACR in the subcutaneous xenograft tumors of Caco-2 cells with control or CDX2 KD. Scale bars: 100 μm. (D) Left: WB analysis of CDX2 and AMACR in Caco-2 control and AMACR KD cells. Right: band intensities were normalized by densitometry to GAPDH (n = 3). (E) Correlation graph between mRNA expression of CDX2 and of AMACR in colon adenocarcinomas and rectal adenocarcinomas (COADREAD) datasets in The Cancer Genome Atlas (TCGA) in LIN28B high expression (upper) or LIN28B low expression (lower). Correlation of expression was determined via Pearson correlation coefficient test. Data are presented as mean ± SEM. One-way ANOVA followed by Dunnett’s multiple-comparison test as post hoc analysis (A, B, and D) or Pearson correlation coefficient test (E) was performed. *P <0.05, **P < 0.01.
Figure 7
Figure 7. AMACR promotes CRC cell differentiation in the context of LIN28B overexpression.
(A) qPCR for intestinal differentiation markers in Caco-2 control/AMACR KD Caco-2 cells (n = 3). (B) ALP activity assay in Caco-2 control/AMACR KD cells (n = 3). (C) Upper: WB analysis of AMACR and CK20 expression in Caco-2 cells with control or si-AMACR at the confluence time point. Lower: densitometry; the value for CK20 or CDX2 at –2 days for the sh-control samples was designated as 1. (D) Left: representative image for dome formation in Caco-2 cell at postconfluence day 3. Scale bars: 500 μm. Right: The graph indicates the number of domes. A dome was defined as greater than 100 μm diameter. (n = 5) (E) Representative IHC staining images of human CRC TMAs. (F) The ATP assay in Caco-2 with control and LIN28B KD cells (n = 4). (G) The ATP assay in Caco-2 with control and AMACR KD cells (n = 4). (H) Butyric acid measurement in Caco-2 with control and AMACR KD cells (n = 6). (I) ALP activity assay in Caco-2 control/AMACR KD cells with or without 1 mM sodium butyrate (Na-B) (n = 3). Data are presented as mean ± SEM. Unpaired, 2-tailed Student’s t test (F) and 1-way ANOVA followed by Dunnett’s multiple-comparison test as post hoc analysis (AD and G–I) were performed. *P < 0.05, **P < 0.01.

Similar articles

Cited by

References

    1. Muller-McNicoll M, Neugebauer KM. How cells get the message: dynamic assembly and function of mRNA-protein complexes. Nat Rev Genet. 2013;14(4):275–287. doi: 10.1038/nrg3434. - DOI - PubMed
    1. Hentze MW, et al. A brave new world of RNA-binding proteins. Nat Rev Mol Cell Biol. 2018;19(5):327–341. doi: 10.1038/nrm.2017.130. - DOI - PubMed
    1. Balzeau J, et al. The LIN28/let-7 pathway in cancer. Front Genet. 2017;8:31. - PMC - PubMed
    1. Chatterji P, Rustgi AK. RNA binding proteins in intestinal epithelial biology and colorectal cancer. Trends Mol Med. 2018;24(5):490–506. doi: 10.1016/j.molmed.2018.03.008. - DOI - PMC - PubMed
    1. Masuda K, Kuwano Y. Diverse roles of RNA-binding proteins in cancer traits and their implications in gastrointestinal cancers. Wiley Interdiscip Rev RNA. 2019;10(3):e1520. doi: 10.1002/wrna.1520. - DOI - PubMed

Publication types

MeSH terms