. 2021 May 3;131(9):e145700.
doi: 10.1172/JCI145700.

Pathogenic variants in TNNC2 cause congenital myopathy due to an impaired force response to calcium

Affiliations

Pathogenic variants in TNNC2 cause congenital myopathy due to an impaired force response to calcium

Martijn van de Locht et al. J Clin Invest. .

Abstract

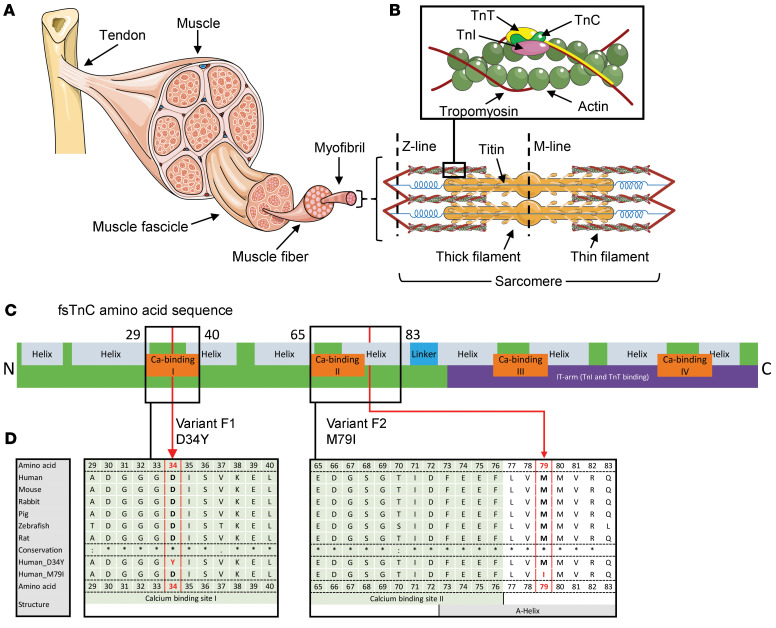
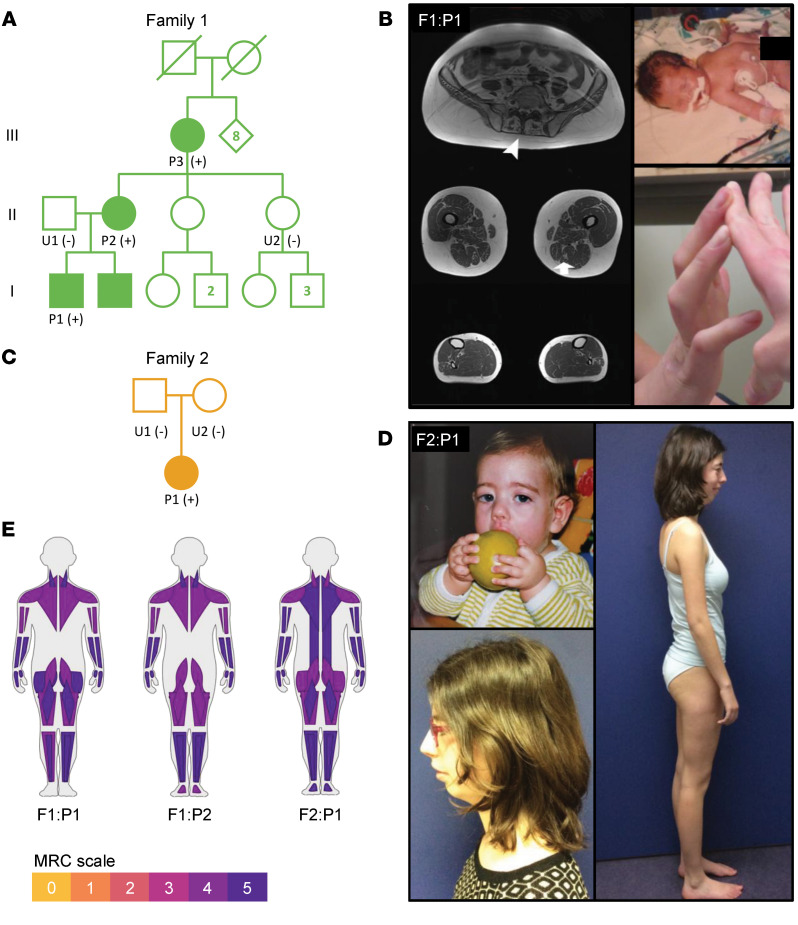
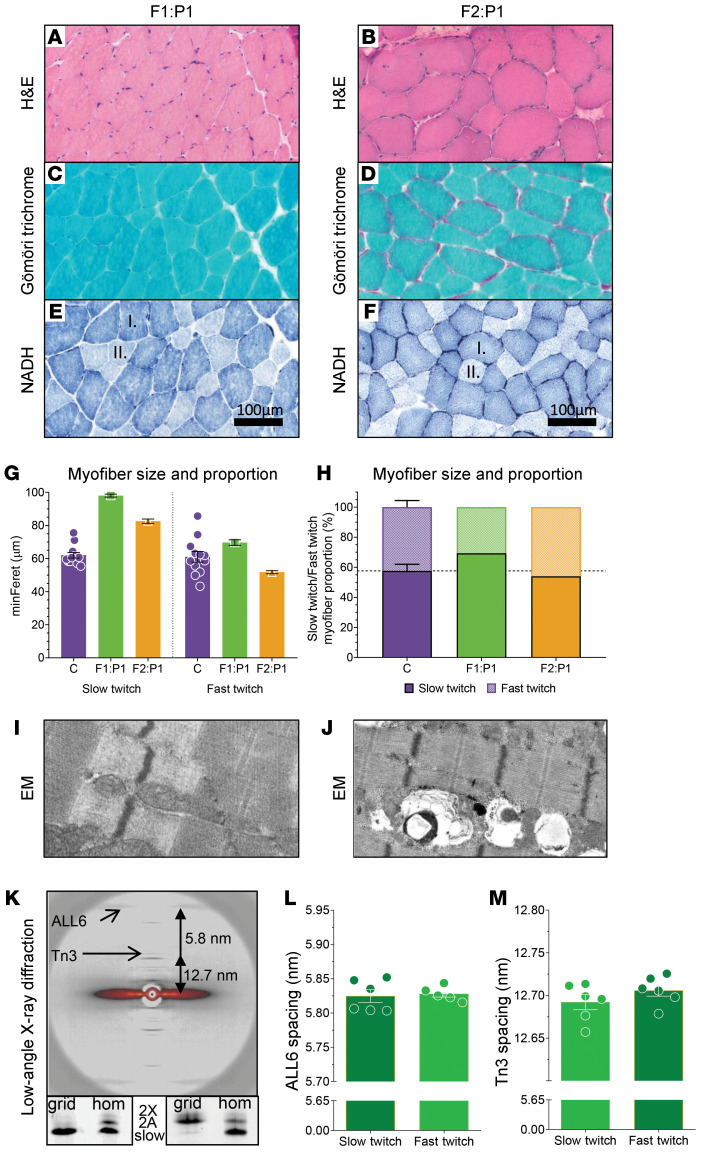
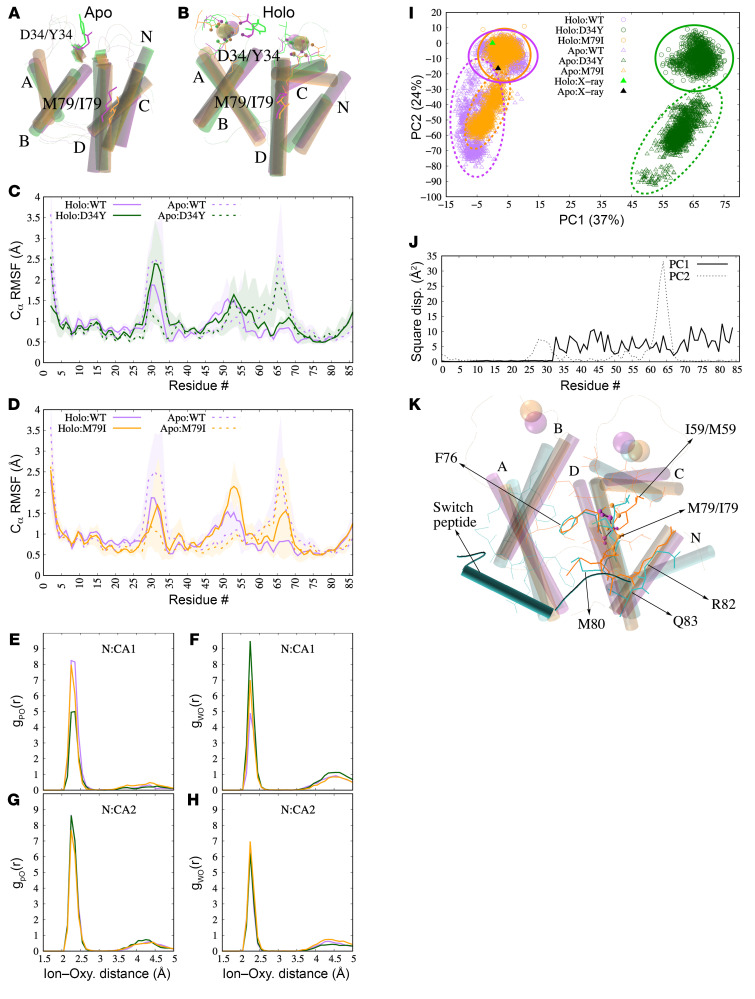
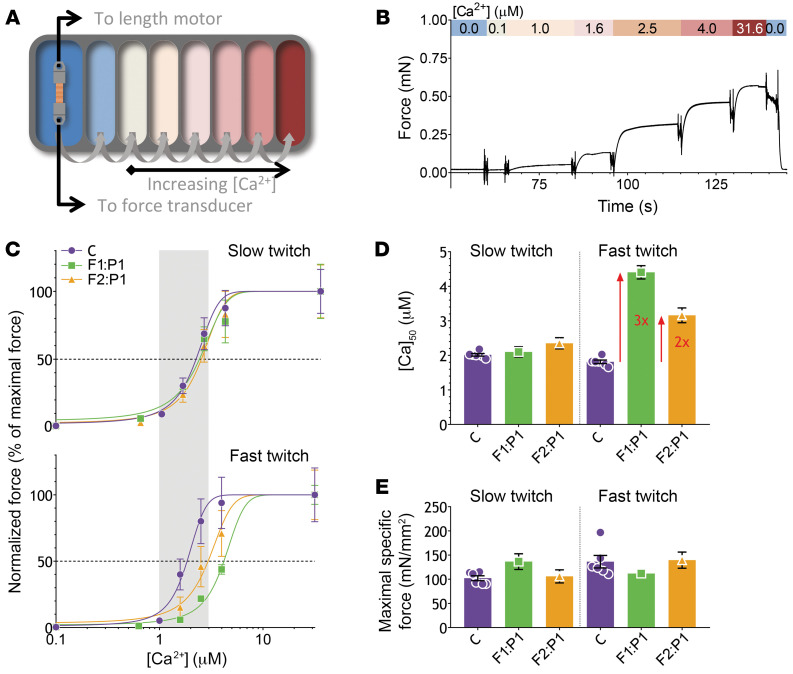
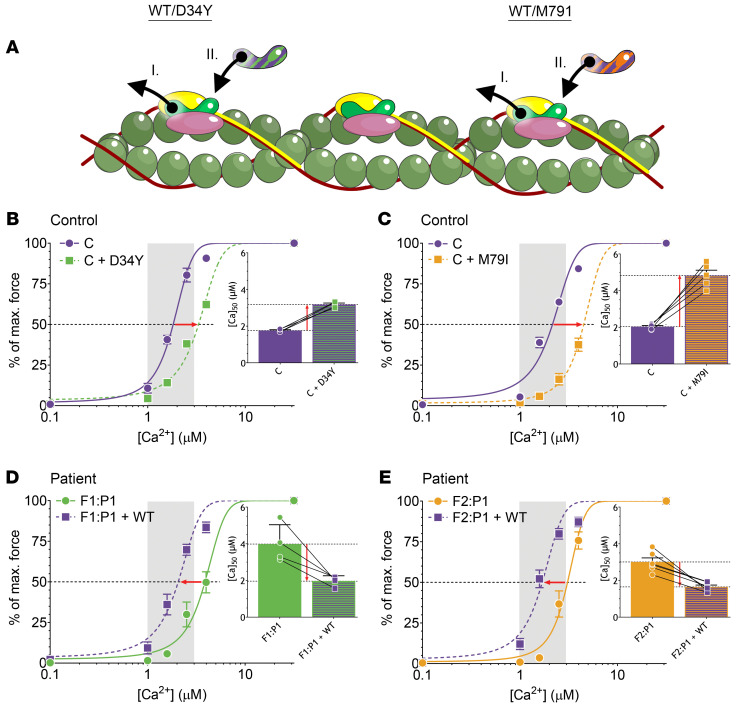
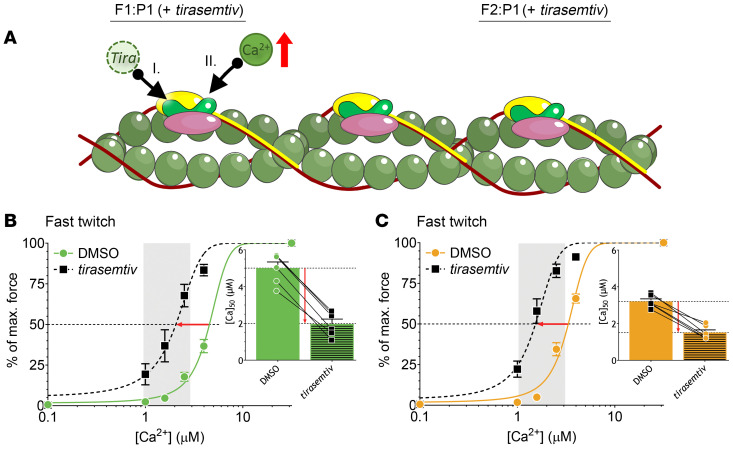
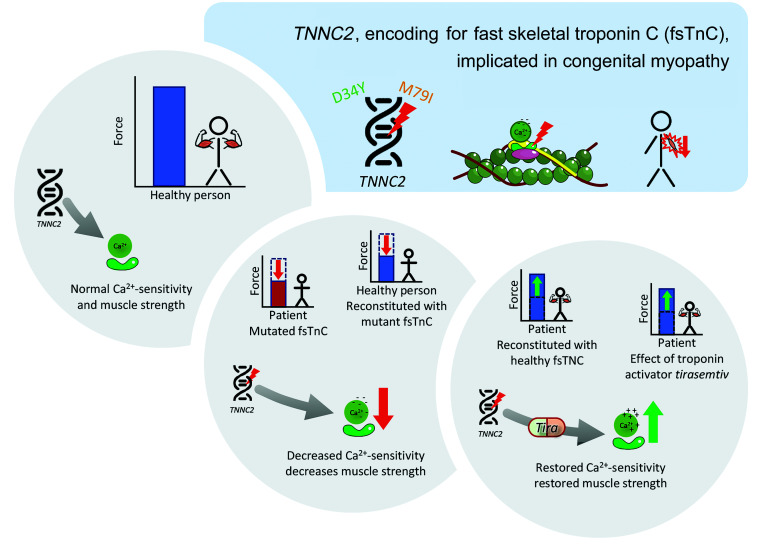
Troponin C (TnC) is a critical regulator of skeletal muscle contraction; it binds Ca2+ to activate muscle contraction. Surprisingly, the gene encoding fast skeletal TnC (TNNC2) has not yet been implicated in muscle disease. Here, we report 2 families with pathogenic variants in TNNC2. Patients present with a distinct, dominantly inherited congenital muscle disease. Molecular dynamics simulations suggested that the pathomechanisms by which the variants cause muscle disease include disruption of the binding sites for Ca2+ and for troponin I. In line with these findings, physiological studies in myofibers isolated from patients' biopsies revealed a markedly reduced force response of the sarcomeres to [Ca2+]. This pathomechanism was further confirmed in experiments in which contractile dysfunction was evoked by replacing TnC in myofibers from healthy control subjects with recombinant, mutant TnC. Conversely, the contractile dysfunction of myofibers from patients was repaired by replacing endogenous, mutant TnC with recombinant, wild-type TnC. Finally, we tested the therapeutic potential of the fast skeletal muscle troponin activator tirasemtiv in patients' myofibers and showed that the contractile dysfunction was repaired. Thus, our data reveal that pathogenic variants in TNNC2 cause congenital muscle disease, and they provide therapeutic angles to repair muscle contractility.

Keywords: Calcium signaling; Genetic diseases; Genetics; Muscle Biology; Neuromuscular disease.


Conflict of interest statement

Conflict of interest: The authors have declared that no conflict of interest exists.

Figures

Figure 1
Figure 1. Muscle structure.
(A) Sarcomeres are the smallest contractile units in muscle, consisting of myosin-based thick filaments and actin-based thin filaments decorated with the regulatory proteins troponin (Tn) and tropomyosin. (B) Magnification of the Tn complex, consisting of TnC, TnT, and TnI, and tropomyosin on the actin-based thin filament. The images are modified from Servier Medical ART, licensed under a Creative Commons Attribution 3.0 generic license (58). (C) Schematic representation of the amino acid sequence of fsTnC; N = N-terminus; C = C-terminus. Both patient variants are indicated [F1:P1, c.100G>T, p.(Asp34Tyr), D34Y; F2:P1, c.237G>C, p.(Met79Ile), M79I]. (D) Alignment of the fsTnC amino acid sequence in various species. The mutated residues are outlined in red.
Figure 2
Figure 2. Pedigrees and clinical description of F1:P1 and F2:P1.
(A) Pedigree of family 1 showing multiple affected relatives in different generations, consistent with autosomal dominant inheritance. The + and – symbols in parentheses indicate positive and negative for the TNNC2 c.100G>T; p.D34Y missense variant by Sanger sequencing. Circles indicate female, squares indicate male, clinically affected relatives are shaded green, and unaffected relatives are unfilled white. (B) Left: Muscle MRI imaging of F1:P1. T1-axial images of the lower extremities show mild, focal fatty infiltration of different muscles in a patchy and heterogeneous pattern (arrows). Paraspinal muscles are significantly affected in F1:P1 (top left, arrowheads). Proximal thigh muscles (middle left) are more affected than lower leg muscles (bottom left). Right: Photograph of F1:P1 at age 6 weeks with hypotonia and lower-extremity weakness (top right) and at age 26 years with contractures of the long finger flexors (bottom right). (C) Pedigree of family 2. (D) Photograph of F2:P1 as an infant indicating weakness in the facial muscles (top left) and at age 19 years with normal muscle mass and retrognathia. (E) Visualization of muscle weakness using MuscleViz (https://muscleviz.github.io), based on the MRC scores (59).
Figure 3
Figure 3. Histology of F1:P1 spinal accessory muscle biopsy at age 16 years (left) and F2:P1 vastus lateralis muscle biopsy at age 9 years (right).
(A and B) H&E staining shows mild myofiber size variability in both patients. (C and D) Gömöri trichrome staining shows no signs of nemaline rods in myofibers of both patients. (E and F) Staining of NADH in muscle cross sections shows larger slow-twitch fibers (dark blue, indicated with “I.”) than fast-twitch fibers (light blue, indicated with “II.”) in both patients. (G) Graph showing the myofiber minFeret of slow-twitch versus fast-twitch myofibers in control subjects (C), F1:P1, and F2:P1. (H) Graph showing the proportion of slow-twitch versus fast-twitch myofibers in control subjects (C), F1:P1, and F2:P1. The dark shading indicates the proportion of slow-twitch fibers and the light shading indicates the proportion of fast-twitch fibers. (I and J) Electron microscopy images show no abnormalities, and an intact myofibrillar structure in both patients. (K) Top: Typical example of a low-angle x-ray diffraction pattern obtained from 28 fast-twitch myofibers of F1:P1 mounted and aligned in 1 plane between 2 halves of an electron microscopy grid. Note the well-resolved equatorial and meridional reflections. Arrows indicate the actin layer line 6 (ALL6) and Tn3 reflections. Bottom: Myosin heavy chain isoform composition of the myofibers in the grids, showing successful segregation of fast- and slow-twitch fibers from F1:P1 (grid = protein content of F1:P1 grids; hom = muscle homogenate from human diaphragm muscle; 2X and 2A = fast-twitch myosin heavy chain isoforms; slow = slow-twitch myosin heavy chain isoform). Spacing of the ALL6 reflection (L) and the Tn3 reflection (M) are comparable between slow- and fast-twitch myofibers. Each symbol represents data from 1 set of grids containing 28 myofibers. Data are depicted as mean ± SEM.
Figure 4
Figure 4. Results of the molecular dynamics simulations.
(A and B) Superposition of N-domains of MD-predicted apo (A) and holo (B) variants. WT, D34Y, and M79I variants are colored purple, green, and orange, respectively. Helices N (residues 2–11), A (residues 14–27), B (residues 40–48), C (residues 54–63), and D (residues 74–85) of the N-domain are labeled. Protein oxygens within 2.5 Å of Ca2+ are shown as spheres and their respective residues as sticks. (C and D) Root mean squared fluctuations (RMSFs) of N-terminal domain residues. Holo and apo systems are represented as lines and broken lines, respectively. WT is compared against D34Y and M79I in C and D, respectively. Shaded regions reflect standard deviations. (EH) Radial distribution of protein (E and G) and solvent (F and H) oxygens around bound Ca2+ ions in the fsTnC N-terminal domains from the final 50 ns of each trajectory. gPO(r) and gWO(r) are the radial distribution functions of the protein and water oxygen atoms around the bound calcium, respectively. N:CA1, N-terminal calcium-binding pocket 1; N:CA2, N-terminal calcium-binding pocket 2. (I and J) Principal component (PC) analysis of the fsTnC2 N-domain MD trajectory data (J). Square displacements signify the relative contribution of each amino acid to PC1 (solid) or PC2 (dashed) (K). PC1 reflects the displacement of helices B–D, while PC2 corresponds to the loop connecting the C and D helices. These PCs demonstrate that the apo structures exhibit different displacements, or conformations, than the holo structures, and the D34Y variant samples a very different conformation than the WT and the M79I variants. (K) Cartoon diagram of the MD-predicted structures for holo WT-fsTnC (purple), holo M79I-fsTnC (orange), and holo cTnC with switch peptide (cyan). The structures of WT- and M79I-fsTnC are from the MD simulations; for cTnC the PDB 1MXL structure was used. Residues that are within 4 Å of the TnI switch peptide in cTnC are shown as cyan sticks, and residues within 4 Å of M79/I79 in holo M79I-fsTnC are shown as orange sticks. Residues that overlap between the 2 are shown as thick sticks. M79/I79 is shown in ball and stick representation.
Figure 5
Figure 5. The experimental design and results of the myofiber contractility experiments.
(A) Schematic representation of the contractility setup. An isolated single myofiber between aluminum T-clips is mounted between a force transducer and length motor. The fiber is subsequently passed through the baths filled with solutions with increasing [Ca2+]. (B) Typical tracing showing the force response to the increasing [Ca2+], followed by the protocol in which a rapid release and restretch (kTR) and short-length perturbations (active stiffness) were imposed on the myofibers ([Ca2+], kTR, and active stiffness are indicated in the colored bar). Data shown are from a control myofiber (fast twitch, CSA = 0.0054 mm2). (C) The force-[Ca2+] relationship, showing the average of all slow-twitch (top) and fast-twitch (bottom) control myofibers (C) versus the slow-twitch and fast-twitch myofibers from F1:P1 and F2:P1. The physiological [Ca2+] range is indicated by the gray bar. (D) The [Ca2+] at which 50% of maximal force is reached. (E) The maximal force normalized to myofiber CSA (i.e., specific force). Data are depicted as mean ± SEM.
Figure 6
Figure 6. The experimental design and results of the reconstitution of myofibers with recombinant fsTnC.
(A) The schematic depicts the thin filament with troponin complex in which (I) endogenous fsTnC is removed from fast-twitch myofibers, followed by (II) reconstitution with exogenous fsTnC. (B and C) Normalized force-[Ca2+] relationships of myofibers from control subjects before and after reconstitution with recombinant D34Y-fsTnC (B) and M79I-fsTnC (C). Insets show the [Ca2+] at which 50% of maximal force is reached. (D and E) Normalized force-[Ca2+] relationships of myofibers from F1:P1 (D) and F2:P1 (E) before and after reconstitution with recombinant WT-fsTnC. Insets show the [Ca2+] at which 50% of maximal force is reached. The physiological [Ca2+] range is indicated by the vertical gray bar. Data are depicted as mean ± SEM.
Figure 7
Figure 7. Experimental design and results for myofibers of controls (C), F1:P1, and F2:P2 exposed to DMSO and tirasemtiv.
(A) Schematic depiction of a thin filament section including 1 troponin subunit illustrating the Ca2+-sensitizing effect of tirasemtiv: tirasemtiv is added to the pCa solution (I), enhancing Ca2+ binding to troponin in fast-twitch myofibers (II). (B and C) Normalized force-[Ca2+] relationships of fast-twitch myofibers of F1:P1 (B) and F2:P1 (C) before and during exposure to 10 μM tirasemtiv. Insets show the [Ca2+] at which 50% of maximal force is reached. The physiological [Ca2+] range is indicated by the vertical gray bar. Data are depicted as mean ± SEM.
Figure 8
Figure 8. Graphical summary of the pathomechanism in TNNC2-related congenital myopathy.

Similar articles

Cited by

References

    1. Gordon AM, et al. Regulation of contraction in striated muscle. Physiol Rev. 2000;80(2):853–924. doi: 10.1152/physrev.2000.80.2.853. - DOI - PubMed
    1. Li A, et al. Skeletal MyBP-C isoforms tune the molecular contractility of divergent skeletal muscle systems. Proc Natl Acad Sci U S A. 2019;116(43):21882–21892. doi: 10.1073/pnas.1910549116. - DOI - PMC - PubMed
    1. Jungbluth H, et al. Congenital myopathies: disorders of excitation-contraction coupling and muscle contraction. Nat Rev Neurol. 2018;14(3):151–167. doi: 10.1038/nrneurol.2017.191. - DOI - PubMed
    1. De Winter JM, et al. KBTBD13 is an actin-binding protein that modulates muscle kinetics. J Clin Invest. 2020;130(2):754–767. doi: 10.1172/JCI124000. - DOI - PMC - PubMed
    1. Solaro RJ. Troponin C — troponin I interactions and molecular signalling in cardiac myofilaments. Adv Exp Med Biol. 1995;382:109–115. doi: 10.1007/978-1-4615-1893-8_12. - DOI - PubMed

Publication types