. 2021 May 10;6(9):e146148.
doi: 10.1172/jci.insight.146148.

Patterns and persistence of SARS-CoV-2 IgG antibodies in Chicago to monitor COVID-19 exposure

Affiliations

Patterns and persistence of SARS-CoV-2 IgG antibodies in Chicago to monitor COVID-19 exposure

Alexis R Demonbreun et al. JCI Insight. .

Abstract

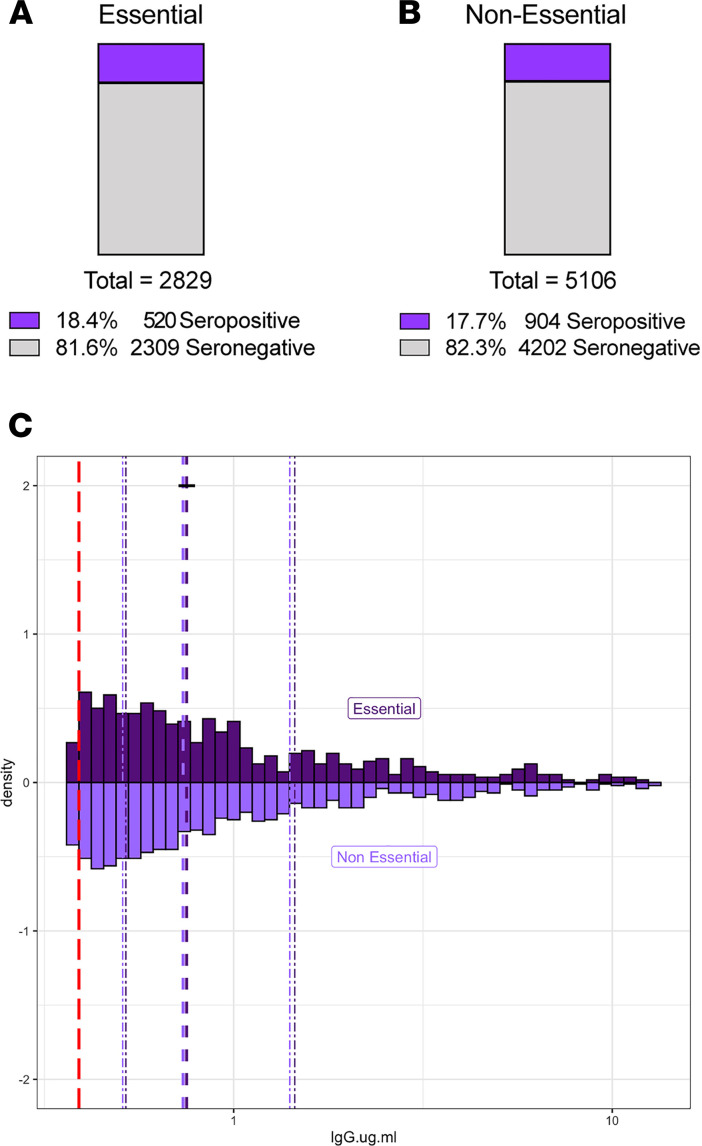
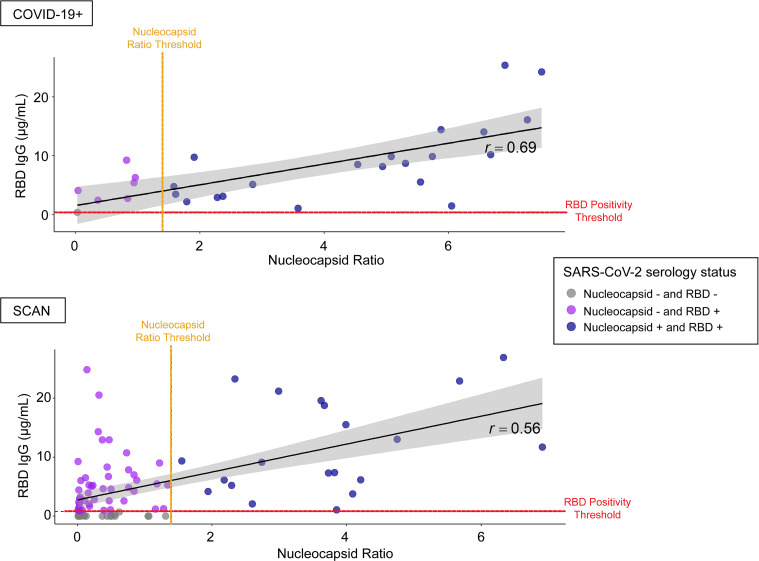
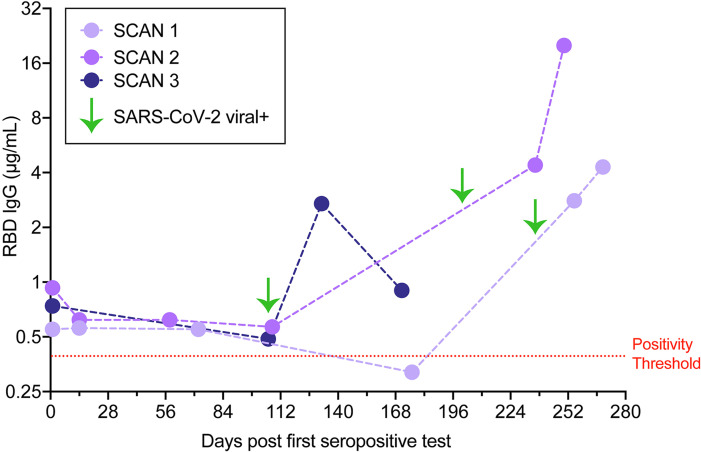
BACKGROUNDEstimates of seroprevalence to SARS-CoV-2 vary widely and may influence vaccination response. We ascertained IgG levels across a single US metropolitan site, Chicago, from June 2020 through December 2020.METHODSParticipants (n = 7935) were recruited through electronic advertising and received materials for a self-sampled dried-blood spot assay through the mail or a minimal contact in-person method. IgG against the receptor-binding domain of SARS-CoV-2 was measured using an established highly sensitive and highly specific assay.RESULTSOverall seroprevalence was 17.9%, with no significant difference between method of contact. Only 2.5% of participants reported having had a diagnosis of COVID-19 based on virus detection, consistent with a 7-fold greater exposure to SARS-CoV-2 measured by serology than that detected by viral testing. The range of IgG level observed in seropositive participants from this community survey overlapped with the range of IgG levels associated with COVID-19 cases having a documented positive PCR test. From a subset of those who participated in repeat testing, half of seropositive individuals retained detectable antibodies for 3 to 4 months.CONCLUSIONQuantitative IgG measurements with a highly specific and sensitive assay indicated more widespread exposure to SARS-CoV-2 than observed by viral testing. The range of IgG concentrations produced from these asymptomatic exposures was similar to IgG levels occurring after documented nonhospitalized COVID-19, which were considerably lower than those produced from hospitalized COVID-19 cases. The differing ranges of IgG response, coupled with the rate of decay of antibodies, may influence response to subsequent viral exposure and vaccine.FundingNational Science Foundation grant 2035114, NIH grant 3UL1TR001422-06S4, NIH National Center for Advancing Translational Sciences grants UL1 TR001422 and UL1 TR002389, Dixon Family Foundation, Northwestern University Cancer Center (NIH grant P30 CA060553), and Walder Foundation's Chicago Coronavirus Assessment Network.

Keywords: COVID-19; Immunoglobulins.


Conflict of interest statement

Conflict of interest: TWM has a financial interest in EnMed Microanalytics, a company that specializes in laboratory testing of dried-blood spot samples.

Figures

Figure 1
Figure 1. Flow diagram for recruitment into Screening for Coronavirus Antibodies in Neighborhoods studies.
Participants were recruited to enter queries to the Screening for Coronavirus Antibodies in Neighborhoods (SCAN) website through social media, news coverage, and paid advertising with focus on zip codes throughout Chicago. Individuals were screened for eligibility based on living in specific zip codes and recruited to promote a racially/ethnically mixed cohort, with adequate representation of men and women, and then invited to complete a health questionnaire survey. Dried-blood spot kits were sent to all eligible participants who completed the survey. These participants received and returned dried-blood spot kits through the mail (no contact method) with an 85% return rate. A second cohort was recruited by email through the Northwestern’s Feinberg School of Medicine (FSM), and these individuals received blood spot kits in person and returned kits on site (contact method) with a 74% return rate.
Figure 2
Figure 2. Quantitative measure of IgG directed to the receptor-binding domain of SARS-CoV-2 spike glycoprotein.
Samples were acquired through Screening for Coronavirus Antibodies in Neighborhood (SCAN) between June 2020 and December 2020 (n = 7935). (A) Samples acquired before 2019 constituted the negative, pre-COVID group (leftmost column; black dots; median, 0.09 μg/ml), and the mean IgG was similar to that in the SCAN seronegative group (second column; gray dots; median, 0.09 μg/ml). The median IgG range in SCAN seropositive samples (middle column; light purple) was 0.75 μg/ml. The median IgG range in outpatient, nonhospitalized COVID-19 samples (4th column, dark purple) was 5.2 μg/ml. The range between SCAN seropositive and outpatient COVID-19 samples showed significant overlap. Both SCAN seropositive and outpatient COVID-19 cases had much lower IgG levels than ICU-hospitalized COVID-19 cases (rightmost column, dark blue, median 98.5 μg/ml). The SARS-CoV-2 receptor-binding domain (RBD) IgG ELISA seropositive threshold is marked by the red line at 0.39 μg/ml, as validated previously (16). *P < 0.0001, comparing seropositive groups, by Wilcoxon-Mann-Whitney test. Both true negatives and the SCAN seronegative groups were significantly different compared with all seropositive groups. (B) 17.95% (1424 of 7935) of SCAN samples were seropositive. (C) 2.46% (195 of 7935) reported having a positive SARS-CoV-2 viral diagnostic test.
Figure 3
Figure 3. Similar rates of SARS-CoV-2 RBD IgG seropositivity between those who reported working outside the home and those working from home.
7935 unique SCAN community-acquired samples were acquired between June and December 2020 from the Chicago area. Participants self-reported whether they left their residence for work (essential) and interacted with coworkers/public. (A and B) Reported groups of essential workers and those working from home (nonessential) have similar percent seropositivity, at 18.4 % and 17.7%, respectively. (C) Essential (n = 520) and nonessential (n = 904) groups had similar distributions of SARS-CoV-2 RBD IgG seropositivity, with a median of 0.75 μg/ml and 0.74 μg/ml, respectively. The SARS-CoV-2 RBD IgG ELISA positivity threshold is denoted with the red dotted line at 0.39 μg/ml. Dashed purple lines represent quartiles. P = 0.86, 2-sample Kolmogorov-Smirnov test.
Figure 4
Figure 4. Modest agreement between SARS-CoV-2 RBD IgG and nucleocapsid seropositivity.
Twenty-eight COVID-19+ viral, nonhospitalized samples and 92 SCAN samples with untested/negative COVID-19 status were analyzed for the presence of SARS-CoV-2 RBD IgG and nucleocapsid IgG antibodies using a hospital performed test. Six of twenty-eight (21.5%) known COVID-19+ viral samples were nucleocapsid but were RBD IgG+. One of twenty-eight COVID-19+ viral samples was seronegative on both platforms. Of the 92 unknown COVID-19 status samples, 20 (21.7%) samples were both nucleocapsid and RBD IgG+, while 45 (48.9%) samples were nucleocapsid and RBD IgG+. Agreement between RBD IgG and nucleocapsid classification was modest for both the known COVID-19+ viral (κ = 0.20; 95% CI, 0.00–0.59) and unknown COVID-19 status (κ = 0.21; 95% CI, 0.12–0.32) samples. The black diagonal line and gray shaded area represent the simple linear regression of RBD IgG on nucleocapsid ratio and the 95% CI band, respectively. The SARS-CoV-2 RBD IgG ELISA positivity threshold is denoted with the red dotted line at 0.39 μg/ml. The SARS-CoV-2 nucleocapsid positivity threshold is denoted with the orange dotted line at ratio 1.4.
Figure 5
Figure 5. Detectable SARS-CoV-2 RBD IgG antibodies after 3–4 months in SCAN community samples.
(A) Two hundred and eighty-six seropositive RBD IgG SCAN sample concentrations plotted as a function of calendar week of acquisition. The Lowess curve (black dotted line) is steady across 26 weeks of sampling. The gray line illustrates the COVID case number per day in Cook County. (B and C) Eighty-seven seropositive SCAN participants (purple dots) were resampled 84–132 days after the first seropositive RBD IgG test (mean 103 days). Dotted lines connect the same participant over time. Eighteen of eighty-seven (50.6%) samples remained seropositive after 3–4 months, with 43 (49.4%) samples converting to seronegative (gray dots). Time points were significantly different (P < 0.0001 by Wilcoxon signed rank test).
Figure 6
Figure 6. Reexposure to SARS-CoV-2.
Three IgG RBD seropositive individuals (SCAN 1, 2, 3) were observed to have a marked increase in IgG against RBD 14–28 days after positive SARS-CoV-2 diagnostic viral testing (green arrows). Mild symptoms were noted, including cough, altered taste, and smell. None required hospitalization.

Update of

Similar articles

Cited by

References

    1. Anand S, et al. Prevalence of SARS-CoV-2 antibodies in a large nationwide sample of patients on dialysis in the USA: a cross-sectional study. Lancet. 2020;396(10259):1335–1344. doi: 10.1016/S0140-6736(20)32009-2. - DOI - PMC - PubMed
    1. Chen Y, et al. High SARS-CoV-2 antibody prevalence among healthcare workers exposed to COVID-19 patients. J Infect. 2020;81(3):420–426. doi: 10.1016/j.jinf.2020.05.067. - DOI - PMC - PubMed
    1. Deeks JJ, et al. Antibody tests for identification of current and past infection with SARS-CoV-2. Cochrane Database Syst Rev. 2020;6(6):Cd013652. - PMC - PubMed
    1. Figueiredo-Campos P, et al. Seroprevalence of anti-SARS-CoV-2 antibodies in COVID-19 patients and healthy volunteers up to six months post disease onset. Eur J Immunol. 2020;50(12):2025–2040. doi: 10.1002/eji.202048970. - DOI - PMC - PubMed
    1. Gudbjartsson DF, et al. Humoral immune response to SARS-CoV-2 in Iceland. N Engl J Med. 2020;383(18):1724–1734. doi: 10.1056/NEJMoa2026116. - DOI - PMC - PubMed

Publication types

MeSH terms