. 2021 Apr 22;6(8):e145936.
doi: 10.1172/jci.insight.145936.

Efficacy of AAV9-mediated SGPL1 gene transfer in a mouse model of S1P lyase insufficiency syndrome

Affiliations

Efficacy of AAV9-mediated SGPL1 gene transfer in a mouse model of S1P lyase insufficiency syndrome

Piming Zhao et al. JCI Insight. .

Abstract

Sphingosine-1-phosphate lyase insufficiency syndrome (SPLIS) is a rare metabolic disorder caused by inactivating mutations in sphingosine-1-phosphate lyase 1 (SGPL1), which is required for the final step of sphingolipid metabolism. SPLIS features include steroid-resistant nephrotic syndrome and impairment of neurological, endocrine, and hematopoietic systems. Many affected individuals die within the first 2 years. No targeted therapy for SPLIS is available. We hypothesized that SGPL1 gene replacement would address the root cause of SPLIS, thereby serving as a universal treatment for the condition. As proof of concept, we evaluated the efficacy of adeno-associated virus 9-mediated transfer of human SGPL1 (AAV-SPL) given to newborn Sgpl1-KO mice that model SPLIS and die in the first weeks of life. Treatment dramatically prolonged survival and prevented nephrosis, neurodevelopmental delay, anemia, and hypercholesterolemia. STAT3 pathway activation and elevated proinflammatory and profibrogenic cytokines observed in KO kidneys were attenuated by treatment. Plasma and tissue sphingolipids were reduced in treated compared with untreated KO pups. SGPL1 expression and activity were measurable for at least 40 weeks. In summary, early AAV-SPL treatment prevents nephrosis, lipidosis, and neurological impairment in a mouse model of SPLIS. Our results suggest that SGPL1 gene replacement holds promise as a durable and universal targeted treatment for SPLIS.

Keywords: Gene therapy; Genetic diseases; Metabolism; Therapeutics.


Conflict of interest statement

Conflict of interest: PZ and JDS are inventors on a pending patent application, International Application serial number PCT/US2021/018613 titled: Adeno-Associated Viral (Aav)-Mediated Sgpl1 Gene Therapy For Treatment Of Sphingosine-1-Phosphate Lyase Insufficiency Syndrome (Splis). This research was supported by a gift from Ultragenyx Pharmaceutical Inc. in January 2019 (to JDS).

Figures

Figure 1
Figure 1. AAV-SPL expression and activity in vitro.
The human SPL (hSPL) cDNA and the hSPL-tRFP cDNA were cloned into pAAV-MCS, packaged in AAV8, and used to transduce SPLIS skin fibroblasts. (A) Immunoblot of hSPL in whole cell extracts of SPLIS fibroblasts treated with vehicle (Ctrl), AAV-SPL, an equal volume of AAV-SPLtRFP, or a 5-fold higher volume of AAV-SPL-tRFP. (B) SPL activity in extracts corresponding to the samples described in A.
Figure 2
Figure 2. Treatment of newborn Sgpl1-KO mice with AAV-SPL prolongs survival.
(A) Treatment schedule, with upper images showing injection site and lower image showing green color of properly injected KO pup (AAV) next to untreated WT pup (Cntrl). (B) Images showing size discrepancy between WT and untreated Sgpl1-KO littermates at 17 DOL versus similarity in size of WT and AAV-SPL–treated Sgpl1-KO (AAV) littermates at 22 DOL. (C) Weight gain of female WT (blue), untreated Sgpl1-KO (red), and AAV-SPL–treated KO (green) mice. (D) Kaplan-Meier survival curve for WT (blue), untreated Sgpl1-KO (red), AAV-SPL–treated KO (green), and AAV-SPLK353L–treated KO (black) mice. Log-rank test with Bonferroni’s correction: for WT vs. all other groups, P < 0.0003; AAV vs. KO, P < 0.0003; KO vs. K353L, no significant difference (NSD).
Figure 3
Figure 3. AAV-SPL treatment prevents development of SPLIS nephrosis.
(A) Urine ACR in WT (n = 4), KO (n = 9), and AAV-SPL–treated KO (AAV, n = 3) mice. (B) Serum albumin in WT (n = 4), KO (n = 10), and AAV-SPL–treated KO (n = 3) mice. For A and B, unpaired t test was performed with Welch’s correction when appropriate and Bonferroni’s corrections for comparisons of experimental groups with WT. For A, P = 0.01 for KO vs. WT. For B, P = 0.015. For A and B, there was NSD between AAV vs. WT. (C) Quadrants show kidney sections stained with periodic acid–Schiff from WT, KO, AAV-SPL–treated KO (AAV), and AAV-SPLK353L–treated KO (K353L) mice. KO and K353L kidney sections show enlarged glomeruli with mesangial expansion, not seen in sections of WT and AAV mice. Small arrows indicate mesangial expansion by cells and matrix. White areas surrounding glomeruli are fixation artifact. Scale bar: 50 μm. Image to right shows sclerosis in KO glomerulus (black arrowhead), with a WT glomerulus shown above it for contrast. (D) Glomerular tuft area, which includes the capillaries, mesangium, and podocytes and not Bowman’s space or capsule. Mann-Whitney U test was performed with Bonferroni’s correction. For KO vs. WT, P < 0.0002. There was NSD between AAV vs. WT.
Figure 4
Figure 4. Stat3 activation and cytokine upregulation in SPLIS kidneys.
(A) Immunoblot showing total and tyrosine 705–phosphorylated (activated) Stat3 in kidneys of WT, KO, AAV-SPL–treated KO (AAV), and AAV-SPLK353L–treated KO (K353L) mice; n = 2/group. GAPDH is a loading control. (B) Relative expression of Stat3 target genes Lcn2, Timp1, and Socs1 and Socs3 in WT (black circles), KO (white circles), and AAV kidney (red circles), shown as fold change from WT. For KO vs. AAV, P = 0.003 for all genes except Socs3. (C) Liver and (D) kidney cytokines of WT, KO, and AAV mice, shown as log fold change from WT, with same key as in B. For BD, unpaired t test with Bonferroni’s correction (and Welch’s correction where appropriate) was applied. For liver cytokines, AAV vs. KO: P = 0.0097 for Tnf-α; P = 0.0363 for Il-6; NSD for Ifn-γ; P = 0.0004 for Il-1β; P = 0.0003 for Tgf-β; P < 0.0001 for Mcp1. For kidney cytokines, AAV vs. KO: P = 0.0009 for Tnf-α; P = 0.0023 for Il-6; P = 0.036 for Ifn-γ; P = 0.0046 for Il-1β; P = 0.005 for Tgf-β; P < 0.0001 for Mcp1.
Figure 5
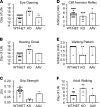
Figure 5. Sgpl1-KO mice exhibit developmental delay, which is prevented by AAV-SPL.
Six neurodevelopmental milestones were scored in WT (n = 8), heterozygous (HET, n = 14), KO (n = 6), and AAV-SPL–treated KO (AAV, n = 3) pups. For A and D, unpaired t test with Bonferroni’s correction was applied. For B, C, and F, Mann-Whitney U with Bonferroni’s correction was applied. For KO vs. WT comparisons: (A, P < 0.0002); (B, P = 0.001); (C, P = 0.0008); (D, NSD; E, P = 0.0068); (F, P = 0.0056). There was NSD between AAV and WT/HET or WT and HET for AF.
Figure 6
Figure 6. Sgpl1-KO mice exhibit glucocorticoid deficiency.
(A) Corticosterone was measured in plasma of WT (n = 5), KO (n = 4), and AAV-SPL–treated KO (AAV, n = 3) mice. (B) ACTH levels were measured in the plasma of WT (n = 8), KO (n = 5), and AAV-SPL–treated KO (AAV, n = 3) mice. There are NSDs among the groups. (CE) Expression levels of Cyp11b1, Cyp11b2, and Akr1b7 were measured in adrenal gland tissues of WT, KO, and AAV mice (n = 3/group except for AAV in C, where n = 2). For A, C, and D, unpaired t test with Bonferroni’s correction was performed (with Welch’s correction in C). For B, Mann-Whitney U was performed. In A, KO vs. WT, P = 0.009; AAV vs. WT, P = 0.035. In B, KO vs. WT, NSD; insufficient data for AAV vs. WT. In C, KO vs. WT, P = 0.0016; AAV vs. WT, P = 0.0032. In D, KO vs. WT, P = 0.001; AAV vs. WT, NSD.
Figure 7
Figure 7. Hematological parameters of treated and untreated Sgpl1-KO mice.
(A) Blood parameters including absolute lymphocyte count (K/μL), percentage lymphocytes (% lymph), RBC mass (M/μL), hemoglobin (g/dL), and hematocrit (%) were measured in WT/HET (n = 18), KO (n = 6), and AAV-SPL–treated KO (AAV) mice (n = 8). All mice were euthanized at 28 DOL. All parameters were evaluated using unpaired 2-tailed t test with Bonferroni’s correction. Welch’s correction was applied when appropriate. For absolute lymphocyte count, WT/HET vs. KO, P < 0.004; AAV vs. WT/HET, P < 0.0002. For percentage lymphocytes, WT/HET vs. KO, P = 0.006; AAV vs. WT/HET, P <0.0002. For RBC mass, WT/HET vs. KO, P = 0.0018. For hemoglobin, WT/HET vs. KO, P = 0.0048. For hematocrit, WT/HET vs. KO, P = 0.0026. For RBC mass, hemoglobin and hematocrit, AAV vs. WT/HET, there was NSD.
Figure 8
Figure 8. Plasma lipids of treated and untreated Sgpl1-KO mice.
Plasma (A) triglycerides, (B) total cholesterol, (C) HDL-cholesterol, and (D) non–HDL-cholesterol (LDL, IDL, and VLDL) were measured in plasma of WT (n = 8), heterozygous (HET) (n = 8), KO (n = 4), and AAV-SPL–treated KO (AAV) mice, (n = 5). All mice were euthanized at 28 DOL. For triglycerides, 1-way ANOVA was applied, and there were NSDs between any of the groups. For all other lipids, 1-way ANOVA was used to compare WT, HET, and AAV-SPL, and unpaired t test was used to compare KO and WT. Comparing KO vs. WT: (B, P = 0.0006); (C, P = 0.007); (D, P = 0.0002). There are NSDs between WT, HET, and AAV-SPL for any of the lipids.
Figure 9
Figure 9. Bioavailability of AAV-SPL based on SPL gene expression and enzyme activity.
(A) Relative hSPL (SGPL1) levels in different tissues of AAV-SPL–treated KO mice, shown as log10 values. (B) Ratio of hSPL (SGPL1) to mSPL (Sgpl1) in tissues of WT and AAV-SPL–treated KO mice, respectively. (C) SPL activity levels in brain (blue bars), kidney (red bars), and liver (green bars) of WT, KO, AAV-SPL–treated KO (AAV) and AAV-SPLK353L treated KO (K353L) mice. Student’s t test: in all 3 tissues, for WT vs. KO, P < 0.03; AAV vs. KO, P < 0.02; KO vs. K353L, NSD. For AC, n = 3 per group.
Figure 10
Figure 10. Expression pattern of mSPL and hSPL in murine tissues.
IHC was performed on fixed tissue sections from WT, KO, AAV-SPL–treated KO (AAV), and AAV-SPLK353L–treated KO (K353L) mice. For WT tissues, staining was performed using anti-mSPL. For all other groups, staining was performed with anti-hSPL. KO tissues were also stained with anti-mSPL and were negative for signal (data not shown). Brain tissues from KO mice treated with PHP.eB-hSPL are shown in comparison with AAV9-hSPL. Insets show enlarged image detail for each quadrant to highlight cells with positive signal; original magnification, ×20.
Figure 11
Figure 11. Attenuation of sphingolipid accumulation in AAV-SPL–treated Sgpl1-KO mice.
S1P, dihydrosphingosine-1-phosphate (DHS1P), sphingosine, and dihydrosphingosine (DHS) in the (A) liver and (B) plasma of WT (n = 9), KO (n = 7), and AAV-SPL–treated KO (AAV, n = 4) mice. For liver S1P, liver DHS1P, and plasma sphingosine, Mann-Whitney U with Bonferroni’s correction was applied. For liver sphingosine, liver DHS, plasma S1P, and plasma DHS1P, unpaired t test with Bonferroni’s correction was applied, and for liver DHS and plasma DHS1P, Welch’s correction was additionally applied. For plasma DHS, Kruskal-Wallis was applied. For liver S1P: KO vs. WT/HET, P < 0.004; AAV vs. WT/HET, P = 0.0058; AAV vs. KO, P = 0.012. For liver sphingosine: KO vs. WT/HET, P < 0.0002; AAV vs. WT/HET, P < 0.0002; AAV vs. KO, P = 0.0016. For liver DHS1P: KO vs. WT/HET, P = 0.0004; AAV vs. WT/HET, P = 0.0112; AAV vs. KO, P = 0.0122. For liver DHS: KO vs. WT/HET, P = 0.0006; AAV vs. WT/HET, P = 0.0062; AAV vs. KO, P = 0.049. For plasma S1P: KO vs. WT/HET, P = 0.0002; AAV vs. WT/HET, P = 0.0002; AAV vs. KO, P = 0.014. For plasma sphingosine: KO vs. WT/HET, P < 0.0002; AAV vs. WT/HET, P < 0.0018; AAV vs. KO, P = 0.033. For plasma DHS1P: KO vs. WT/HET, P = 0.001; AAV vs. WT/HET, P < 0.0002; AAV vs. KO, P = 0.0048. For plasma DHS: there were NSDs in any of the groups.
Figure 12
Figure 12. Durability of AAV-SPL.
(A) Abundance of liver mSPL and hSPL are shown by immunoblot of livers from WT, KO, and long-lived AAV-SPL–treated KO mice (AAV). Blots were probed using anti-mSPL, which detects mSPL and crossreacts with hSPL, and using anti-hSPL, which is specific for hSPL. WT liver expresses mSPL but not hSPL. Untreated KO does not express either protein. Liver of the AAV-SPL–treated KO mouse euthanized at 11.5 months of age shows abundant hSPL, detected by both antibodies. GAPDH is a loading control. (B) SPL activity measured in livers of WT, KO, and long-lived AAV-SPL–treated KO (AAV) mice (n = 3/group) euthanized at 11 months of age. Using unpaired t test with Bonferroni’s correction, there were NSDs between the groups.

Similar articles

Cited by

References

    1. Choi YJ, Saba JD. Sphingosine phosphate lyase insufficiency syndrome (SPLIS): a novel inborn error of sphingolipid metabolism. Adv Biol Regul. 2019;71:128–140. - PMC - PubMed
    1. Dunn TM, et al. A perilous path: the inborn errors of sphingolipid metabolism. J Lipid Res. 2019;60(3):475–483. doi: 10.1194/jlr.S091827. - DOI - PMC - PubMed
    1. Lovric S, et al. Mutations in sphingosine-1-phosphate lyase cause nephrosis with ichthyosis and adrenal insufficiency. J Clin Invest. 2017;127(3):912–928. doi: 10.1172/JCI89626. - DOI - PMC - PubMed
    1. Prasad R, et al. Sphingosine-1-phosphate lyase mutations cause primary adrenal insufficiency and steroid-resistant nephrotic syndrome. J Clin Invest. 2017;127(3):942–953. doi: 10.1172/JCI90171. - DOI - PMC - PubMed
    1. Janecke AR, et al. Deficiency of the sphingosine-1-phosphate lyase SGPL1 is associated with congenital nephrotic syndrome and congenital adrenal calcifications. Hum Mutat. 2017;38(4):365–372. doi: 10.1002/humu.23192. - DOI - PMC - PubMed

Publication types

MeSH terms