. 2021 May 3;218(5):e20201974.
doi: 10.1084/jem.20201974.

Nuclear DEK preserves hematopoietic stem cells potential via NCoR1/HDAC3-Akt1/2-mTOR axis

Affiliations

Nuclear DEK preserves hematopoietic stem cells potential via NCoR1/HDAC3-Akt1/2-mTOR axis

Zhe Chen et al. J Exp Med. .

Abstract

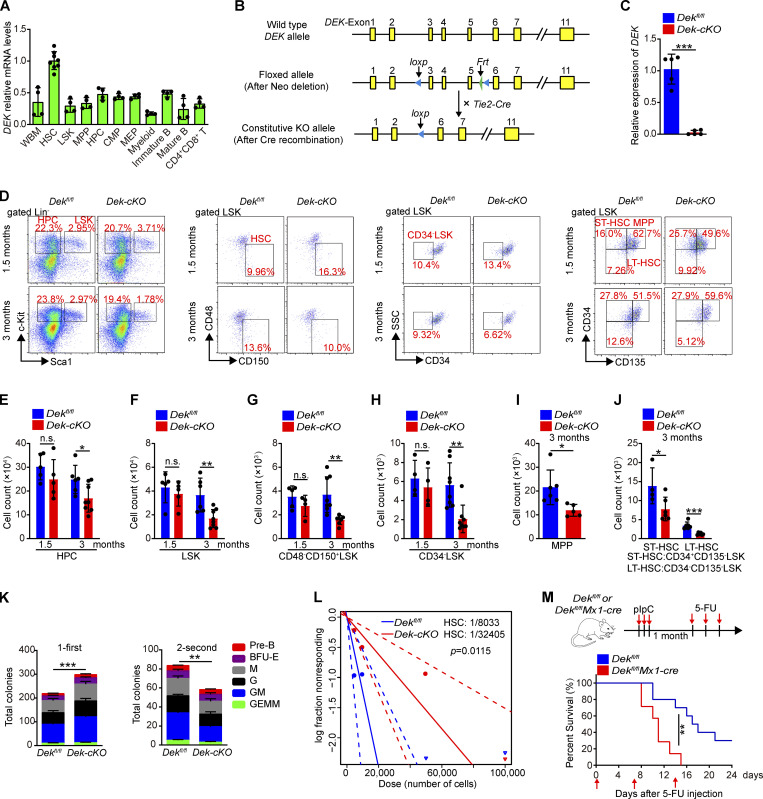
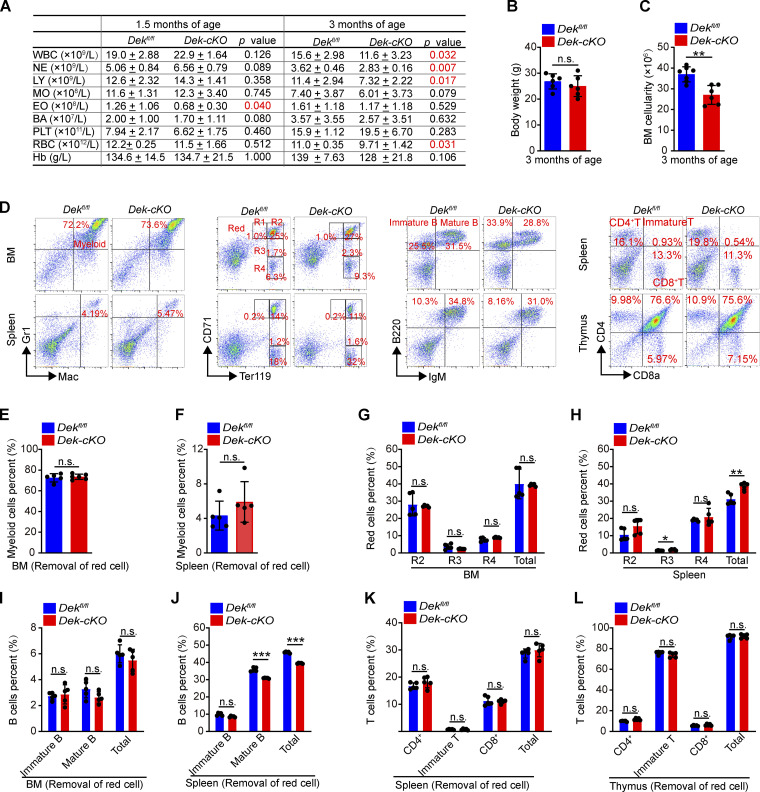
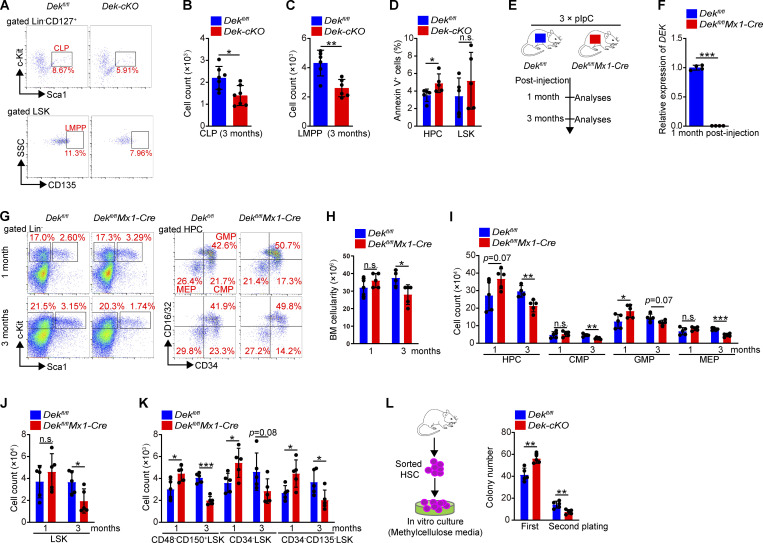
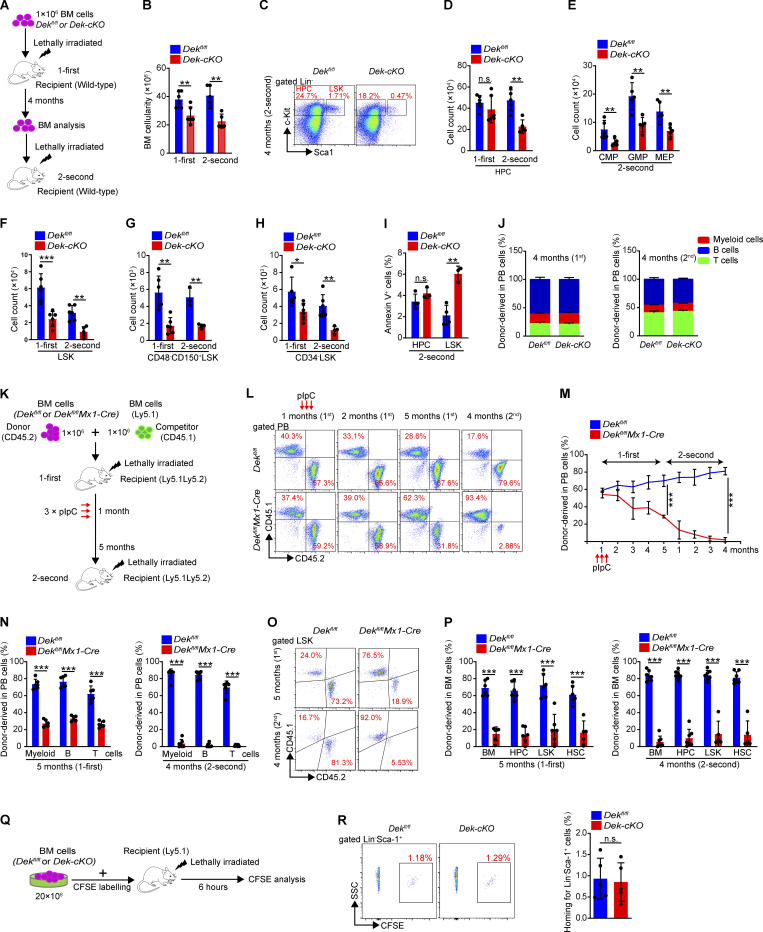
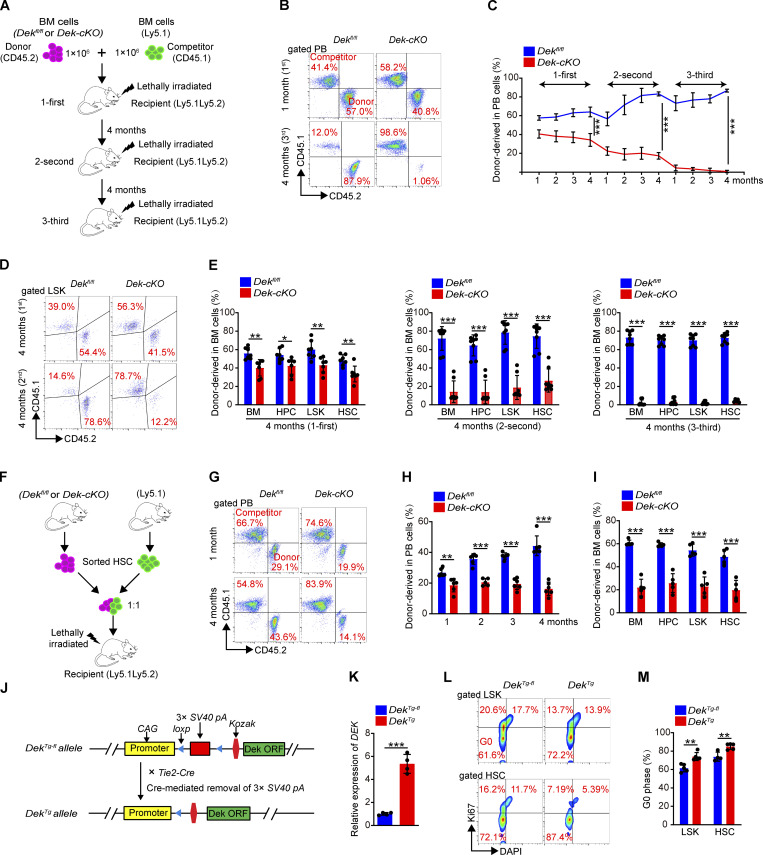
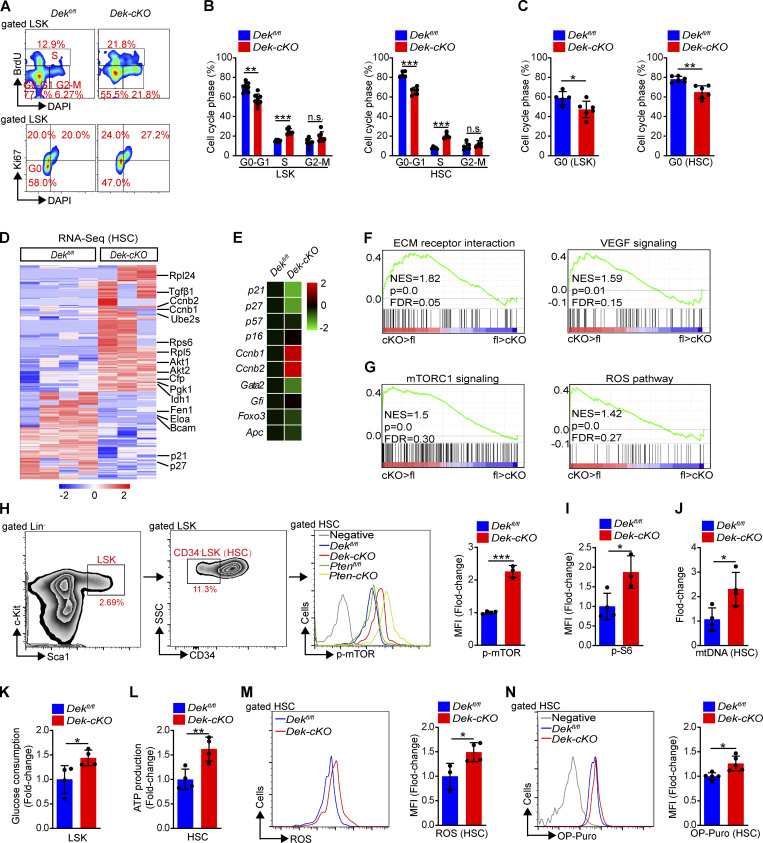
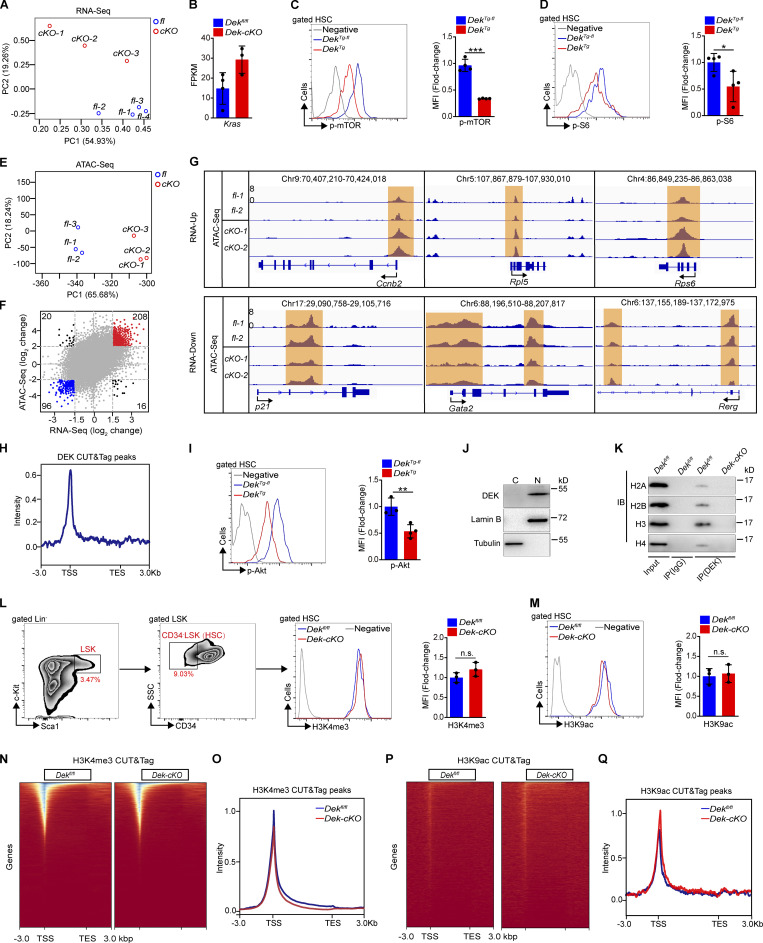
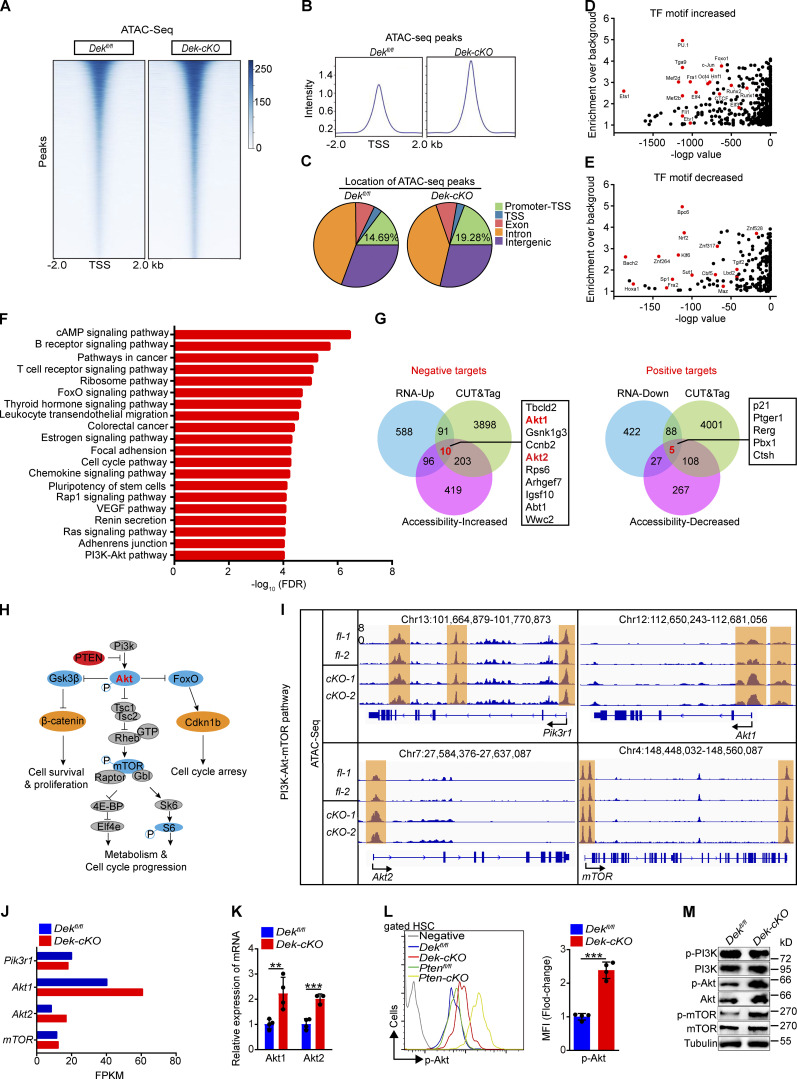
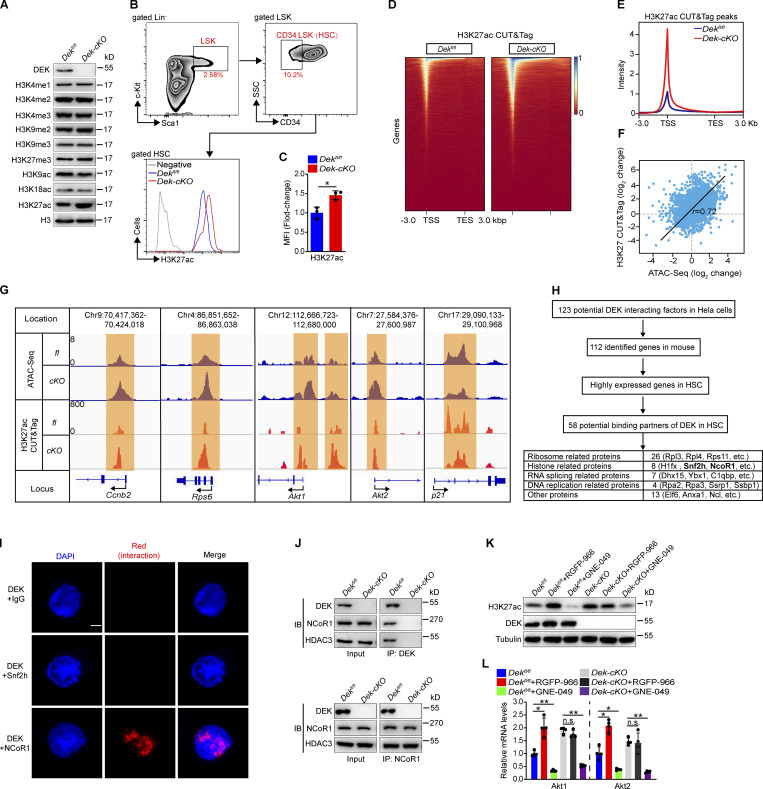
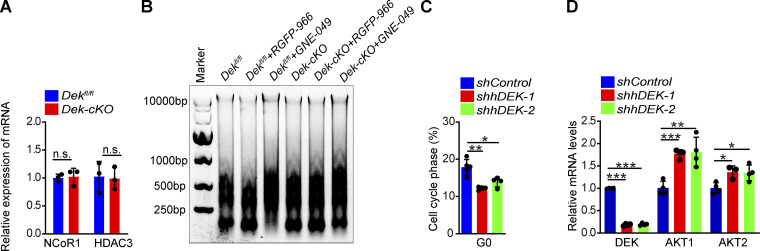
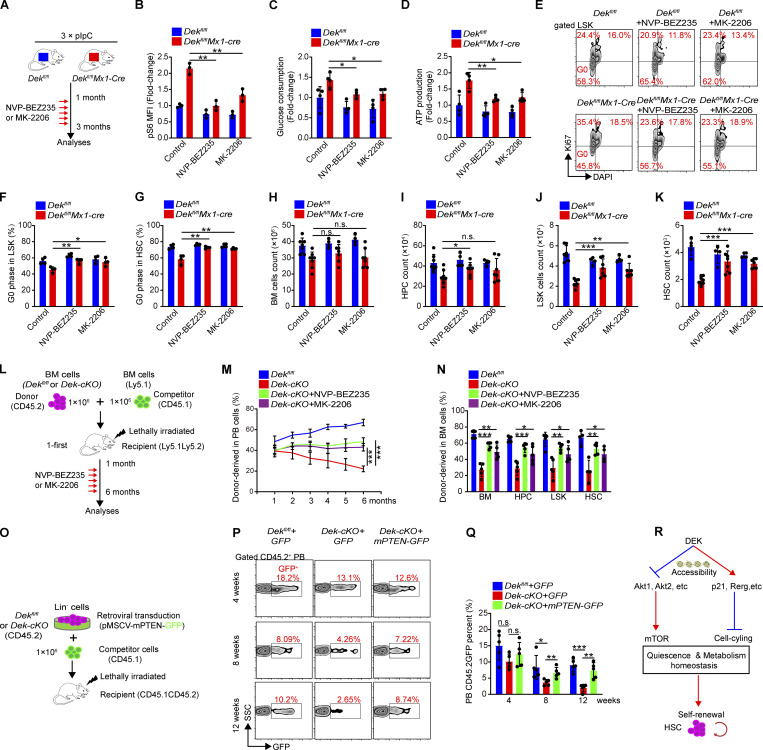
The oncogene DEK is found fused with the NUP214 gene creating oncoprotein DEK-NUP214 that induces acute myeloid leukemia (AML) in patients, and secreted DEK protein functions as a hematopoietic cytokine to regulate hematopoiesis; however, the intrinsic role of nuclear DEK in hematopoietic stem cells (HSCs) remains largely unknown. Here, we show that HSCs lacking DEK display defects in long-term self-renew capacity, eventually resulting in impaired hematopoiesis. DEK deficiency reduces quiescence and accelerates mitochondrial metabolism in HSCs, in part, dependent upon activating mTOR signaling. At the molecular level, DEK recruits the corepressor NCoR1 to repress acetylation of histone 3 at lysine 27 (H3K27ac) and restricts the chromatin accessibility of HSCs, governing the expression of quiescence-associated genes (e.g., Akt1/2, Ccnb2, and p21). Inhibition of mTOR activity largely restores the maintenance and potential of Dek-cKO HSCs. These findings highlight the crucial role of nuclear DEK in preserving HSC potential, uncovering a new link between chromatin remodelers and HSC homeostasis, and have clinical implications.


Conflict of interest statement

Disclosures: The authors declare no competing interests exist.

Figures

Figure 1.
Figure 1.
DEK is highly expressed in HSCs and maintains HSC pool. (A) qRT-PCR analysis of DEK in different hematopoietic cell subsets in WT mice (n = 4–8), including WBM (whole BM cells), HSCs (Linc-Kit+Sca-1+CD48CD150+), LSK cells (Linc-Kit+Sca-1+), MPPs (Linc-Kit+Sca-1+CD48+CD150), HPCs (Linc-Kit+Sca-1), CMPs (CD34+CD16/32medHPC), MEPs (CD34CD16/32HPC), myeloid cells (Gr1+Mac+), immature B cells (B220+IgM), mature B cells (B220+IgM+), and CD4+CD8+ T cells. (B) Gene targeting strategies for hematopoietic lineage-specific KO of DEK in mice. (C) Relative mRNA expression of DEK in freshly sorted Dekfl/fl and Dek-cKO HSCs (n = 5). (D) FACS analysis of HPCs, LSK cells, HSCs, MPPs (CD34+CD135+LSK), ST-HSCs (CD34+CD135LSK), and LT-HSCs (CD34CD135LSK) in BM cells of Dekfl/fl and Dek-cKO mice at 1.5 or 3 mo of age. (E–H) Count of HPCs, LSK cells, and HSCs (CD48CD150+LSK or CD34LSK) in BM cells of Dekfl/fl and Dek-cKO mice at 1.5 or 3 mo of age (n = 5–8). (I and J) Count of MPPs, ST-HSCs, and LT-HSCs in BM cells of Dekfl/fl and Dek-cKO mice at 3 mo of age (n = 6). (K) In vitro assay of the CFUs of megakaryocyte colonies (GEMM), granulocyte-macrophage colonies (GM), granulocyte colonies (G), macrophage colonies (M), and burst-forming unit-erythroid colonies (BFU-E) at 10–12 d after plating Dekfl/fl and Dek-cKO BM cells (n = 8). For the second plating, live cells from the colonies obtained during the first plating were plated as before and cultured for 10–12 d (n = 4). (L) The CRU frequency is determined by extreme limiting dilution analysis, showing the estimated HSC frequency in the BM of Dekfl/fl and Dek-cKO mice (n = 3 donor mice, five recipients at each cell concentration). (M) Survival curve of Dekfl/fl and Dekfl/flMx1-Cre mice following sequential 5-FU treatment (n = 10). Error bars represent means ± SD. *, P < 0.05; **, P < 0.01; ***, P < 0.001; Student’s t test or Mantel-Cox test. Data are representative of three independent experiments.
Figure S1.
Figure S1.
DEK deletion impairs hematopoiesis in mice. (A) PB complete blood cell counts of Dekfl/fl and Dek-cKO mice at 1.5 and 3 mo of age (n = 5–7). WBC, white blood cells; NE, neutrophils; LY, lymphocytes; MO, monocytes; EO, eosinophils; BA, basophils; PLT, platelets; Hb, hemoglobin. (B and C) Weight analysis and BM cells count in Dekfl/fl and Dek-cKO mice at 3 mo of age (n = 6). (D) FACS analysis of myeloid cells (Mac+Gr1+), red cells (R1: Ter119medCD71high; R2: Ter119highCD71high; R3: Ter119highCD71med; R4: Ter119highCD71low), B cells (immature B: IgMB220+; mature B: IgM+B220+), and T cells (immature T: CD8a+CD4+; CD4+ T; CD8+ T) in BM, spleen, and thymus of Dekfl/fl and Dek-cKO mice at 3 mo of age. (E and F) Percent analysis of myeloid cells in BM and spleen cells (n = 5). (G and H) Percent analysis of red cells in BM and spleen cells (n = 5). (I and J) Percent analysis of B cells in BM and spleen cells (n = 5). (K and L) Percent analysis of T cells in spleen and thymus cells (n = 5). Error bars represent means ± SD. **, P < 0.01; ***, P < 0.001; Student’s t test. Data are representative of three independent experiments.
Figure S2.
Figure S2.
DEK deletion decreases the HSPC pool in mice. (A) FACS analysis of CLPs (LinCD127+Sca-1loc-Kitlo) and LMPPs (Lin Sca-1+c-Kit+CD135+) in BM cells of Dekfl/fl and Dek-cKO mice. (B and C) Count of CLPs and LMPPs in BM cells of Dekfl/fl and Dek-cKO at 3 mo of age (n = 6–7). (D) Analysis of apoptotic HPCs and LSK cells in BM cells of Dekfl/fl and Dek-cKO at 3 mo of age. Annexin V+ cells represent early and later apoptotic cells (n = 5). (E) Experimental schematic for the generation of mice with inducible deletion of DEK, Dekfl/flMx1-Cre. Mice were treated with an i.p. injection of 10 µg pIpC per gram of body weight every second day for a total of three injections. The mice were sacrificed for analyses at 1 or 3 mo after pIpC injection. (F) Relative mRNA expression of DEK in freshly sorted HSCs of Dekfl/fl and Dekfl/flMx1-Cre mice at 1 mo after pIpC injection (n = 4). (G) FACS analysis of LSK cells and HPCs in Dekfl/fl and Dekfl/flMx1-Cre BM cells at 1 or 3 mo after pIpC injection. (H) BM cells count of Dekfl/fl and Dekfl/flMx1-Cre mice after pIpC injection (n = 5). (I) Count of HPC, CMP, GMP, and MEP in BM cells of Dekfl/fl and Dekfl/flMx1-Cre mice after pIpC injection (n = 5). (J) LSK cells count in Dekfl/fl and Dekfl/flMx1-Cre BM cells (n = 5). (K) HSC (CD48CD150+LSK, CD34LSK, or CD34CD135LSK) count in Dekfl/fl and Dekfl/flMx1-Cre BM cells (n = 5). (L) In vitro assay of the CFUs at 10–12 d after plating Dekfl/fl and Dek-cKO HSC cells. For the second plating, live cells from the colonies obtained during the first plating were plated as before and cultured for 10–12 d (n = 5). Error bars represent means ± SD. *, P < 0.05; **, P < 0.01; ***, P < 0.001; Student’s t test. Data are representative of three independent experiments.
Figure 2.
Figure 2.
DEK deficiency impairs HSC self-renewal. (A) Experimental schematic for the serial transplantation assay. (B) BM cell count of recipient mice at 4 mo after first or second transplantation (n = 5–6). (C) FACS analysis of HPCs and LSK cells in BM cells of recipient mice at 4 mo after second transplantation. (D) Count of HPCs in BM cells of recipient mice at 4 mo after first or second transplantation (n = 5–6). (E) Count of CMPs, GMPs, and MEPs in BM cells of recipient mice at 4 mo after second transplantation (n = 5). (F–H) Count of LSK cells and HSCs (CD48CD150+LSK or CD34LSK) in BM cells of recipient mice at 4 mo after first or second transplantation (n = 4–6). (I) Analysis of apoptotic HPCs and LSK cells in BM cells of recipient mice at 4 mo after second transplantation. Annexin V+ cells represent early and later apoptotic cells (n = 3–4). (J) The ratio analysis of myeloid cells, B cells, and T cells in PB cells of recipient mice at 4 mo after first and second transplantation (n = 6). (K) Experimental schematic for the competitive transplantation assay. (L) FACS analysis of PB cells from recipient mice in serial competitive transplantation assay (donor-derived CD45.1CD45.2+ cells, competitor-derived CD45.1+CD45.2 cells). (M) Percentage of donor-derived PB cells at the indicated time points in serial competitive transplantation assay (n = 6–7). (N) Percentage of donor-derived myeloid cells, B cells, and T cells in PB cells of recipient mice at 5 mo after first transplantation (n = 6), or at 4 mo after second transplantation (n = 6–7). (O) FACS analysis of LSK cells from recipient mice BM in serial competitive transplantation assay at 5 mo after first transplantation, or at 4 mo after second transplantation. (P) Percentage of donor-derived BM cells, HPCs, LSK cells, and HSCs at 5 mo after first transplantation (n = 6), or at 4 mo after second transplantation (n = 5–7). (Q) Experimental schematic for the homing assay. (R) FACS analysis of CFSE+ cells in BM LinSca-1+ cells of recipient mice. The histogram indicates in vivo homing percentage of Dekfl/fl and Dek-cKO Lin Sca-1+ cells in recipient mice at 6 h after transplantation (n = 5). Error bars represent means ± SD. *, P < 0.05; **, P < 0.01; ***, P < 0.001; Student’s t test. Data are representative of three independent experiments.
Figure S3.
Figure S3.
DEK deletion impairs the reconstitution capacity of HSCs. (A) Experimental schematic for the competitive transplantation assay. BM cells of Dekfl/fl and Dek-cKO mice were transplanted into lethally irradiated recipient mice with competitor BM cells from WT Ly5.1 mice. The reconstituted BM cells of recipient mice were harvested (at 4 mo after transplantation) for analysis and the next transplantation. (B) FACS analysis of PB cells from recipient mice in serial competitive transplantation assay (first, third, for the first or third competitive transplantation; donor-derived CD45.1CD45.2+ cells, competitor-derived CD45.1+CD45.2 cells). (C) Percentage of donor-derived PB cells at the indicated time points in serial competitive transplantation assay (n = 7). (D) FACS analysis of LSK cells from recipient mice BM in serial competitive transplantation assay at 4 mo after first or second transplantation. (E) Percentage of donor-derived BM cells, HPCs, LSK cells, and HSCs at the indicated time points in serial competitive transplantation assay (n = 7). (F) Experimental schematic for the competitive transplantation assay using sorted HSCs (5 × 10²). (G) FACS analysis of PB cells from recipient mice in competitive transplantation assay. (H) Percentage of donor-derived PB cells at the indicated time points (n = 5–6). (I) Percentage of donor-derived BM cells, HPCs, LSK cells, and HSCs at the indicated time points (n = 5–6). Error bars represent means ± SD. (J) Experimental schematic for the generation of mice with overexpression of DEK in hematopoietic lineage cells. (K) Relative mRNA expression of DEK in freshly sorted DekTg-fl and DekTg HSCs (n = 4). (L) FACS analysis of Ki-67 staining in LSK cells and HSCs of DekTg-fl and DekTg mice. (M) Quiescence (G0 phase) analysis of LSK cells and HSCs (n = 4–5). *, P < 0.05; **, P < 0.01; ***, P < 0.001; Student’s t test. Data are representative of three independent experiments.
Figure 3.
Figure 3.
DEK loss decreases quiescence and activates mTOR signaling in HSCs. (A) FACS analysis of BrdU incorporation and Ki-67 staining in LSK cells of Dekfl/fl and Dek-cKO mice at 3 mo of age. (B) Cell-cycle analysis of LSK cells and HSCs in Dekfl/fl and Dek-cKO mice at 3 mo of age (n = 4–8). (C) Quiescence (G0 phase) analysis of LSK cells and HSCs in Dekfl/fl and Dek-cKO mice at 3 mo of age (n = 5–6). (D) Representative heatmap of upregulated genes or downregulated genes by 1.5-fold or more in Dek-cKO HSCs compared with Dekfl/fl HSCs (n = 3–4; P < 0.01). (E) qRT-PCR analysis of the indicated genes from freshly sorted HSCs (n = 4). (F and G) GSEA of the selected gene sets. (H and I) FACS analysis of p-mTOR and p-S6 in HSCs of the indicated mice. The histograms indicate the mean fluorescence intensity (MFI) analysis of p-mTOR and p-S6 (n = 3–4). (J) Quantitative PCR analysis of mitochondrial DNA (mtDNA) in freshly sorted HSCs (n = 4). (K) Glucose consumption analysis of LSK cells. Sorted LSK cells were in vitro for 24 h, and the change in glucose concentration in the culture medium was measured (n = 4). (L) ATP level in freshly sorted HSCs (n = 4). (M) FACS analysis of ROS level in HSCs. The histogram indicates the MFI analysis of ROS in HSCs (n = 3–4). (N) FACS analysis of OP-Puro incorporation in HSCs. The histogram indicates the MFI analysis of OP-Puro in HSCs (n = 5). *, P < 0.05; **, P < 0.01; ***, P < 0.001; Student’s t test. Data in A–C, E, and H–N are representative of three independent experiments. NES, normalized enrichment score; FDR, false discovery rate; ECM, extracellular matrix; VEGF, vascular endothelial growth factor.
Figure S4.
Figure S4.
DEK interacts with H3 and regulates chromatin accessibility. (A) Principal component analysis showing the relation between RNA-seq samples. (B) The FPKM value of Kras. Data are from RNA-seq (n = 3–4). (C and D) FACS analysis of p-mTOR and p-S6 in HSCs of the indicated mice. The histograms indicate the mean fluorescence intensity (MFI) analysis of p-mTOR and p-S6 (n = 4). (E) Principal component analysis showing the relation between ATAC-seq samples. (F) Intersection of ATAC-seq accessibility and nearby transcription of genes. Each point indicates a separate ATAC-seq peak. (G) Accessible chromatin located at gene loci, including mRNA-increased genes (Ccnb2, Rps6, and Rpl5) and mRNA-decreased genes (p21, Gata2, and Rerg). (H) Average diagram of genome-wide DEK CUT&Tag peaks in HSCs at TSS regions (±3,000 bp). (I) FACS analysis of p-Akt in HSCs of the indicated mice. The histograms indicate the MFI analysis (n = 3–4). (J) Western blot for DEK in lysates prepared from cytoplasmic (C) and nucleus (N) of freshly sorted Linc-Kit+ cells from WT mice. Lamin B and tubulin were used as a loading control. (K) Linc-Kit+ cells were freshly sorted from WT mice. DEK protein was immunoprecipitated (IP) from cell lysates, followed by immunoblotting (IB). (L and M) FACS analysis of H3K4me3 and H3K9ac level in HSCs. The histogram indicates the MFI analysis (n = 3). (N) Representative heatmap of genome-wide H3K4me3 CUT&Tag signal around genes. (O) Average diagram of genome-wide H3K4me3 CUT&Tag peaks at TSS regions (±3,000 bp). (P) Representative heatmap of genome-wide H3K9ac CUT&Tag signal around genes. (Q) Average diagram of genome-wide H3K9ac CUT&Tag peaks at TSS regions (±3,000 bp). Error bars represent means ± SD. *, P < 0.05; **, P < 0.01; ***, P < 0.001; Student’s t-test. Data in G–J are representative of three independent experiments. SSC, side scatter; TES, transcriptional end site.
Figure 4.
Figure 4.
Akt1 and Akt2 are direct targets of DEK in HSCs by altering the chromatin accessibility landscape. (A) Representative heatmap of genome-wide ATAC-seq signal around genes in HSCs freshly sorted from Dekfl/fl and Dek-cKO mice (n = 3 biological independent samples per group). (B) Average diagram of genome-wide chromatin accessibility at TSS regions (±2,000 bp). (C) Location of all ATAC-seq peaks in Dekfl/fl and Dek-cKO HSCs. Promoter-TSS, the region between promoter and TSS (−1 kb to 100 bp). (D) Enrichment of the increased known TF binding motifs in different chromatin-accessible regions. (E) Enrichment of the decreased known TF binding motifs in different chromatin-accessible regions. (F) Pathway analysis of the genes with significant changed ATAC peaks (over twofold change; P < 0.01) in DEK-deficient HSCs. (G) Integrative analysis to identify transcriptome-wide potential targets of DEK in HSCs. Left: Potential negative targets of DEK. Right: Potential positive targets of DEK. RNA-Up and RNA-Down indicate genes with significantly increased and decreased expression, respectively, upon DEK deletion in HSCs as detected by RNA-seq (FPKM > 1, fold change > 1.5). CUT&Tag indicates genes with significant enrichment in DEK binding (reads per kilobase per million > 1). Accessibility-Increased and Accessibility-Decreased indicates genes with significantly increased and decreased accessibility, respectively, upon DEK deletion in HSCs as detected by ATAC-seq (reads per kilobase per million > 1, fold change > 2). (H) Summary of the PI3K-Akt-mTOR pathway. (I) Accessible chromatin located at gene loci, including Pi3kr1, Akt1, Akt2, and mTOR. (J) The FPKM value of indicated genes. Data are from RNA-seq. (K) Relative mRNA expression of Akt1 and Akt2 in freshly sorted Dekfl/fl and Dek-cKO HSCs (n = 4). (L) FACS analysis of p-Akt in HSCs of the indicated mice. The histograms indicate the mean fluorescence intensity analysis (n = 4). (M) Western blot of PI3K-Akt-mTOR pathway proteins in lysates prepared from freshly sorted Linc-Kit+ cells. **, P < 0.01; ***, P < 0.001; Student’s t test. Data in K–M are representative of three independent experiments. VEGF, vascular endothelial growth factor.
Figure 5.
Figure 5.
DEK induces deacetylation of H3K27 by recruiting the corepressor NCoR1. (A) Western blot for modified histone 3 in lysates prepared from freshly sorted Linc-Kit+ cells. (B and C) FACS analysis of H3K27ac level in HSCs (CD34LSK). The histograms indicate the mean fluorescence intensity (MFI) analysis of H3K27ac in HSCs (n = 3). (D) Representative heatmap of genome-wide H3K27ac CUT&Tag signal around genes. (E) Average diagram of genome-wide H3K27ac CUT&Tag peaks at TSS regions (±3,000 bp). (F) Correlation of changes between ATAC peaks and H3K27ac CUT&Tag peaks. Correlation coefficient (r) and P values (r = 0.72, P < 1 × 10−50) were calculated by Pearson’s correlation analysis. (G) Distribution of ATAC peaks and H3K27ac CUT&Tag peaks across the indicated gene loci. (H) Schematic representation of the workflow for DEK partners’ discovery. Potential DEK interacting factors from published mass spectrometry data (Smith et al., 2018). The highly expressed genes in HSCs have an FPKM value of >30 (data from RNA-seq). (I) In situ ligation assay to detect DEK/Snf2h and DEK/NCoR1 interaction. As a negative control, proximity ligation was performed using a rabbit anti-DEK antibody and a mouse IgG. Nuclei were visualized using DAPI staining. Scale bar: 5 µm. (J) Linc-Kit+ cells were freshly isolated from mice. DEK or NCoR1 protein was immunoprecipitated from cell lysates, followed by immunoblotting (IB). (K) Western blot for H3K27ac, DEK, and tubulin in lysates prepared from Linc-Kit+ cells. Linc-Kit+ cells were sorted and cultured in vitro, with treatment of RGFP-966 (5 µM) or GNE-049 (500 nM) for 24 h. (L) qRT-PCR analysis of the indicated transcripts from HSCs (n = 4). HSCs were sorted and cultured in vitro, with treatment with RGFP-966 (5 µM) or GNE-049 (500 nM) for 24 h. Error bars represent means ± SD. *, P < 0.05, **, P < 0.01; Student’s t test or one-way ANOVA. Data in A–C and I–L are representative of three independent experiments. TES, transcriptional end site.
Figure S5.
Figure S5.
Knockdown of DEK in human primitive hematopoietic cells decreases quiescence. (A) Relative mRNA expression of NCoR1 and HDAC3 in freshly sorted HSCs of Dekfl/fl and Dek-cKO mice (n = 3). (B) Gel electrophoretic analysis of DNA recovered from MNase-digested nucleus of Linc-Kit+ cells, which were sorted and cultured in vitro, with treatment of RGFP-966 (5 µM) or GNE-049 (500 nM) for 24 h. (C) Analysis of quiescence of hHSPCs by Ki-67 + DAPI staining (n = 4–5). Human BM CD34+ cells (hHSPCs) were cultured in vitro and transduced to express control shRNA (shControl) or shRNA targeting DEK (either of two constructs: shDEK-1 and shDEK-2). (D) Relative mRNA expression for DEK, AKT1, and AKT2 in hHSPCs (n = 4). Error bars represent means ± SD. *, P < 0.05; **, P < 0.01; ***, P < 0.001; Student’s t test or one-way ANOVA. Data are representative of three independent experiments.
Figure 6.
Figure 6.
Targeting the Akt-mTOR pathway partially rescues Dek-cKO defective HSCs. (A) Experimental schematic for administration of PI3K-mTOR pathway inhibitors. 1 mo after pIpC injection, Dekfl/fl and Dekfl/flMx1-Cre mice were orally gavaged with NVP-BEZ235 or MK-2206 for 2 mo. (B) FACS and mean fluorescence intensity (MFI) analysis of p-S6 in HSCs of Dekfl/flMx1-Cre mice at 2 mo after inhibitor treatment (n = 3). (C) Glucose consumption of LSK cells sorted from the indicated mice. Cells were cultured in vitro for 24 h and the change in glucose concentration in the culture medium was measured (n = 4). (D) ATP level in freshly sorted HSCs (n = 4). (E) FACS analysis of Ki-67 + DAPI staining in LSK cells. (F and G) G0 phase analysis of LSK cells and HSCs in mice (n = 4). (H–K) BM cell, HPC, LSK cell, and HSC count in mice BM (n = 4–8). (L) Experimental schematic for the competitive transplantation assay. BM cells of Dekfl/fl and Dek-cKO mice were transplanted into lethally irradiated recipient mice with competitor BM cells from WT Ly5.1 mice. Recipient mice were subjected to inhibitor treatment at 1 mo after transplantation. The reconstituted BM cells of recipient mice were harvested (at 6 mo after transplantation) for analysis. (M) Percentage of donor-derived PB cells at the indicated time points in competitive transplantation assay (n = 4–5). (N) Percentage of donor-derived BM cells, HPCs, LSK cells, and HSCs at 6 mo after first transplantation (n = 4–5). (O) Experimental schematic for competitive transplantation assay. Lin cells were freshly isolated from mice and subjected to retroviral transduction to enforce the expression of PTEN with GFP fluorescence. (P) FACS analysis of GFP+ cells in donor-derived PB cells of recipient mice. (Q) Contribution of retrovirally transduced donor cells (CD45.2+GFP+) to recipient mouse PB cells after primary transplantation (n = 5). (R) Proposed model demonstrating the role and underlying mechanisms of DEK regulating quiescence and metabolic hemostasis, and self-renewal of HSCs. Error bars represent means ± SD. *, P < 0.05; **, P < 0.01; ***, P < 0.001; one-way ANOVA. Data are representative of three independent experiments.

Similar articles

Cited by

References

    1. Alenzi, F.Q., Alenazi B.Q., Ahmad S.Y., Salem M.L., Al-Jabri A.A., and Wyse R.K.. 2009. The haemopoietic stem cell: between apoptosis and self renewal. Yale J. Biol. Med. 82:7–18. - PMC - PubMed
    1. Bigas, A., and Waskow C.. 2016. Blood stem cells: from beginning to end. Development. 143:3429–3433. 10.1242/dev.142828 - DOI - PubMed
    1. Böhm, F., Kappes F., Scholten I., Richter N., Matsuo H., Knippers R., and Waldmann T.. 2005. The SAF-box domain of chromatin protein DEK. Nucleic Acids Res. 33:1101–1110. 10.1093/nar/gki258 - DOI - PMC - PubMed
    1. Broxmeyer, H.E., Kappes F., Mor-Vaknin N., Legendre M., Kinzfogl J., Cooper S., Hangoc G., and Markovitz D.M.. 2012. DEK regulates hematopoietic stem engraftment and progenitor cell proliferation. Stem Cells Dev. 21:1449–1454. 10.1089/scd.2011.0451 - DOI - PMC - PubMed
    1. Broxmeyer, H.E., Mor-Vaknin N., Kappes F., Legendre M., Saha A.K., Ou X., O’Leary H., Capitano M., Cooper S., and Markovitz D.M.. 2013. Concise review: role of DEK in stem/progenitor cell biology. Stem Cells. 31:1447–1453. 10.1002/stem.1443 - DOI - PMC - PubMed

Publication types

MeSH terms