. 2021 Aug;21(8):2749-2761.
doi: 10.1111/ajt.16570. Epub 2021 Apr 12.

SARS-CoV-2-specific serological and functional T cell immune responses during acute and early COVID-19 convalescence in solid organ transplant patients

Affiliations

SARS-CoV-2-specific serological and functional T cell immune responses during acute and early COVID-19 convalescence in solid organ transplant patients

Alexandre Favà et al. Am J Transplant. 2021 Aug.

Abstract

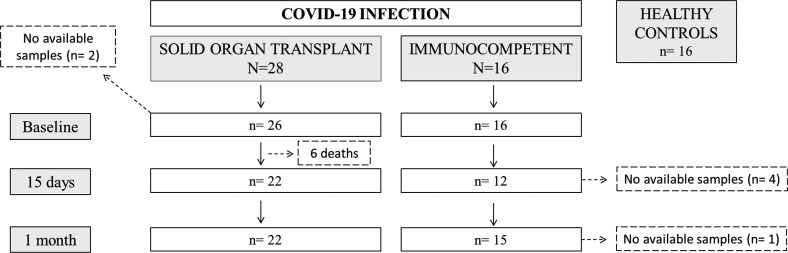
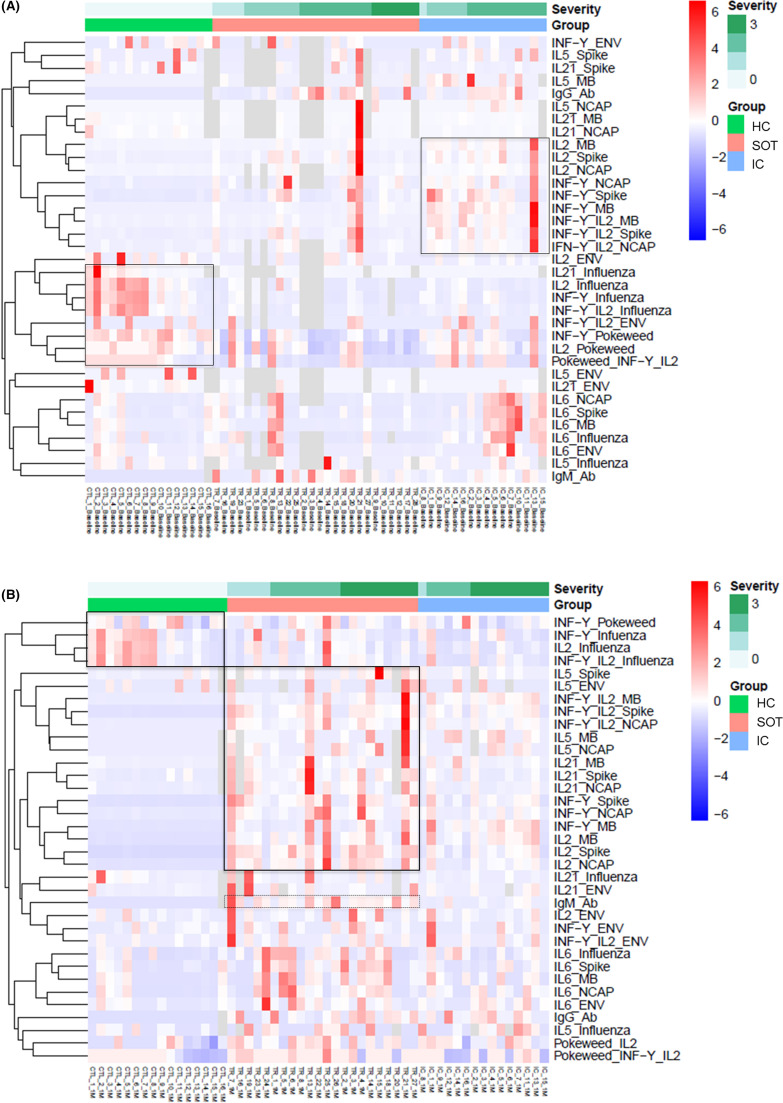
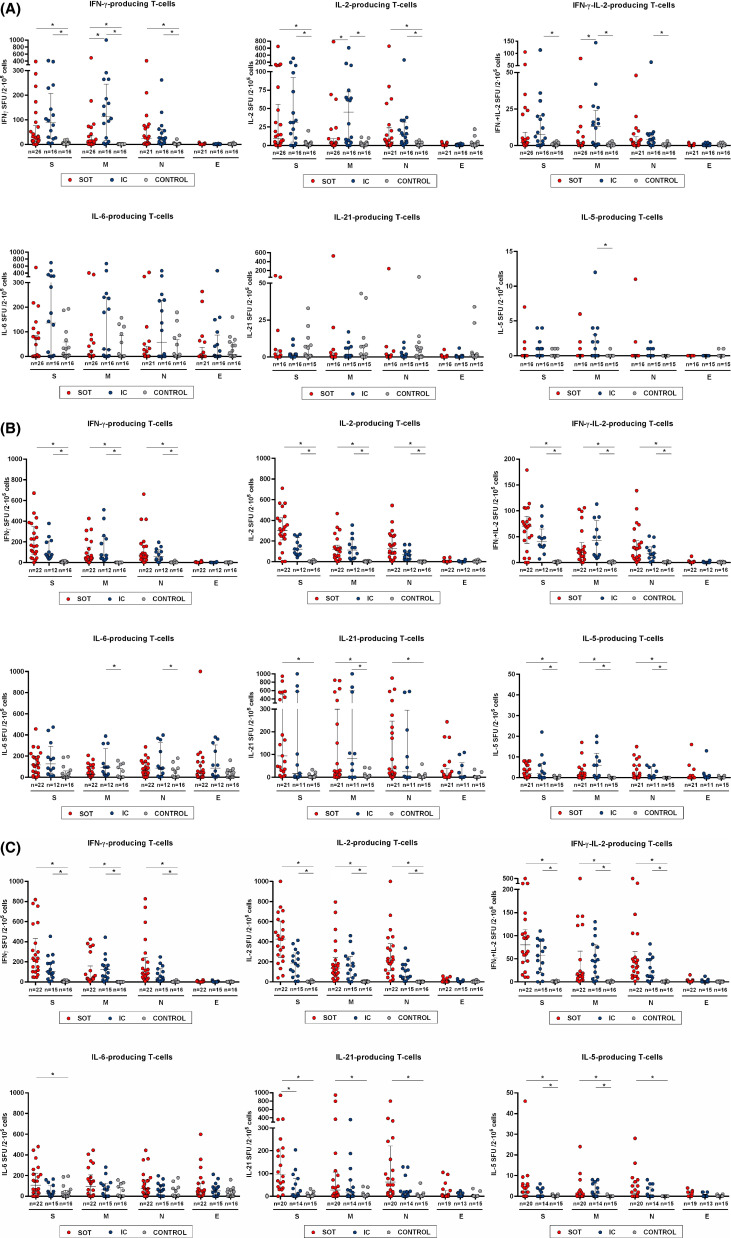
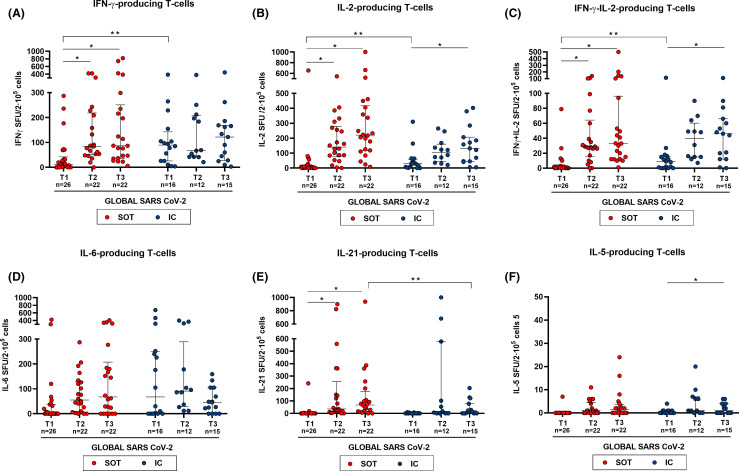
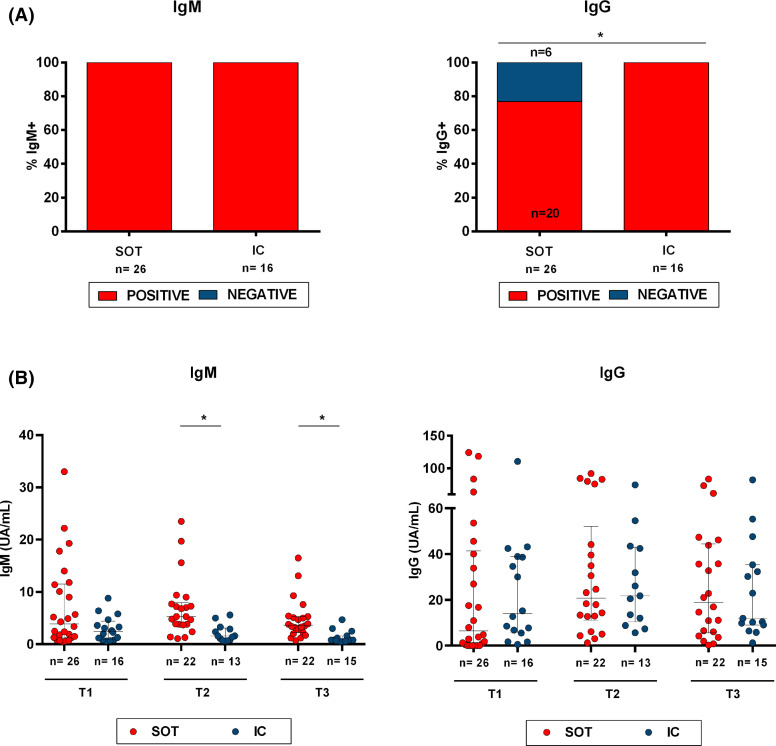
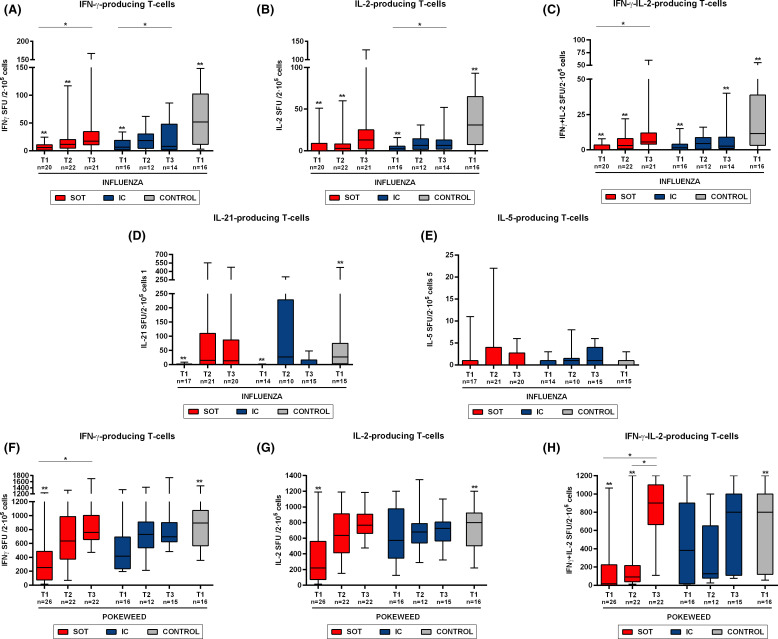
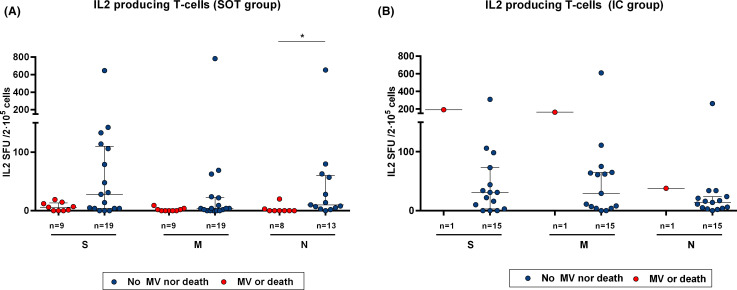
The description of protective humoral and T cell immune responses specific against SARS-CoV-2 has been reported among immunocompetent (IC) individuals developing COVID-19 infection. However, its characterization and determinants of poorer outcomes among the at-risk solid organ transplant (SOT) patient population have not been thoroughly investigated. Cytokine-producing T cell responses, such as IFN-γ, IL-2, IFN-γ/IL-2, IL-6, IL-21, and IL-5, against main immunogenic SARS-CoV-2 antigens and IgM/IgG serological immunity were tracked in SOT (n = 28) during acute infection and at two consecutive time points over the following 40 days of convalescence and were compared to matched IC (n = 16) patients admitted with similar moderate/severe COVID-19. We describe the development of a robust serological and functional T cell immune responses against SARS-CoV-2 among SOT patients, similar to IC patients during early convalescence. However, at the infection onset, SOT displayed lower IgG seroconversion rates (77% vs. 100%; p = .044), despite no differences on IgG titers, and a trend toward decreased SARS-CoV-2-reactive T cell frequencies, especially against the membrane protein (7 [0-34] vs. 113 [15-245], p = .011, 2 [0-9] vs. 45 [5-74], p = .009, and 0 [0-2] vs. 13 [1-24], p = .020, IFN-γ, IL-2, and IFN-γ/IL-2 spots, respectively). In summary, our data suggest that despite a certain initial delay, SOT population achieve comparable functional immune responses than the general population after moderate/severe COVID-19.

Keywords: COVID-19 infection; T cell biology; adaptive immunity; basic (laboratory) research / science; clinical research / practice; heart transplantation / cardiology; infection and infectious agents; kidney transplantation / nephrology; liver transplantation / hepatology; solid organ transplantation.


Figures

FIGURE 1
FIGURE 1
Flowchart of the study
FIGURE 2
FIGURE 2
Heatmaps generated by hierarchical clustering of SARS-CoV-2-specific and non-specific immune responses for SOT, IC patients, and HC, according to the COVID-19 disease severity (0 = no oxygen need; 1 = oxygen need; 2 = acute respiratory distress syndrome, 3 = death). Immune responses used for clustering were differentially expressed (fold change >2, false discovery rate p < .05). Gray fields indicate missing values. (A) Heatmap performed at first time point during acute COVID-19 infection (7; 4–11 days after the diagnosis) among 26 SOT, 16 IC, and 16 HC. (B). Heatmap performed during the early convalescent period (40; 37–44 days after the diagnosis) of COVID-19 disease in 22 SOT, 15 IC, and 16 HC [Color figure can be viewed at wileyonlinelibrary.com]
FIGURE 3
FIGURE 3
Cytokine profile of T cell responses against main structural SARS-CoV-2 proteins Spike (S), Membrane (M), Nucleoprotein (N), and Envelope (E). Frequencies of IFN-γ, IL-2, IFN-γ/IL-2, IL-6, IL-5, and IL-21-producing T cells were assessed among the three study group samples at different time points. *p < .05, calculated with Kruskal-Wallis test. (A) T1 = 16; 12–19 days. (B) T2 = 32; 25–37 days. (C) T3 = 49; 43–53 days after symptom onset [Color figure can be viewed at wileyonlinelibrary.com]
FIGURE 4
FIGURE 4
Global T cell responses specific to SARS-CoV-2 at different time points (median T cell frequencies against the three SARS-CoV-2 immunogenic antigens: S, M, and N). At T1, N = 42 (SOT = 26, IC = 16); T2, N = 34 (SOT = 22, IC = 12), and T3, N = 37 (SOT = 22, IC = 15). Median and IQR are shown. Intragroup paired analysis; *p < .05 evaluated with Friedman’s test. Significant intergroup differences (IC vs. SOT) are also shown; **p < .05 (analyzed by Mann-Whitney U test) [Color figure can be viewed at wileyonlinelibrary.com]
FIGURE 5
FIGURE 5
IgM and IgG antibody responses to SARS-CoV-2. (A) Percentage at T1 of SOT and IC patients with detectable SARS-CoV-2-specific IgM and IgG class-switching. *p < .05 (Chi-square test). (5B) IgM and IgG titers for every time point and study group (SOT and IC). *p < .05 (Mann-Whitney test analysis) [Color figure can be viewed at wileyonlinelibrary.com]
FIGURE 6
FIGURE 6
T cell responses against non-specific SARS-CoV-2 antigens (influenza and PWM) at the different time points of study. Percentile 5–95 represented by whiskers; median and IQR inside the boxes. Intragroup paired analysis; *p < .05 evaluated with Friedman’s test. Significant differences with healthy controls are shown by **p < .05 (analyzed by Mann-Whitney U test). No differences were found between IC and SOT [Color figure can be viewed at wileyonlinelibrary.com]
FIGURE 7
FIGURE 7
Baseline SARS-CoV-2-specific IL-2-producing T cell frequencies and clinical outcomes in SOT and IC patients with severe COVID-19 infection. IL-2-producing frequencies between patients with a poor outcome (VM or death) and those with a favorable clinical evolution. (A) SOT patients **p < .05 (analyzed by Mann-Whitney U test). (B) IC patients. Only one IC patient required mechanical ventilation [Color figure can be viewed at wileyonlinelibrary.com]

References

    1. Guan W-J, Ni Z-Y, Hu YU, et al. Clinical characteristics of coronavirus disease 2019 in China. N Engl J Med. 2020;382(18):1708–1720. - PMC - PubMed
    1. He XI, Lau EHY, Wu P, et al. Temporal dynamics in viral shedding and transmissibility of COVID-19. Nat Med. 2020. 10.1038/s41591-020-0869-5 - DOI - PubMed
    1. Wu Z, McGoogan JM. Characteristics of and important lessons from the coronavirus disease 2019 (COVID-19) outbreak in China: summary of a report of 72314 cases from the chinese center for disease control and prevention. JAMA - J Am Med Assoc. 2020;323(13):1239–1242. - PubMed
    1. Williamson EJ, Walker AJ, Bhaskaran K, et al. Factors associated with COVID-19-related death using OpenSAFELY. Nature. 2020;584(7821):430–436. - PMC - PubMed
    1. Hotez PJ, Corry DB, Strych U, Bottazzi ME. COVID-19 vaccines: neutralizing antibodies and the alum advantage. Nat Rev Immunol. 2020;20(7):399–400. - PMC - PubMed

Publication types

Substances