. 2021 May 20;81(10):2064-2075.e8.
doi: 10.1016/j.molcel.2021.03.010. Epub 2021 Mar 22.

mTORC1 promotes cell growth via m6A-dependent mRNA degradation

Affiliations

mTORC1 promotes cell growth via m6A-dependent mRNA degradation

Sungyun Cho et al. Mol Cell. .

Abstract

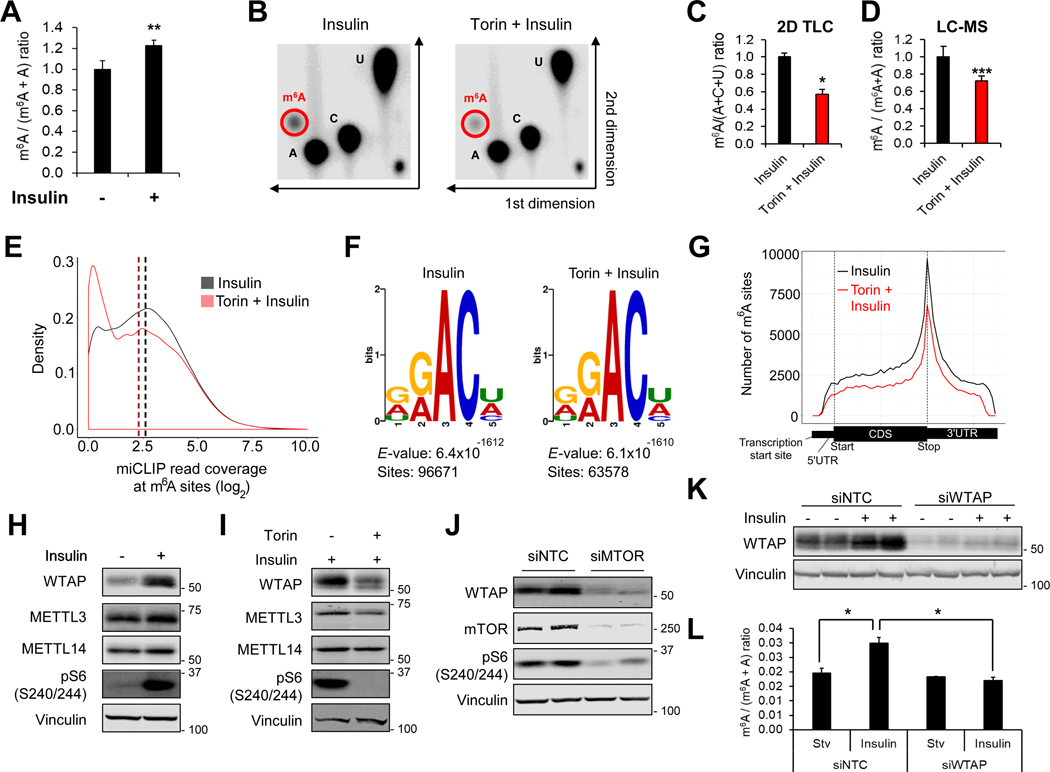
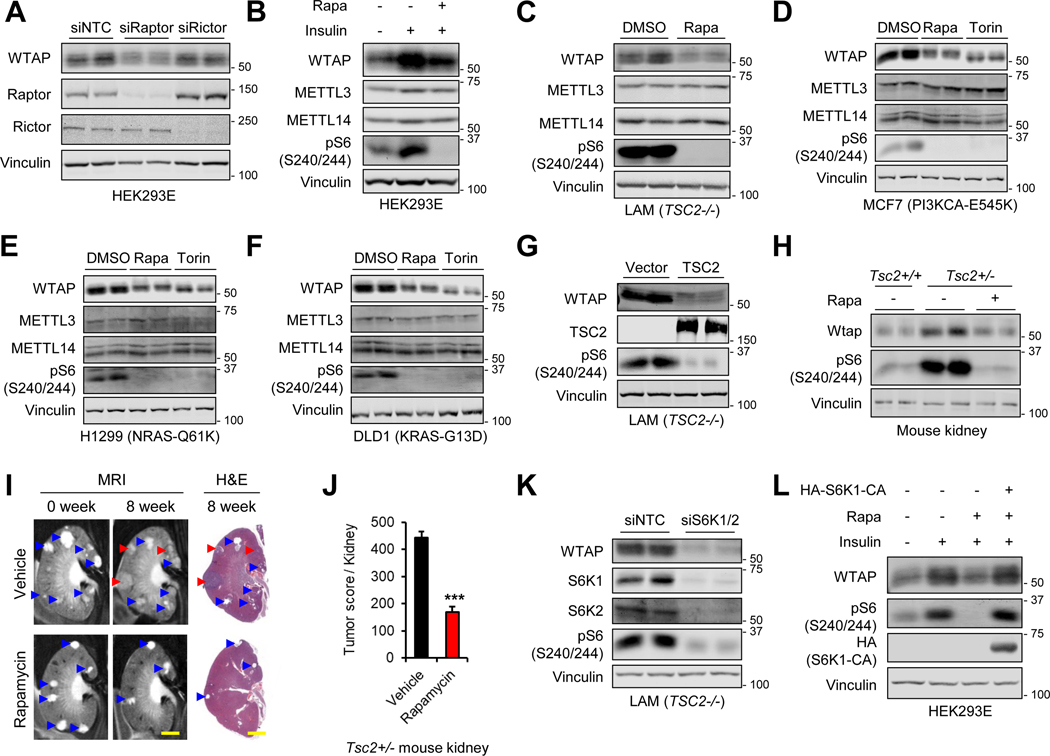
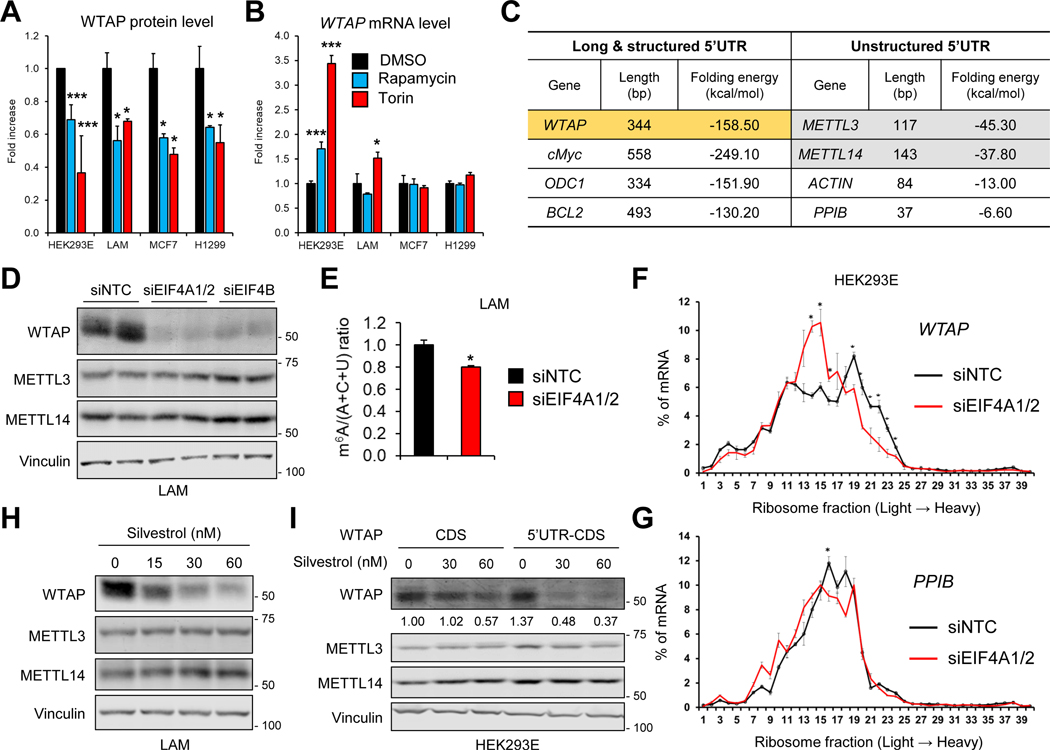
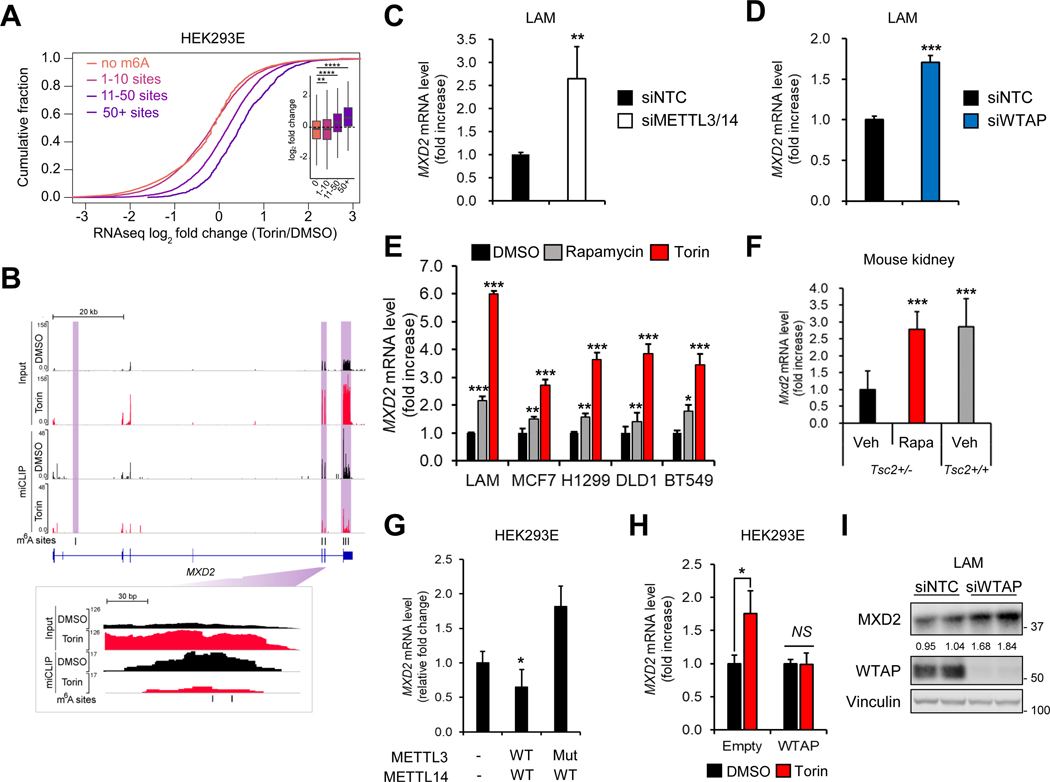
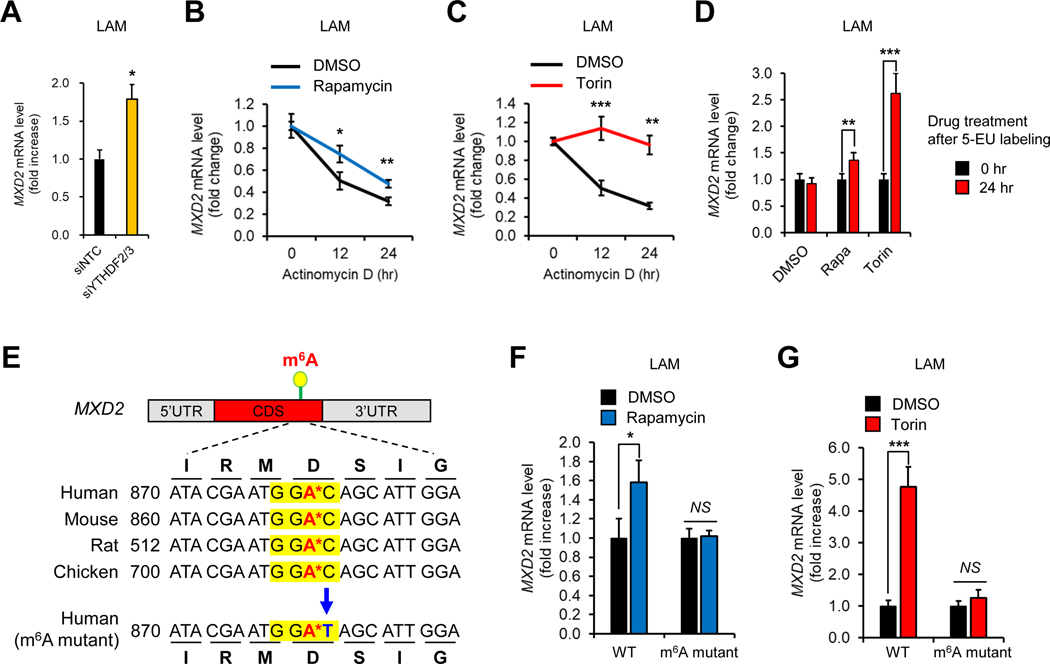
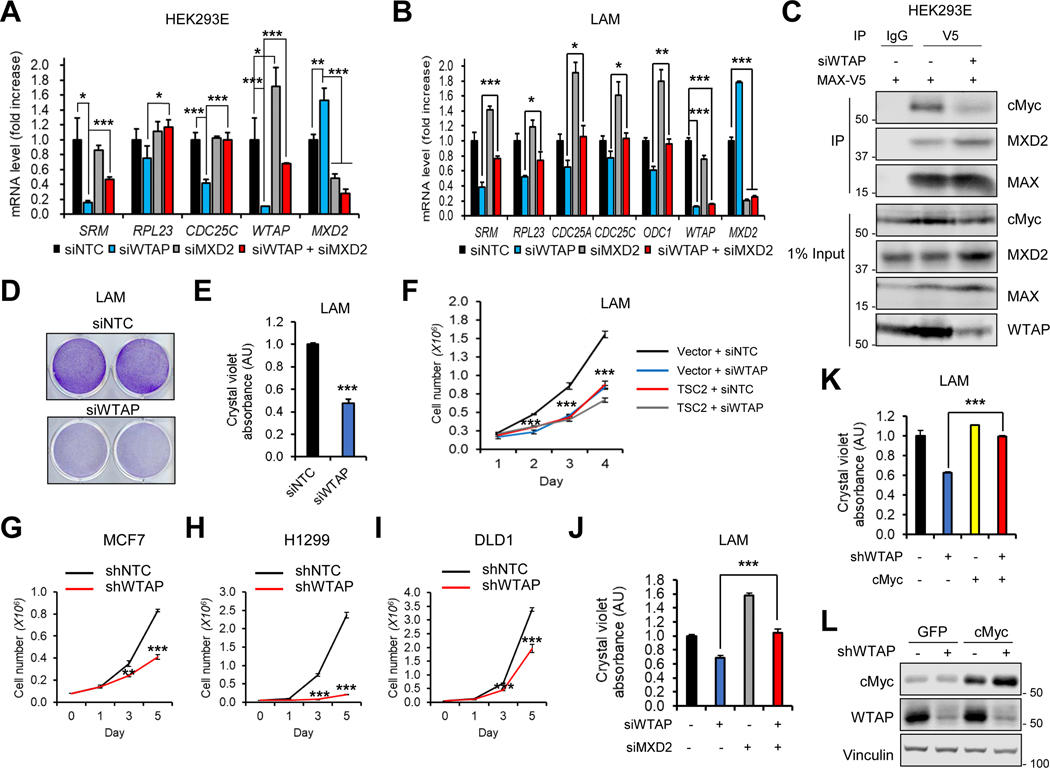
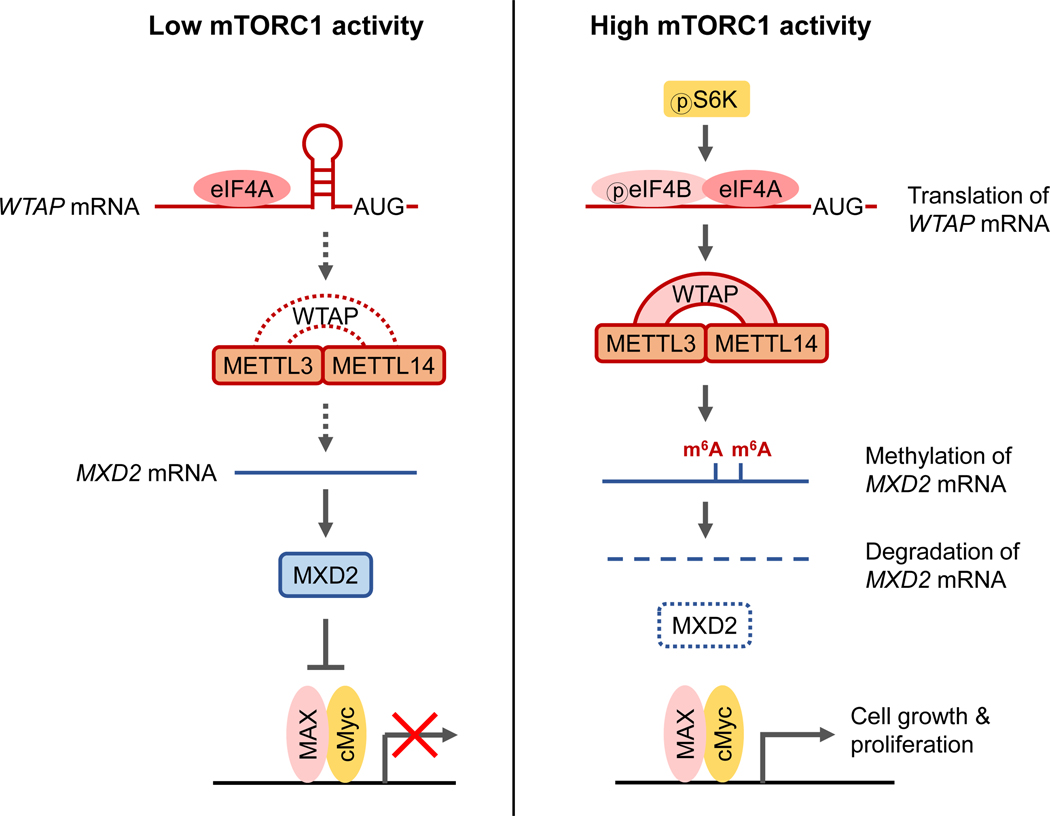
Dysregulated mTORC1 signaling alters a wide range of cellular processes, contributing to metabolic disorders and cancer. Defining the molecular details of downstream effectors is thus critical for uncovering selective therapeutic targets. We report that mTORC1 and its downstream kinase S6K enhance eIF4A/4B-mediated translation of Wilms' tumor 1-associated protein (WTAP), an adaptor for the N6-methyladenosine (m6A) RNA methyltransferase complex. This regulation is mediated by 5' UTR of WTAP mRNA that is targeted by eIF4A/4B. Single-nucleotide-resolution m6A mapping revealed that MAX dimerization protein 2 (MXD2) mRNA contains m6A, and increased m6A modification enhances its degradation. WTAP induces cMyc-MAX association by suppressing MXD2 expression, which promotes cMyc transcriptional activity and proliferation of mTORC1-activated cancer cells. These results elucidate a mechanism whereby mTORC1 stimulates oncogenic signaling via m6A RNA modification and illuminates the WTAP-MXD2-cMyc axis as a potential therapeutic target for mTORC1-driven cancers.

Keywords: MXD2; Protein translation; S6K1; WTAP; YTHDF readers; cMyc; eIF4A; m(6)A mRNA modification; mRNA stability; mTORC1.


Conflict of interest statement

Declaration of interests J.B. is an advisory board member for Molecular Cell. S.R.J. is scientific founder of, is advisor to, and owns equity in Gotham Therapeutics.

Figures

Figure 1.
Figure 1.. mTOR induces m6A modification of mRNAs.
(A) LC-MS analysis of m6A levels in twice-purified poly(A)-RNA from HEK293E cells. Cells were treated with insulin (200 nM, 30 hr) after overnight serum starvation. (B-C) Two-dimensional thin layer chromatograph (2D TLC, B) analysis of nucleotide levels in HEK293E cells. Cells were serum starved overnight and treated with insulin (200 nM, 30 hr) with or without pretreatment of torin1 (250 nM). Twice-purified poly(A)-RNAs were digested with nuclease T1 and radio-labeled with 32P-ATP. (C) shows quantification of the intensity of nucleotide spots in (B). (D) LC-MS analysis of m6A levels in HEK293E cells serum starved overnight and treated with insulin (200 nM, 30 hr) with or without pretreatment of torin1 (250 nM). (E) Density plot of m6A read coverage at m6A sites. miCLIP was performed in HEK293E cells serum starved overnight and treated with insulin (200 nM, 30 hr) with or without pretreatment of torin1 (250 nM). The log2 value of miCLIP reads was calculated at each m6A site. A density plot represents changes at miCLIP reads at individual sites. The mean read density for each sample is indicated by dashed vertical lines. (F) MEME-CHIP motif enrichment analysis of miCLIP reads. (G) Metagene plot of the frequency of m6A sites throughout the transcript body. (H) Immunoblot analysis of HEK293E cells treated with insulin (200 nM, 30 hr) after overnight serum starvation. (I) Immunoblot analysis of HEK293E cells serum starved overnight and treated with insulin (200 nM, 30 hr) with or without pretreatment of torin1 (250 nM). (J) Immunoblot analysis of HEK293E cells treated with siRNA against non-targeting control (NTC) or mTOR. (K, L) Immunoblot (K) and LC-MS (L) analysis of HEK293E cells stimulated with insulin (200 nM, 30 hr) after overnight serum starvation. Cell were treated with siRNA against non-targeting control (NTC) or WTAP. N ≥ 3. *p < 0.05. **p < 0.01. ***p < 0.001. Error bars show standard deviation (SD).
Figure 2.
Figure 2.. mTORC1-S6K1 signaling regulates WTAP expression.
(A) Immunoblot analysis of HEK293E cells treated with siRNAs against each denoted gene. (B) Immunoblot analysis of HEK293E cells serum starved overnight and treated with insulin (200 nM, 30 hr) with or without pretreatment of rapamycin (100 nM). (C-F) Immunoblot analysis of human LAM 621–101 (C), MCF7 (D), H1299 (E), and DLD1 (F) cells treated with rapamycin (100 nM, 24 hr) or torin1 (250 nM, 24 hr). (G) Immunoblot analysis of LAM 621–101 (TSC2−/−) cells expressing empty vector or TSC2. (H) Immunoblot analysis of kidney from wild type (Tsc2+/+) and Tsc2 heterozygous (Tsc2+/−) mice treated with vehicle or rapamycin (8 mg/kg) for 8 weeks. (I) Representative magnetic resonance imaging (MRI) and histology (H&E stained sections) images of kidneys from Tsc2+/− mice before and after vehicle or rapamycin (8 mg/kg) treatment for 8 weeks. Blue arrowheads indicate cysts and papillary lesions. Red arrowheads indicate solid tumors. Scale bars, 2 mm. (J) Tumor score was calculated by the sum of the tumor lesion area from H&E images. Tsc2+/− mice were treated with vehicle or rapamycin (8 mg/kg) for 8 weeks. N ≥ 6. ***p < 0.001. Error bars show standard error of the mean (SEM). (K) Immunoblot analysis of LAM 621–101 (TSC2−/−) cells treated with siRNAs against each denoted gene. (L) Immunoblot analysis of HEK293E cells transfected with empty vector or constitutively active S6K1-CA (S6K1-F5A/R3A/T389E). Cells were serum starved overnight and treated with insulin (200 nM, 30 hr) with or without pretreatment of rapamycin (100 nM).
Figure 3.
Figure 3.. eIF4A/4B promotes translation of WTAP.
(A, B) Quantification of immunoblot results (A) or qPCR analysis (B) of WTAP in HEK293E, LAM, MCF7, and H1299 cells with or without rapamycin (100 nM) or torin1 (250 nM). N = 3. *p < 0.05. ***p < 0.001 Error bars show standard deviation (SD). (C) Analysis of the nucleotide length and Gibbs free energy of 5’UTR. (D) Immunoblot analysis of LAM 621–101 (TSC2−/−) cells treated with siRNAs against each denoted gene. (E) Quantification of the 2D TLC analysis of nucleotide levels in LAM 621–101 (TSC2−/−) cells. Cells were treated with siRNAs against each denoted gene. N = 2. *p < 0.05. Error bars show standard deviation (SD). (F, G) qPCR analysis of sucrose-gradient polysome fractions of HEK293E cells treated with siRNAs against each denoted gene. N = 2. *p < 0.05. Error bars show standard error of the mean (SEM). (H) Immunoblot analysis of LAM 621–101 (TSC2−/−) cells treated with silvestrol for 24 hr. (I) Immunoblot analysis of WTAP knockout HEK293E cells transfected with empty vector or WTAP containing coding region (CDS) or 5’UTR and CDS (5’UTR-CDS). Cells were treated with silvestrol for 24 hr. Numbers below each band show the quantification of band intensity normalized by loading control.
Figure 4.
Figure 4.. mTORC1 and m6A enzymes suppress MXD2 expression.
(A) Cumulative distribution plot of transcript abundance from RNA-seq of miCLIP input samples in Figure 1 (DMSO vs. torin1). Transcripts were binned based on number of called m6A sites in DMSO samples. The log2 fold change in torin1 over DMSO was calculated for each transcript. Inset is a boxplot of the same data. Statistical significance was determined using Tukey’s HSD test. (B) Genome tracks of miCLIP and input RNA-seq coverage on MXD2. Areas containing m6A sites (black dashes) are highlighted with purple boxes. (C) qPCR analysis of MXD2 in LAM 621–101 (TSC2−/−) cells knocked down with METTL3 and METTL14. (D) qPCR analysis of MXD2 in LAM 621–101 (TSC2−/−) cells knocked down with WTAP. (E) qPCR analysis of MXD2 in LAM 621–101 (TSC2−/−), MCF7, H1299, DLD1, and BT549 cells treated with rapamycin (100 nM, 24hr) or torin1 (250 nM, 24 hr). (F) qPCR analysis of Mxd2 in Tsc2+/+ and Tsc2+/− mouse kidneys treated with vehicle or rapamycin (8 mg/kg) for 8 weeks. (G) qPCR analysis of MXD2 in HEK293E cells expressing METTL14 with METTL3-WT or METTL3-Mut (amino acids 395–398 converted from DPPW to APPA). Cells were serum starved overnight and treated with insulin (200 nM, 30 hr). Relative fold change was calculated by normalizing MXD2 mRNA levels in siMETTL3/14 compared to siNTC in each condition. (H) qPCR analysis of MXD2 in HEK293E cells expressing WTAP. The cells were for serum starved overnight and treated with insulin (200 nM, 30 hr) with or without pretreatment of torin1 (250 nM). (I) Immunoblot analysis of MXD2 in LAM 621–101 (TSC2−/−) cells treated with siRNAs against each denoted gene. N ≥ 3. *p < 0.05. **p < 0.01. ***p < 0.001. ****p < 0.0001. Error bars show standard deviation (SD).
Figure 5.
Figure 5.. mTORC1 decreases MXD2 mRNA stability via m6A modification.
(A) qPCR analysis of MXD2 in LAM 621–101 (TSC2−/−) cells knocked down with YTHDF2 and YTHDF3. (B, C) mRNA stability analysis of MXD2 in LAM 621–101 (TSC2−/−) cells treated with rapamycin (100 nM) (B) or torin1 (250 nM) (C). Cells were treated with actinomycin D (5 μg/mL) for the indicated times. (D) 5-ethynyl uridine (5-EU) labeling analysis of MXD2 mRNA. LAM 621–101 (TSC2−/−) cells were labeled with 5-EU overnight and treated with rapamycin (100 nM) or torin1 (250 nM) for the indicated times. (E) Schematic of conserved m6A RNA modification site and amino acids among various species. The consensus m6A modification motif is highlighted in yellow (GGA*C; A* is the methylated adenosine). Point mutation in m6A modification motif (C to T) is highlighted in blue. (F, G) qPCR analysis of wild type or m6A site-mutated MXD2. LAM 621–101 (TSC2−/−) cells were transfected with each MXD2 construct and treated with torin1(250 nM) (F) or rapamycin (100 nM) (G) for 24 hr. N ≥ 3. *p < 0.05. **p < 0.01. ***p < 0.001. Error bars show standard deviation (SD).
Figure 6.
Figure 6.. WTAP promotes cMyc activity and cell proliferation through MXD2.
(A, B) qPCR analysis of cMyc target genes in HEK293E (A) or LAM 621–101 (TSC2−/−) cells (B) knocked down with WTAP and MXD2. (C) Co-immunoprecipitation (co-IP) analysis of MAX. HEK293E cells knocked down with WTAP were transfected with MAX-V5. Immunoprecipitation was performed using IgG or anti-V5 antibodies and immunoblot analysis was performed using indicated antibodies. 1% of total cell lysate was loaded as input control. (D, E) Crystal violet (CV) staining of LAM 621–101 (TSC2−/−) cells knocked down with WTAP (D). (E) shows the quantified absorbance of solubilized CV dye. (F-I) Cell numbers were measured in LAM 621–101 (TSC2−/−) cells expressing empty vector or TSC2 (F), MCF7 (G), H1299 (H), or DLD1 (I) after knockdown of WTAP. (J) CV staining analysis of LAM 621–101 (TSC2−/−) cells knocked down with WTAP and MXI1. Graph shows quantified absorbance of solubilized CV dye. (K, L) CV staining (K) and immunoblot (L) analyses of LAM 621–101 (TSC2−/−) cells knocked down with WTAP with or without cMyc overexpression. N ≥ 3. *p < 0.05. **p < 0.01. ***p < 0.001. Error bars show standard deviation (SD).
Figure 7.
Figure 7.. mTORC1 promotes cell growth by inhibiting cMyc suppressor, MXD2, through m6A RNA modification.
mTORC1 increases cellular m6A levels by increasing the expression of methyltransferase complex adaptor protein, WTAP, through eIF4A/4B-dependent translation. In cells with high mTORC1 activity, the increased m6A modification on MXD2 mRNA decreases its stability, thereby suppressing MXD2 protein expression (right panel). In cells with low mTORC1-WTAP activity, MXD2 inhibits association of cMyc with its transcriptional co-activator MAX, which leads to decreased cMyc transcriptional activity and cell proliferation (left panel).

Comment in

Similar articles

Cited by

References

    1. Bansal H, Yihua Q, Iyer SP, Ganapathy S, Proia D, Penalva LO, Uren PJ, Suresh U, Carew JS, Karnad AB, et al. (2014). WTAP is a novel oncogenic protein in acute myeloid leukemia. Leukemia 28, 1171–1174. - PMC - PubMed
    1. Barbieri I, and Kouzarides T. (2020). Role of RNA modifications in cancer. Nat. Rev. Cancer 1–20. - PubMed
    1. Barrilleaux BL, Cotterman R, and Knoepfler PS (2013). Chromatin immunoprecipitation assays for Myc and N-Myc. Methods Mol. Biol. 1012, 117–133. - PMC - PubMed
    1. Ben-Sahra I, Hoxhaj G, Ricoult SJH, Asara JM, and Manning BD (2016). mTORC1 induces purine synthesis through control of the mitochondrial tetrahydrofolate cycle. Science 351, 728–733. - PMC - PubMed
    1. Bordeleau M-E, Robert F, Gerard B, Lindqvist L, Chen SMH, Wendel H-G, Brem B, Greger H, Lowe SW, Porco JA, et al. (2008). Therapeutic suppression of translation initiation modulates chemosensitivity in a mouse lymphoma model. J. Clin. Invest. - PMC - PubMed

Publication types

MeSH terms