. 2021 May 20;81(10):2076-2093.e9.
doi: 10.1016/j.molcel.2021.03.009. Epub 2021 Mar 22.

mTORC1 stimulates cell growth through SAM synthesis and m6A mRNA-dependent control of protein synthesis

Affiliations

mTORC1 stimulates cell growth through SAM synthesis and m6A mRNA-dependent control of protein synthesis

Elodie Villa et al. Mol Cell. .

Abstract

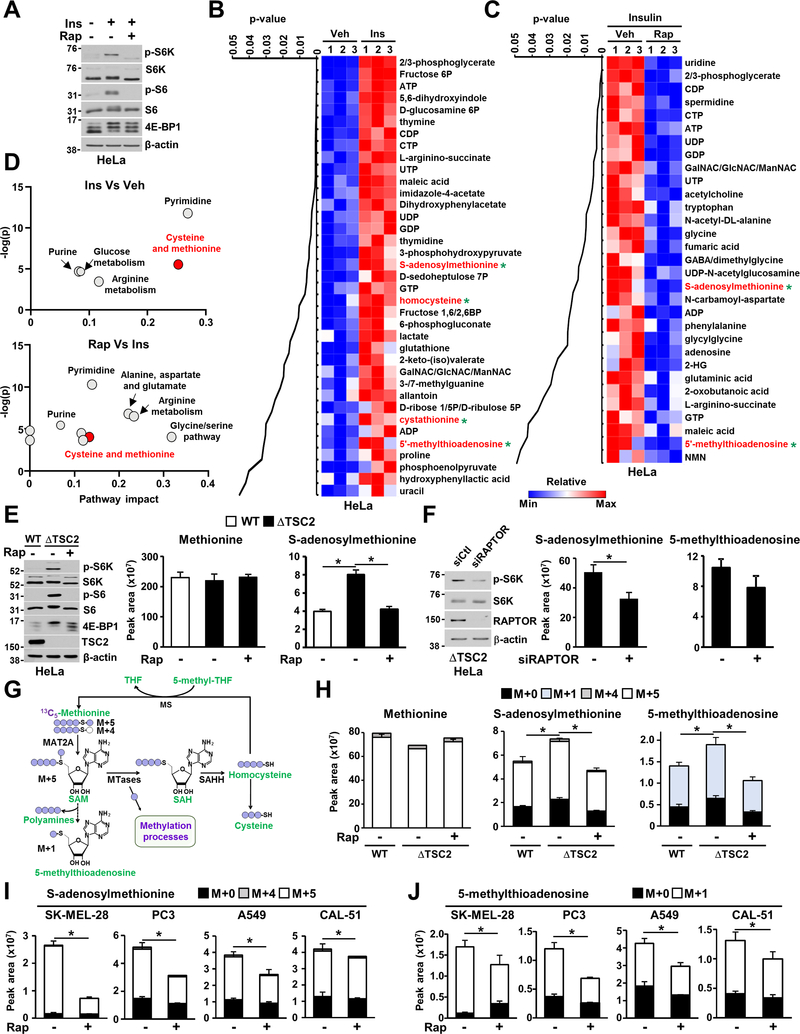
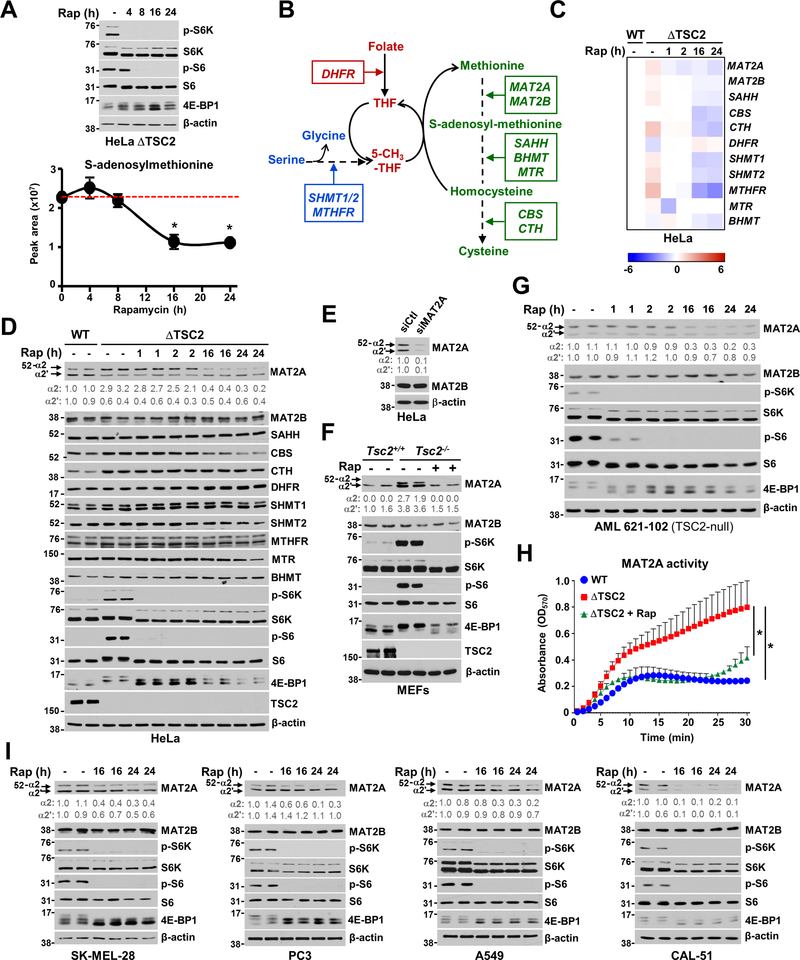
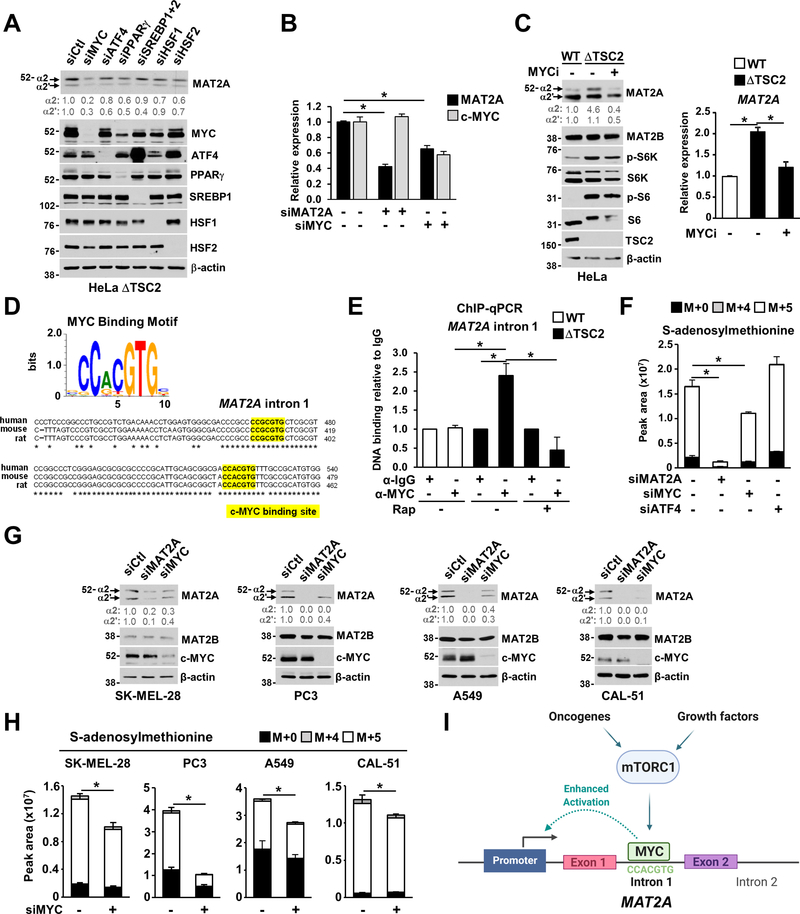
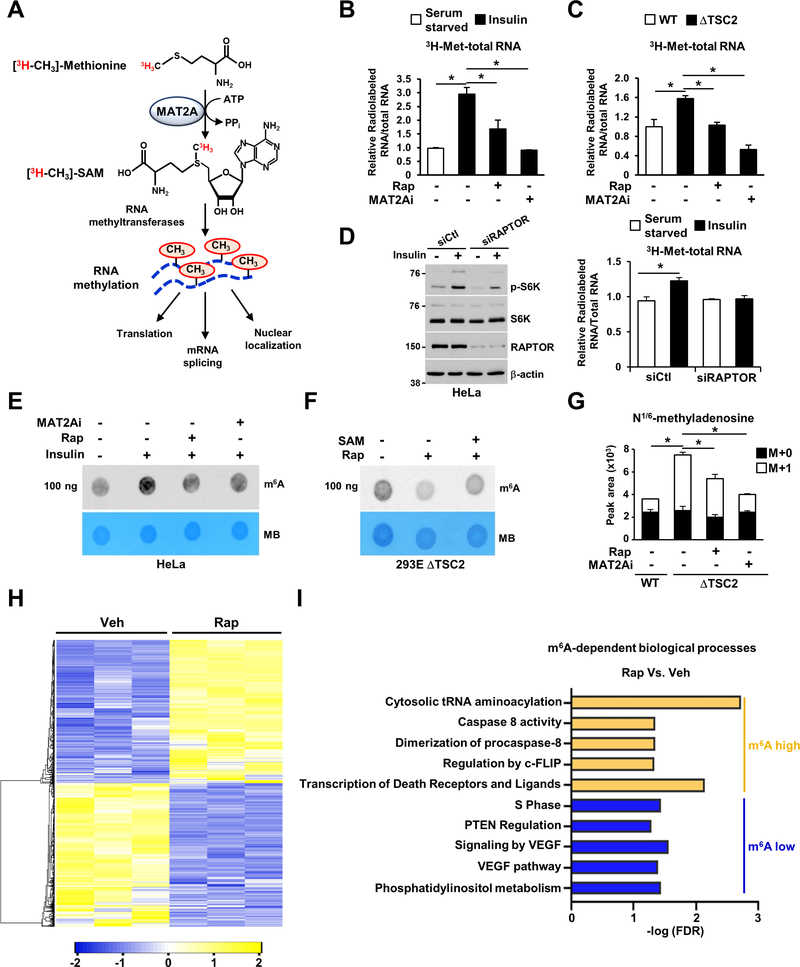
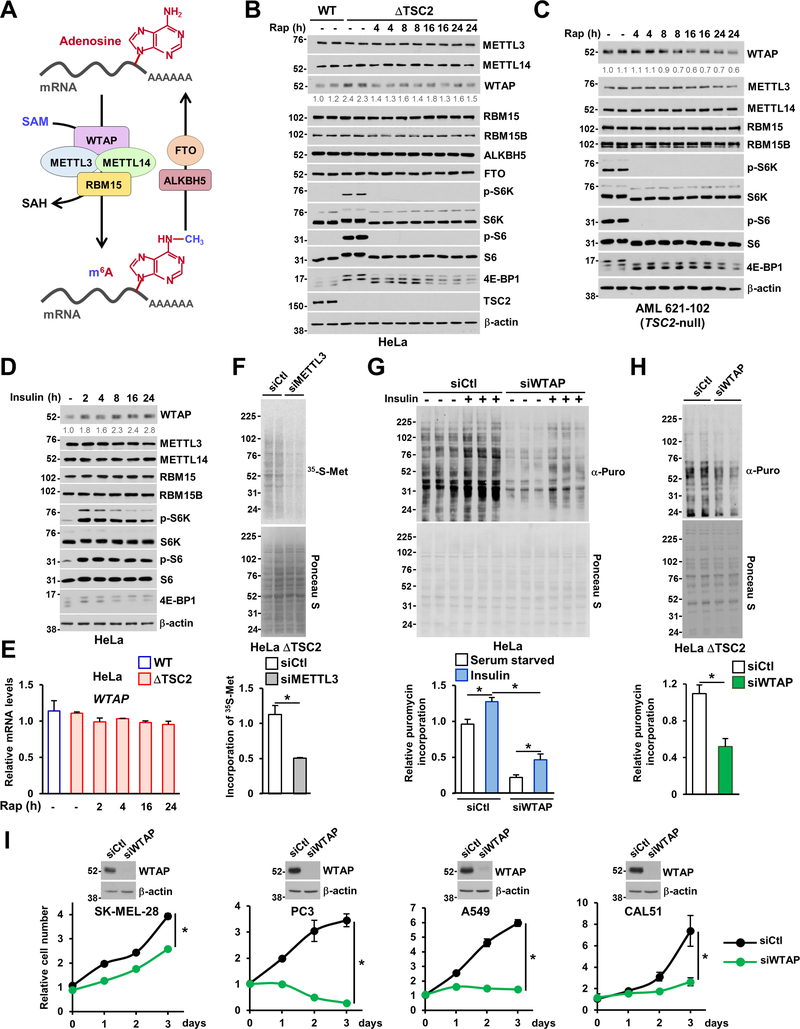
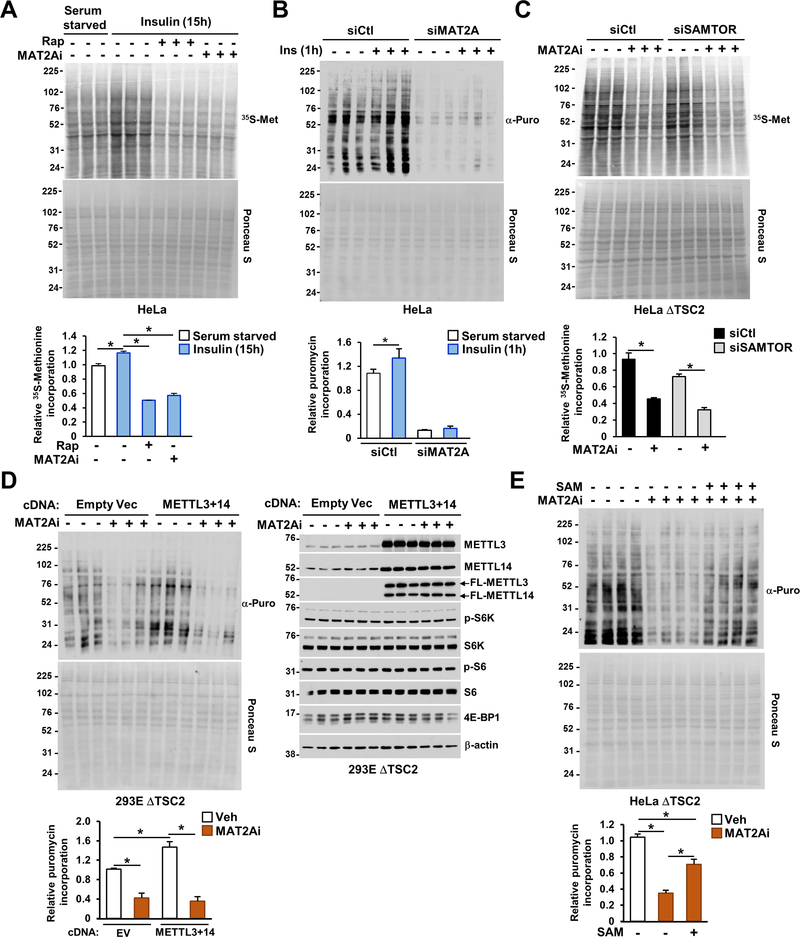
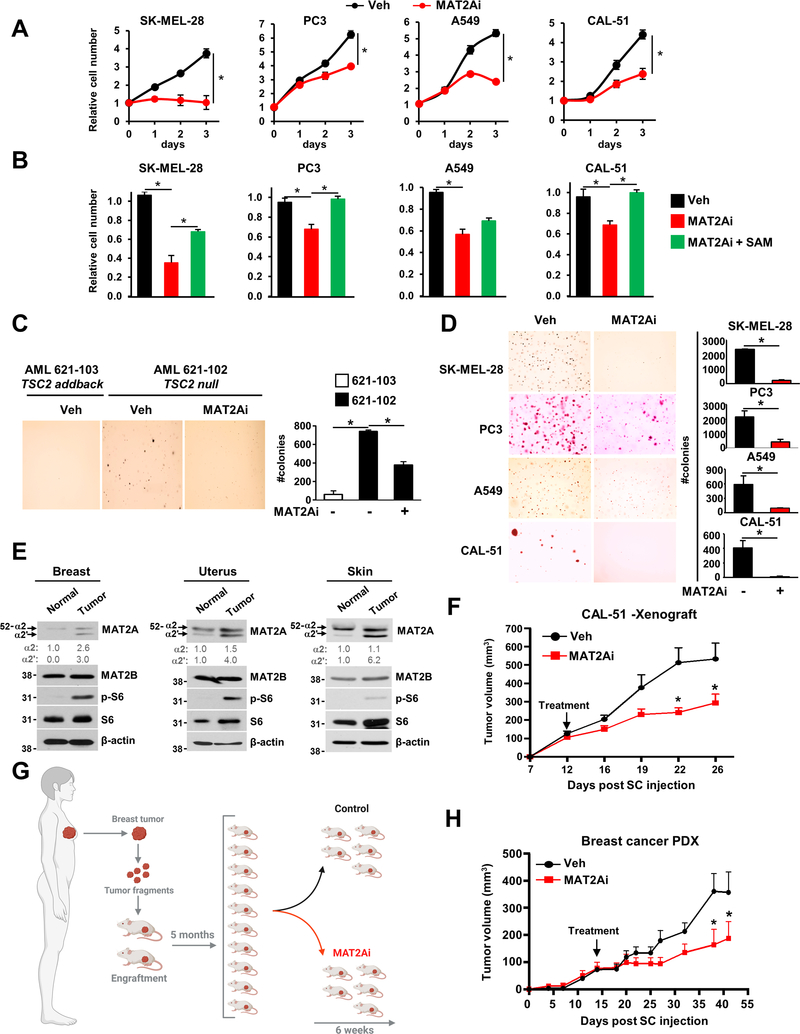
The mechanistic target of rapamycin complex 1 (mTORC1) regulates metabolism and cell growth in response to nutrient, growth, and oncogenic signals. We found that mTORC1 stimulates the synthesis of the major methyl donor, S-adenosylmethionine (SAM), through the control of methionine adenosyltransferase 2 alpha (MAT2A) expression. The transcription factor c-MYC, downstream of mTORC1, directly binds to intron 1 of MAT2A and promotes its expression. Furthermore, mTORC1 increases the protein abundance of Wilms' tumor 1-associating protein (WTAP), the positive regulatory subunit of the human N6-methyladenosine (m6A) RNA methyltransferase complex. Through the control of MAT2A and WTAP levels, mTORC1 signaling stimulates m6A RNA modification to promote protein synthesis and cell growth. A decline in intracellular SAM levels upon MAT2A inhibition decreases m6A RNA modification, protein synthesis rate, and tumor growth. Thus, mTORC1 adjusts m6A RNA modification through the control of SAM and WTAP levels to prime the translation machinery for anabolic cell growth.

Keywords: Cell growth; MAT2A; Methionine cycle; N(6)-methyladenosine; Protein Synthesis; RNA metabolism; S-adenosylmethionine; WTAP; mTOR; mTORC1.


Conflict of interest statement

Declaration of interests The authors declare no competing interests.

Figures

Figure 1.
Figure 1.. mTORC1 stimulates SAM synthesis.
(A) Immunoblots of HeLa cells grown in the absence of serum and treated for 24 hours with insulin (500 nM) in the presence of vehicle (DMSO) or rapamycin (20 nM). (B, C) Steady-state metabolite profiles of wild-type HeLa cells grown in the absence of serum and treated with vehicle, insulin (500 nM, 24 hours) or rapamycin (20 nM, 24 hours). Intracellular metabolites from three independent samples per condition were profiled by LC-MS/MS, and those significantly increased in insulin-treated cells compared to vehicle cells (B) or decreased with rapamycin-treated cells (C) are shown as row-normalized heat maps ranked according to p-value. (D) Pathway Impact analysis of steady-state metabolite profiling presented in (B, C). (E) Corresponding immunoblots and normalized peak area of methionine cycle intermediates measured by LC-MS/MS in serum-starved wild-type or ΔTSC2 HeLa cells treated with vehicle (DMSO) or rapamycin (20 nM, 15 hours). (F) Indicated metabolites measured as in (E), but ΔTSC2 HeLa cells were transfected with siRNAs targeting RAPTOR or nontargeting controls (siCtl) for 48 hours prior to metabolite extraction. (G) Schematic of carbon flow from the methionine backbone into the methionine cycle. (H-J) Normalized peak areas of 13C-labeled metabolites measured by targeted LC-MS/MS from wild-type or ΔTSC2 HeLa cells (H) or cancer cell lines (I, J) grown in the absence of serum and treated with vehicle (DMSO) or rapamycin (20 nM) for 24 hours and labeled with 13C5-methionine (200 μM) for 90 min in methionine-free media. M+n: Mass of the metabolite+n, where n represents the number of heavy carbons (13C)). Each isotopologue (M+n) reflects the newly synthesized metabolite generated from the metabolization of the tracer or metabolite derived from the tracer. (E, F, H-J) The data are presented as the mean ± SD of biological triplicates and are representative of two independent experiments. *P < 0.05 for multiple comparisons calculated using one-way ANOVA with Tukey’s HSD test (E, H) and two-tailed Student’s t-test for pairwise comparisons (F, I, J).
Figure 2.
Figure 2.. mTORC1 signaling increases MAT2A expression.
(A) Immunoblots of ΔTSC2 HeLa cells treated with vehicle (DMSO) or with a time course of rapamycin (20 nM) and metabolite extraction was performed in parallel to measure by LC-MS/MS, S-adenosylmethionine (SAM) levels. (B) Schematic of the methionine-SAM cycle and list of genes directly involved and associated with this pathway. (C) Heat map of relative gene expression in serum-deprived wild-type or ΔTSC2 HeLa cells treated with vehicle (DMSO) or rapamycin (20 nM) over a time course. (D) Immunoblots of HeLa cells treated as in (C). (E) Immunoblots of HeLa cells transfected with siRNA targeting human MAT2A or nontargeting controls (siCtl) for 48 hours. (F) Immunoblots of Tsc2+/+ and Tsc2−/− MEFs treated with vehicle (DMSO) or rapamycin (20 nM, 15 hours). Biological duplicates are shown. (G) Immunoblots from human angiomyolipoma (AML) TSC2-null cell line treated with either vehicle (DMSO) or a rapamycin time course (20 nM). Biological duplicates are shown. (H) Intracellular activity of MAT2A in wild-type or ΔTSC2 HeLa cells treated with vehicle (DMSO) or rapamycin (20 nM, 15 hours). (I) Immunoblots of the indicated cancer cell lines treated with vehicle (DMSO) or a rapamycin time course. *P < 0.05 for multiple comparisons calculated using one-way ANOVA with Tukey’s HSD test (H). (A, H) The data are plotted as the mean ± SDs of biological triplicates. Immunoblots (A, D-G, I) and QPCR data (C) are presented as representative of at least two independent experiments. (D-G, I) Quantification of total MAT2A protein levels (α1 and α2) over β-actin is shown.
Figure 3.
Figure 3.. The mTORC1-cMYC axis controls MAT2A expression and SAM synthesis.
(A) HeLa ΔTSC2 cells were transfected with siRNA targeting different transcription factors, and MAT2A protein levels were assessed by immunoblots. (B) Transcript levels of MYC and MAT2A in ΔTSC2 HeLa cells transfected with the indicated siRNAs for 48 hours. (C) Immunoblots and MAT2A transcript levels in HeLa cells treated with either vehicle (DMSO) or MYC inhibitor (10058-F4, 50 μM, 24 hours). (D) c-MYC binding motif and alignment of the human, mouse, and rat MAT2A intron 1. (E) c-MYC ChIP-qPCR in serum-starved wild-type or ΔTSC2 HeLa cells treated with vehicle (DMSO) or rapamycin (20 nM) for 15 hours. (F) Normalized peak areas of 13C-methionine-derived SAM as measured by targeted LC-MS/MS from HeLa ΔTSC2 cells transfected with the indicated siRNAs. (G) Immunoblots of the indicated cancer cells transfected with the indicated siRNAs for 48 hours. (H) Normalized peak areas of 13C-methionine-derived SAM measured as in (F) from the indicated cancer cell lines transfected with the indicated siRNAs for 48 hours. (I) Mode of activation of MAT2A transcription downstream of the mTORC1-MYC axis. (B, C, E, F, and H) The data are plotted as the mean ± SD of biological triplicates and are representative of two independent experiments (B, C, F, H). The data are plotted as the means±SEMs relative to IgG control (E). *P < 0.05 for multiple comparisons calculated using one-way ANOVA with Tukey’s HSD test (B, C, E, and F) and two-tailed Student’s t-test for pairwise comparisons (H). (A-H) The data presented are representative of at least two independent experiments. (A, C, G) Quantification of total MAT2A protein levels (α1 and α2) over β-actin is shown.
Figure 4.
Figure 4.. The dynamic increase in SAM availability downstream of mTORC1 leads to RNA N6-methylation.
(A) Schematic illustration of the strategy employed to globally measure newly methylated RNA downstream of mTORC1 signaling. (B) Relative incorporation of the radiolabel from (C3H3)-methionine into total RNA from wild-type HeLa cells grown in the absence of serum and treated with vehicle, insulin (500 nM), rapamycin (20 nM) or MAT2A inhibitor (PF-9366, 10 μM) for 24 hours. (C) Same as in (B), but ΔTSC2 HeLa cells were grown in the absence of serum and treated with vehicle, rapamycin (20 nM) or MAT2A inhibitor (PF-9366, 10 μM) for 15 hours. (D) Same as in (B), but HeLa cells were transfected with indicated siRNAs for 48 hours, and grown in the absence of serum and treated with vehicle (water), or insulin (500 nM) for 15 hours were performed. Immunoblotting is presented. (E) m6A dot blot of HeLa cells grown in the absence of serum or stimulated with insulin (500 nM) and treated with vehicle, rapamycin or PF-9366 (MAT2Ai, 10 μM) for 15 hours. Methylene blue (MB) is used as a loading control. (F) m6A dot blot of ΔTSC2 HEK293E cells grown in the absence of serum and treated with vehicle (DMSO) or rapamycin (20 nM) for 15 hours in the presence or absence of SAM (1mM). (G) Normalized peak areas of 13C-labeled m6A derived from 13C5-methionine, measured by targeted LC-MS/MS, extracted from wild-type or ΔTSC2 HeLa cells treated with vehicle (DMSO), rapamycin (20 nM) or MAT2A inhibitor (PF-9366, 10 μM) for 15 hours. (H) Hierarchical clustering analysis of the differentially expressed genes from ΔTSC2 HeLa cells treated with vehicle or rapamycin (20 nM) for 24 hours. (I) GO terms enriched from differential m6A RNA transcripts in response to rapamycin (20 nM, 24 hours) in ΔTSC2 HeLa cells. (B-D, G) The data are plotted as the mean ± SDs of biological triplicates and are representative of two independent experiments. *P < 0.05 for multiple comparisons calculated using one-way ANOVA with Tukey’s HSD test (B-D, G).
Figure 5.
Figure 5.. Activation of mTORC1 stimulates WTAP protein abundance to control m6A RNA, protein synthesis and cell proliferation.
(A) Schematic illustrating m6A RNA modification machinery. The m6A RNA methyltransferase complex comprised of METTL3, METTL14 (methyltransferase-like 3 and 14), WTAP (Wilms tumor 1-associated protein), and RBM15/B, serve as m6A “writer”, demethylases (e.g., FTO and ALKBH5) serve as m6A “erasers”. (B) Immunoblots of wild-type and ΔTSC2 HeLa cells treated with vehicle (DMSO) or with a time-course of rapamycin (20 nM). (C) Immunoblots of human angiomyolipoma (AML) TSC2-null cell line treated as in B. (D) Immunoblots of HeLa cells grown in the absence of serum and treated over a time course with insulin (500 nM). (E) WTAP transcript levels from wild-type and ΔTSC2 HeLa cells grown in the absence of serum and treated with vehicle or rapamycin at the indicated times. (F) ΔTSC2 HeLa cells were transfected with siRNA targeting METTL3 or nontargeting controls (siCtl) for 48 hours and pulse-labeled with [35S]-methionine for the final 5 minutes. The protein synthesis rate was measured by autoradiogram, while total protein was assessed by Ponceau S staining. Quantification of the 35S signal is presented. (G) HeLa were transfected with indicated siRNAs for 48 hours and serum-starved or stimulated with insulin for 15 hours. Cells were labeled with puromycin (10 μg/mL) for the final 10 minutes, and the protein synthesis rate was measured by chemiluminescence. Quantification of the puromycin incorporated into nascent protein is presented. (H) ΔTSC2 HeLa cells were transfected with indicated siRNAs for 48 hours and labeled with puromycin (10 μg/ml) as in (G). Quantification of the puromycin incorporated into nascent protein is presented. (I) Indicated cancer cells were transfected with specified siRNAs for 48 hours and were grown in media containing 10% dialyzed serum, and Cell Titer-Glo measurements were performed every 24 hours. Immunoblot for each cell line is presented. (E-H) The data are plotted as the mean ± SDs of biological triplicates. *P < 0.05 for pairwise comparisons calculated using a two-tailed Student t-test (F, H, I) or one-way ANOVA with Tukey’s HSD test for multiple comparisons (G). Experiments are representative of at least two independent experiments. (B-D) Quantification of WTAP protein levels over β-actin is shown.
Figure 6.
Figure 6.. The mTORC1-MAT2A axis supports protein synthesis upstream of m6A.
(A) HeLa cells were grown in the absence of serum and stimulated for 15 hours with insulin (500 nM) in the presence or absence of rapamycin (20 nM) or PF-9366 (MAT2Ai, 10 μM). Cells were treated with a pulse label of [35S]-methionine for the final 5 minutes, and the protein synthesis rate was measured by autoradiogram, while total protein was assessed by Ponceau S staining. Quantification of the 35S signal is presented. (B) HeLa cells were transfected with indicated siRNAs for 48 hours, and grown in the absence of serum for 15 hours and stimulated with insulin (500 nM) for 1 hour. Cell were labeled with puromycin (10 μg/mL) for the final 10 minutes, and the protein synthesis rate was measured by chemiluminescence while total protein was assessed by Ponceau S staining. Quantification of the puromycin incorporated into nascent protein is presented. (C) ΔTSC2 HeLa cells were transfected with indicated siRNAs for 48 hours and treated and quantified as in (A). (D) ΔTSC2 HEK293E cells were transfected with indicated cDNA constructs for 48 hours and treated with vehicle (DMSO) or PF-9366 (MAT2Ai, 10 μM) for 15 hours. Cells were treated and processed as in (B). Immunoblots of HeLa cells were analyzed in parallel to the experiment. (E) ΔTSC2 HeLa cells were treated with vehicle (DMSO) or PF-9366 (MAT2Ai, 10 μM) for 6 hours in the presence or absence of SAM (2 mM) and treated and quantified as in (B). (A-E) The data are plotted as the mean ± SDs of biological triplicates. *P < 0.05 for multiple comparisons calculated using one-way ANOVA with Tukey’s HSD test. Experiments are representative of at least two independent experiments.
Figure 7.
Figure 7.. SAM depletion inhibits tumor growth in a breast cancer PDX model.
(A) Cancer cell lines treated with vehicle or MAT2Ai (PF-9366, 10 μM) were grown in 1% serum for 72 hours, and Cell Titer-Glo measurements were performed every 24 hours. (B) Cancer cell lines grown in 1% serum treated with vehicle, PF-9366 (MAT2Ai, 10 μM), or PF-9366 (10 μM) in the presence of SAM (1 mM). Relative growth was measured as in (A). (C) Soft agar colony formation assay with indicated AML cells treated with vehicle (DMSO) or MAT2Ai (PF-9366, 10 μM). Cell images were acquired at 3× magnification. (D) Same as in (C), but colonies were from the indicated cancer cell lines. (E) Immunoblots of human patient protein lysates from the indicated cancers. Quantification of total MAT2A protein levels (α1 and α2) over β-actin is shown. (F) CAL-51 cells were subcutaneously injected into athymic nude mice (n=5 per group). Mice were treated with vehicle (corn oil) or FIDAS-5 (MAT2Ai, 50 mg/kg) and tumor volume was monitored over time. (G) Experimental design for the PDX experiment. (H) PDX of breast cancer bearing TP53 and PIK3CAH1047 mutations was subcutaneously injected into the flanks of NOD.Cg-Prkdcscid Il2rgtm1Wj1/SzJ mice. Mice were randomized 1:1 to receive vehicle (PEG/Tween 5%) or MAT2Ai (PF-9366, 50 mg/kg), and tumor volume was monitored over time. (A-D, F, H) The data are plotted as the mean ± SDs of biological triplicates and are representative of at least two independent experiments. *P < 0.05 by one-way ANOVA with Tukey’s post hoc test for multiple comparisons and a two-tailed Student’s t-test for pairwise comparisons.

Comment in

References

    1. Ables GP, and Johnson JE (2017). Pleiotropic responses to methionine restriction. Exp Gerontol 94, 83–88. - PubMed
    1. Adams JR, Xu K, Liu JC, Agamez NM, Loch AJ, Wong RG, Wang W, Wright KL, Lane TF, Zacksenhaus E, et al. (2011). Cooperation between Pik3ca and p53 mutations in mouse mammary tumor formation. Cancer research 71, 2706–2717. - PubMed
    1. Alarcón CR, Lee H, Goodarzi H, Halberg N, and Tavazoie SF (2015). N6-methyladenosine marks primary microRNAs for processing. Nature 519, 482–485. - PMC - PubMed
    1. Albers E (2009). Metabolic characteristics and importance of the universal methionine salvage pathway recycling methionine from 5’-methylthioadenosine. IUBMB Life 61, 1132–1142. - PubMed
    1. Atochina-Vasserman EN, Abramova E, James ML, Rue R, Liu AY, Ersumo NT, Guo CJ, Gow AJ, and Krymskaya VP (2015). Pharmacological targeting of VEGFR signaling with axitinib inhibits Tsc2-null lesion growth in the mouse model of lymphangioleiomyomatosis. Am J Physiol Lung Cell Mol Physiol 309, L1447–1454. - PMC - PubMed

Publication types

MeSH terms