. 2021 Sep;41(9):2395-2409.
doi: 10.1177/0271678X211004312. Epub 2021 Mar 24.

Comparison of [11C]UCB-J and [18F]FDG PET in Alzheimer's disease: A tracer kinetic modeling study

Affiliations

Comparison of [11C]UCB-J and [18F]FDG PET in Alzheimer's disease: A tracer kinetic modeling study

Ming-Kai Chen et al. J Cereb Blood Flow Metab. 2021 Sep.

Abstract

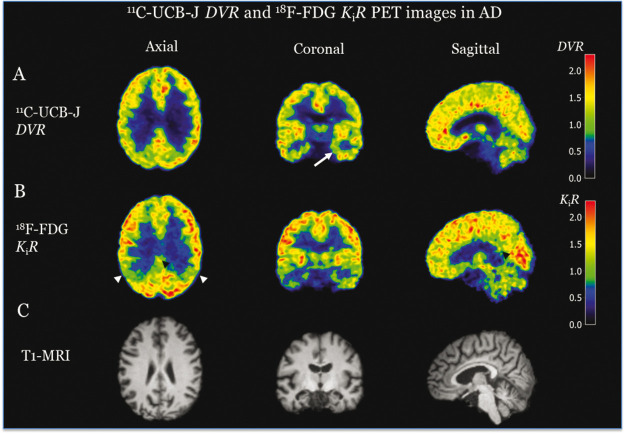
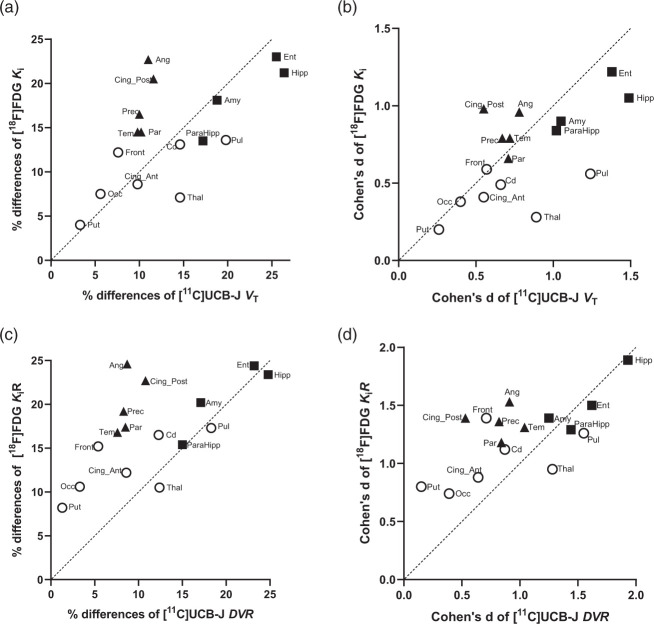
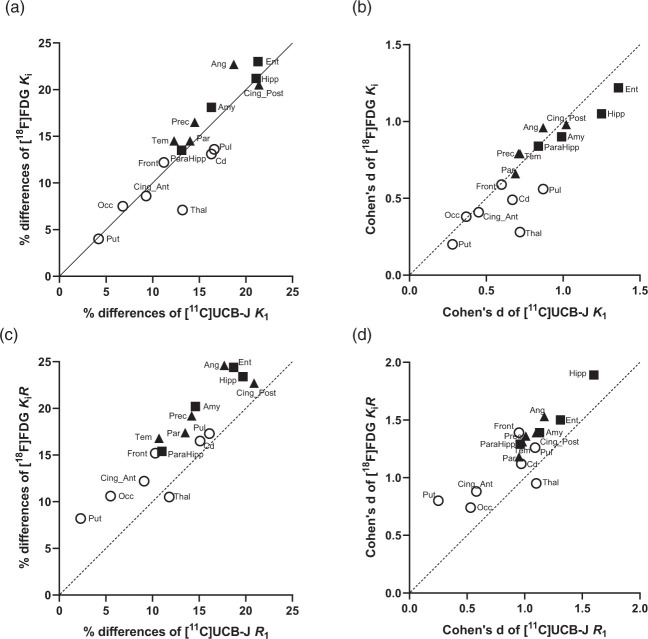
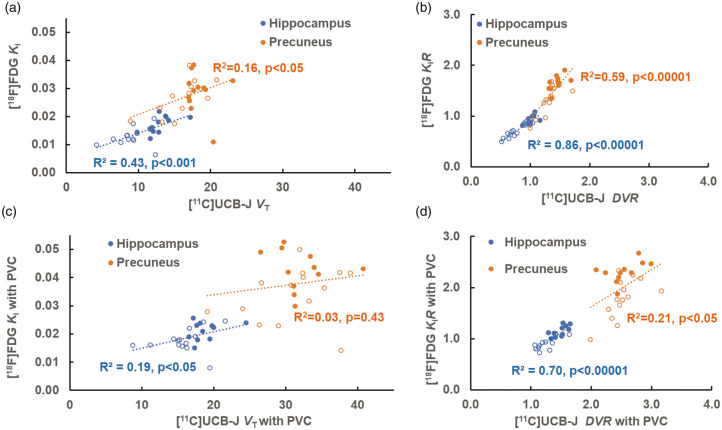
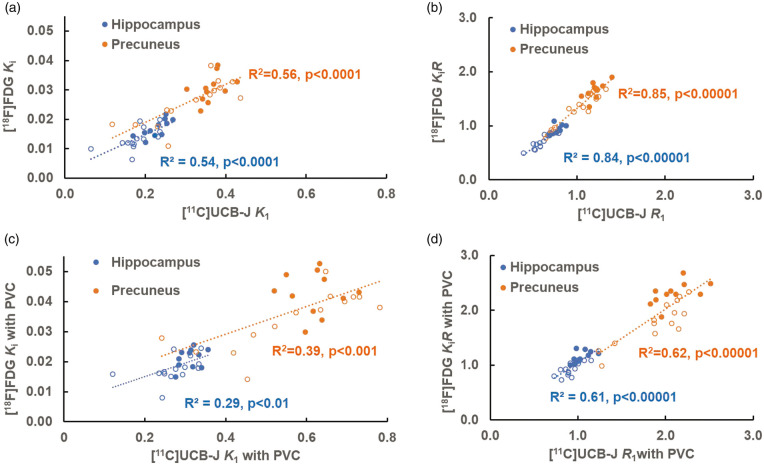
[11C]UCB-J PET for synaptic vesicle glycoprotein 2 A (SV2A) has been proposed as a suitable marker for synaptic density in Alzheimer's disease (AD). We compared [11C]UCB-J binding for synaptic density and [18F]FDG uptake for metabolism (correlated with neuronal activity) in 14 AD and 11 cognitively normal (CN) participants. We assessed both absolute and relative outcome measures in brain regions of interest, i.e., K1 or R1 for [11C]UCB-J perfusion, VT (volume of distribution) or DVR to cerebellum for [11C]UCB-J binding to SV2A; and Ki or KiR to cerebellum for [18F]FDG metabolism. [11C]UCB-J binding and [18F]FDG metabolism showed a similar magnitude of reduction in the medial temporal lobe of AD -compared to CN participants. However, the magnitude of reduction of [11C]UCB-J binding in neocortical regions was less than that observed with [18F]FDG metabolism. Inter-tracer correlations were also higher in the medial temporal regions between synaptic density and metabolism, with lower correlations in neocortical regions. [11C]UCB-J perfusion showed a similar pattern to [18F]FDG metabolism, with high inter-tracer regional correlations. In summary, we conducted the first in vivo PET imaging of synaptic density and metabolism in the same AD participants and reported a concordant reduction in medial temporal regions but a discordant reduction in neocortical regions.

Keywords: SV2A; Alzheimer’s disease; PET; Synaptic Density; [18F]FDG.


Conflict of interest statement

Declaration of conflicting interests: The author(s) declared the following potential conflicts of interest with respect to the research, authorship, and/or publication of this article: MKC reports research support from the Dana Foundation and Eli Lilly for the conduct of the study. APM, REC, and CHvD report grants from National Institutes of Health for the conduct of the study. MKC reports consulting fees from Eisai and Actinium and clinical trial of Merck outside the submitted work. APM reports grants for clinical trials from Genentech and Eisai outside the submitted work. YH reports research grants from the UCB and Eli Lilly outside the submitted work. YH, NBN, and REC have a patent for a newer version of the tracer. REC is a consultant for Rodin Therapeutics and has received research funding from UCB. REC reports having received grants from AstraZeneca, Astellas, Eli Lilly, Pfizer, Taisho, and UCB, outside the submitted work. CHvD reports consulting fees from Kyowa Kirin, Roche, Merck, Eli Lilly, and Janssen and grants for clinical trials from Biogen, Novartis, Eli Lilly, Merck, Eisai, Janssen, Roche, Genentech, Toyama, and Biohaven, outside the submitted work. No other disclosures are reported.

Figures

Figure 1.
Figure 1.
Representative (A) [11C]UCB-J DVR and (B) [18F]FDG PET KiR images and (C) MRI images in AD. Evident lower [11C]UCB-J binding in the hippocampus of AD was noted (arrow denotes the left hippocampus). Evident hypometabolism was also noted in the hippocampus of AD. In addition, hypometabolism was also noted in lateral temporal and parietal cortices of AD (white arrows denote the parietal cortices) as well as posterior cingulate (black arrow heads).
Figure 2.
Figure 2.
Scatter plots of regional percentage differences of means between CN and AD (a, c) and Cohen’s d (b, d) for [11C]UCB-J (VT and DVR on x-axis) versus [18F]FDG (Ki and KiR on y-axis). (a) Comparing [11C]UCB-J VT and [18F]FDG Ki demonstrated distinct patterns, including slightly higher % differences of [11C]UCB-J VT in medial temporal regions (■ Hipp, Ent, Amy, and ParaHipp) and thalamic regions, but smaller % differences in susceptible neocortical regions (▲Ang, Cing_Post, Prec, Tem, Par). (b) There were larger Cohen’s d values for [11C]UCB-J VT vs. [18F]FDG Ki in medial temporal regions and thalamic regions (O Thal and Pul), but slightly lower Cohen’s d values in susceptible neocortical regions. (c) Comparing [11C]UCB-J DVR and [18F]FDG KiR demonstrated overall similar % differences in medial temporal regions, but lower % differences of [11C]UCB-J DVR in the susceptible neocortical and other examined regions (symbol O). (d) Higher Cohen’s d values for [11C]UCB-J DVR vs [18F]FDG KiR in some medial temporal regions (■ Hipp and Ent) and thalamic regions, but overall lower Cohen’s d values in [11C]UCB-J DVR in other examined regions. Amy: Amygdala; Ang: angular; CS: centrum semiovale; Cd: Caudate; Cing_Ant: Ant. Cingulate; Cing_Post: Post. Cingulate; Ent: Entorhinal; Front: Frontal; Hipp: Hippocampus; Occ: Occipital, ParaHipp: ParaHippocampus; Par: Parietal; Prec: Precuneus; Pul: Pulvinar; Put: Putamen; Tem: Temporal; Thal: Thalamus.
Figure 3.
Figure 3.
Scatter plots of regional percentage differences between CN and AD (a, c) and Cohen’s d (b, d) for [11C]UCB-J (K1 and R1 on x-axis) versus [18F]FDG (Ki and KiR on y-axis). (a) Comparing [11C]UCB-J K1 and [18F]FDG Ki demonstrated very similar % differences in most examined regions including in medial temporal regions (■ Hipp, Ent, Amy, and ParaHipp), susceptible neocortical regions (▲Ang, Cing_Post, Prec, Tem, Par), and other examined regions (o), which appeared well aligned along the identity line. (b) There were similar Cohen’s d values of [11C]UCB-J K1 vs [18F]FDG Ki in most examined regions. (c) Comparing [11C]UCB-J R1 and [18F]FDG KiR demonstrated generally lower % differences of [11C]UCB-J R1 in the examined regions. (d) Overall, there were slightly lower Cohen’s d values of [11C]UCB-J R1 vs [18F]FDG KiR in the examined regions. Amy: Amygdala; Ang: angular; CS: centrum semiovale; Cd: Caudate; Cing_Ant: Ant. Cingulate; Cing_Post: Post. Cingulate; Ent: Entorhinal; Front: Frontal; Hipp: Hippocampus; Occ: Occipital, ParaHipp: ParaHippocampus; Par: Parietal; Prec: Precuneus; Pul: Pulvinar; Put: Putamen; Tem: Temporal; Thal: Thalamus.
Figure 4.
Figure 4.
Scatter plots of regional [11C]UCB-J (VT and DVR on x-axis) versus [18F]FDG (Ki and KiR on y-axis) in the hippocampus and precuneus before (a & b) and after PVC (c & d). The solid circles indicate CN participants and the open circles indicate AD participants. (a) There were statistically significant correlations in the hippocampus (R2=0.43) and in the precuneus (R2=0.16) between [11C]UCB-J VT and [18F]FDG Ki. (b) After normalization to cerebellum, the correlations between [11C]UCB-J DVR and [18F]FDG KiR increased with higher values in the hippocampus (R2=0.86) and in the precuneus (R2=0.59). (c) After PVC, the correlations between [11C]UCB-J VT and [18F]FDG Ki were significantly lower in the hippocampus (R2=0.19) and in the precuneus (R2=0.03). (d) After normalization to cerebellum, the correlations between [11C]UCB-J DVR and [18F]FDG KiR after PVC increased in the hippocampus (R2=0.70) and in the precuneus (R2=0.21).
Figure 5.
Figure 5.
Scatter plots of regional [11C]UCB-J (K1 and R1 on x-axis) versus [18F]FDG (Ki and KiR on y-axis) in the hippocampus and precuneus before (a & b) and after PVC (c & d). The solid circles indicate CN participants and the open circles indicate AD participants. (a) There were similar statistically significant correlations between [11C]UCB-J K1 and [18F]FDG Ki in the hippocampus (R2=0.54) and in the precuneus (R2=0.56). (b) After normalization to cerebellum, the correlations between [11C]UCB-J R1 and [18F]FDG KiR increased with higher values in the hippocampus (R2=0.84) and in the precuneus (R2=0.85). (c) After PVC, the correlations between [11C]UCB-J K1 and [18F]FDG Ki were significantly lower in the hippocampus (R2=0.29) and in the precuneus (R2=0.39). (d) After normalization to cerebellum, the correlations between normalized [11C]UCB-J R1 and [18F]FDG KiR after PVC increased in the hippocampus (R2=0.61) and in the precuneus (R2=0.62).

References

    1. Jack CR, Jr, Bennett DA, Blennow K, et al.; Contributors. NIA-AA research framework: toward a biological definition of Alzheimer's disease. Alzheimers Dement 2018; 14: 535–562. - PMC - PubMed
    1. Jack CR, Jr, Bennett DA, Blennow K, et al. A/T/N: an unbiased descriptive classification scheme for Alzheimer disease biomarkers. Neurology 2016; 87: 539–547. - PMC - PubMed
    1. Klunk WE, Engler H, Nordberg A, et al. Imaging brain amyloid in Alzheimer's disease with Pittsburgh Compound-B. Ann Neurol 2004; 55: 306–319. - PubMed
    1. Barthel H, Sabri O.Clinical use and utility of amyloid imaging. J Nucl Med 2017; 58: 1711–1717. - PubMed
    1. Betthauser TJ, Cody KA, Zammit MD, et al. In vivo characterization and quantification of neurofibrillary tau PET radioligand [(18)F]MK-6240 in humans from Alzheimer's disease dementia to young controls. J Nucl Med 2019; 60: 93–99. - PMC - PubMed

Publication types

Substances

LinkOut - more resources