

PET imaging of colony-stimulating factor 1 receptor: A head-to-head comparison of a novel radioligand, 11C-GW2580, and 11C-CPPC, in mouse models of acute and chronic neuroinflammation and a rhesus monkey
- PMID: 33757319
- PMCID: PMC8393303
- DOI: 10.1177/0271678X211004146
PET imaging of colony-stimulating factor 1 receptor: A head-to-head comparison of a novel radioligand, 11C-GW2580, and 11C-CPPC, in mouse models of acute and chronic neuroinflammation and a rhesus monkey
Erratum in
-
Corrigendum.J Cereb Blood Flow Metab. 2022 Jan;42(1):216. doi: 10.1177/0271678X211044866. Epub 2021 Oct 18. J Cereb Blood Flow Metab. 2022. PMID: 34657514 Free PMC article. No abstract available.
Abstract
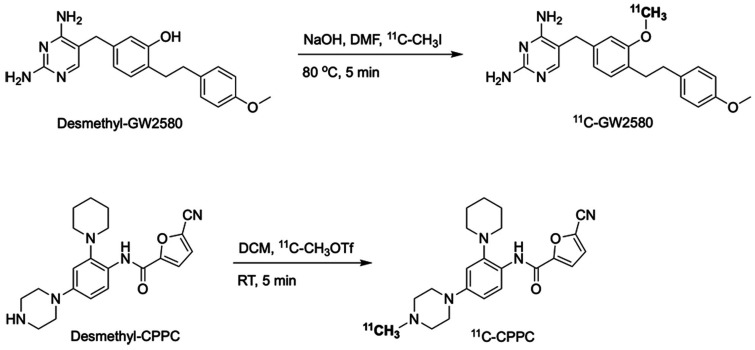
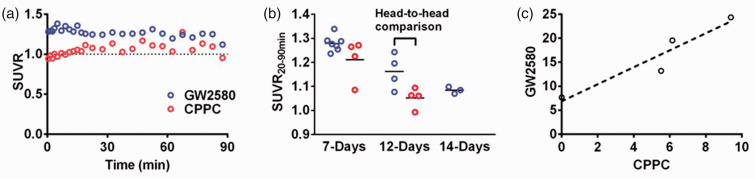
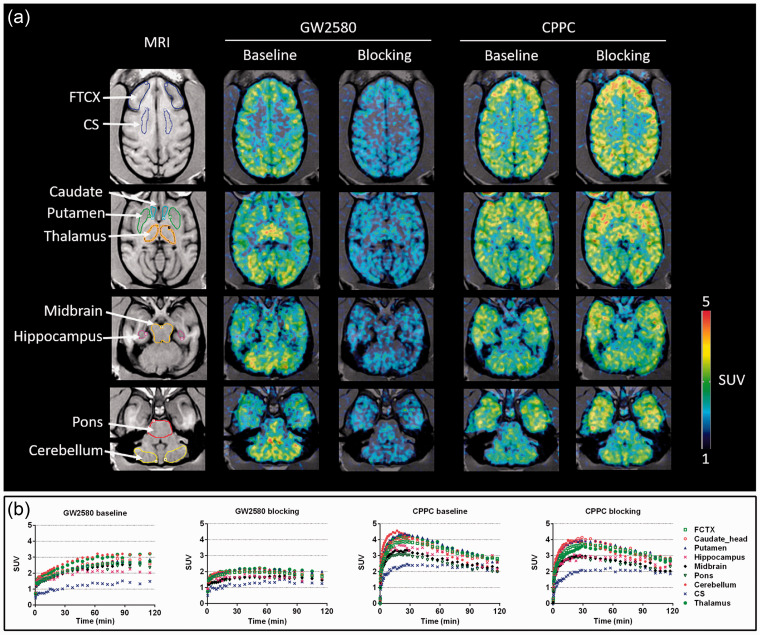
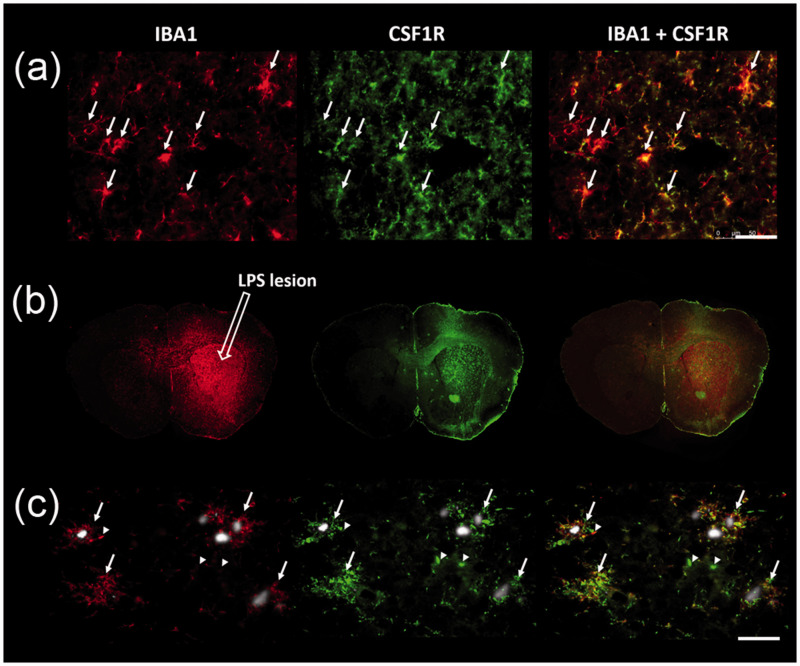
Colony-stimulating factor 1 receptor (CSF1R) is a specific biomarker for microglia. In this study, we developed a novel PET radioligand for CSF1R, 11C-GW2580, and compared it to a reported CSF1R tracer, 11C-CPPC, in mouse models of acute and chronic neuroinflammation and a rhesus monkey. Dynamic 11C-GW2580- and 11C-CPPC-PET images were quantified by reference tissue-based models and standardized uptake value ratio. Both tracers exhibited increased uptake in the lesioned striata of lipopolysaccharide-injected mice and in the forebrains of AppNL-G-F/NL-G-F-knock-in mice, spatially in agreement with an increased 18-kDa translocator protein radioligand retention. Moreover, 11C-GW2580 captured changes in CSF1R availability more sensitively than 11C-CPPC, with a larger dynamic range and a smaller inter-individual variability, in these model animals. PET imaging of CSF1R in a rhesus monkey displayed moderate-to-high tracer retention in the brain at baseline. Homologous blocker (i. e. unlabeled tracer) treatment reduced the uptake of 11C-GW2580 by ∼30% in all examined brain regions except for centrum semi-ovale white matter, but did not affect the retention of 11C-CPPC. In summary, our results demonstrated that 11C-GW2580-PET captured inflammatory microgliosis in the mouse brain with higher sensitivity than a reported radioligand, and displayed saturable binding in the monkey brain, potentially providing an imaging-based quantitative biomarker for reactive microgliosis.
Keywords: 11C-GW2580; PET; colony-stimulating factor 1 receptor, positron emission tomography; microglia; neuroinflammation.
Conflict of interest statement
Figures


Similar articles
-
Evaluation of in-vivo and in-vitro binding property of a novel PET tracer for CSF1R imaging and comparison with two currently-used CSF1R-PET tracers.Res Sq [Preprint]. 2025 Mar 20:rs.3.rs-6194254. doi: 10.21203/rs.3.rs-6194254/v1. Res Sq. 2025. Update in: EJNMMI Radiopharm Chem. 2025 May 13;10(1):23. doi: 10.1186/s41181-025-00345-8. PMID: 40166008 Free PMC article. Updated. Preprint.
-
PET imaging of microglia by targeting macrophage colony-stimulating factor 1 receptor (CSF1R).Proc Natl Acad Sci U S A. 2019 Jan 29;116(5):1686-1691. doi: 10.1073/pnas.1812155116. Epub 2019 Jan 11. Proc Natl Acad Sci U S A. 2019. PMID: 30635412 Free PMC article.
-
Evaluation of in vivo and in vitro binding property of a novel candidate PET tracer for CSF1R imaging and comparison with two currently-used CSF1R-PET tracers.EJNMMI Radiopharm Chem. 2025 May 13;10(1):23. doi: 10.1186/s41181-025-00345-8. EJNMMI Radiopharm Chem. 2025. PMID: 40360942 Free PMC article.
-
Development of brain PET imaging agents: Strategies for imaging neuroinflammation in Alzheimer's disease.Prog Mol Biol Transl Sci. 2019;165:371-399. doi: 10.1016/bs.pmbts.2019.04.005. Epub 2019 May 2. Prog Mol Biol Transl Sci. 2019. PMID: 31481170 Review.
-
Candidate Tracers for Imaging Colony-Stimulating Factor 1 Receptor in Neuroinflammation with Positron Emission Tomography: Issues and Progress.ACS Pharmacol Transl Sci. 2023 Oct 18;6(11):1632-1650. doi: 10.1021/acsptsci.3c00213. eCollection 2023 Nov 10. ACS Pharmacol Transl Sci. 2023. PMID: 37974622 Free PMC article. Review.
Cited by
-
Selecting the Best Animal Model of Parkinson's Disease for Your Research Purpose: Insight from in vivo PET Imaging Studies.Curr Neuropharmacol. 2023;21(5):1241-1272. doi: 10.2174/1570159X21666230216101659. Curr Neuropharmacol. 2023. PMID: 36797611 Free PMC article.
-
The Repertoire of Small-Molecule PET Probes for Neuroinflammation Imaging: Challenges and Opportunities beyond TSPO.J Med Chem. 2021 Dec 23;64(24):17656-17689. doi: 10.1021/acs.jmedchem.1c01571. Epub 2021 Dec 14. J Med Chem. 2021. PMID: 34905377 Free PMC article. Review.
-
Evaluation of in-vivo and in-vitro binding property of a novel PET tracer for CSF1R imaging and comparison with two currently-used CSF1R-PET tracers.Res Sq [Preprint]. 2025 Mar 20:rs.3.rs-6194254. doi: 10.21203/rs.3.rs-6194254/v1. Res Sq. 2025. Update in: EJNMMI Radiopharm Chem. 2025 May 13;10(1):23. doi: 10.1186/s41181-025-00345-8. PMID: 40166008 Free PMC article. Updated. Preprint.
-
Evaluation of [18F]JNJ-CSF1R-1 as a Positron Emission Tomography Ligand Targeting Colony-Stimulating Factor 1 Receptor.Mol Imaging Biol. 2025 Apr;27(2):163-172. doi: 10.1007/s11307-025-01991-9. Epub 2025 Feb 26. Mol Imaging Biol. 2025. PMID: 40009327
-
Meta-analysis of molecular imaging of translocator protein in major depression.Front Mol Neurosci. 2022 Sep 26;15:981442. doi: 10.3389/fnmol.2022.981442. eCollection 2022. Front Mol Neurosci. 2022. PMID: 36226319 Free PMC article.
References
Publication types
MeSH terms
Substances
LinkOut - more resources
Full Text Sources
Other Literature Sources
Research Materials
Miscellaneous
