. 2021 Jul 1:234:117981.
doi: 10.1016/j.neuroimage.2021.117981. Epub 2021 Mar 21.

Compartmental diffusion and microstructural properties of human brain gray and white matter studied with double diffusion encoding magnetic resonance spectroscopy of metabolites and water

Affiliations

Compartmental diffusion and microstructural properties of human brain gray and white matter studied with double diffusion encoding magnetic resonance spectroscopy of metabolites and water

Henrik Lundell et al. Neuroimage. .

Abstract

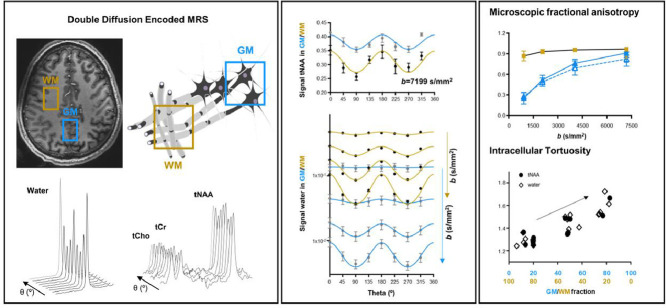
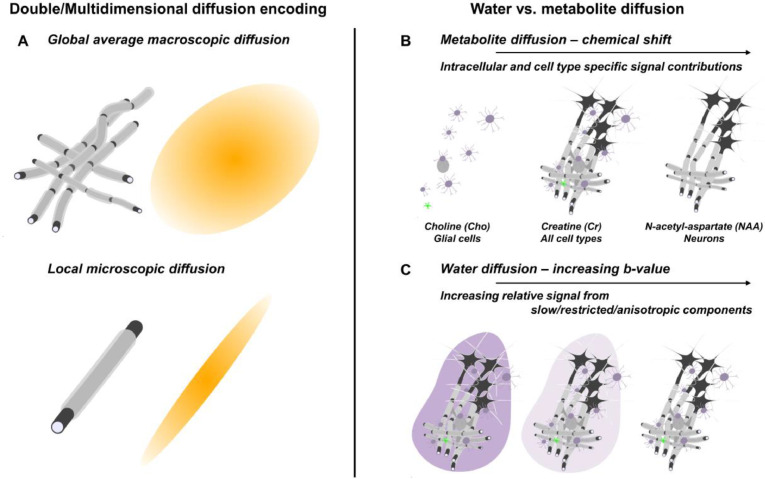
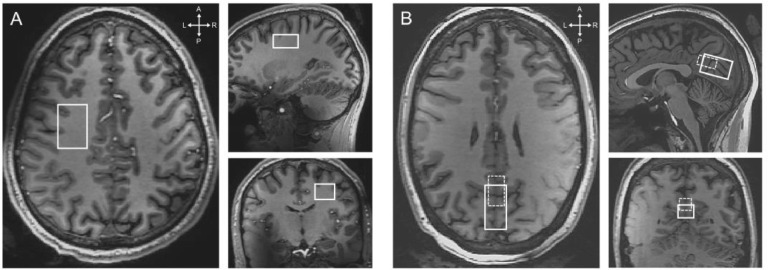
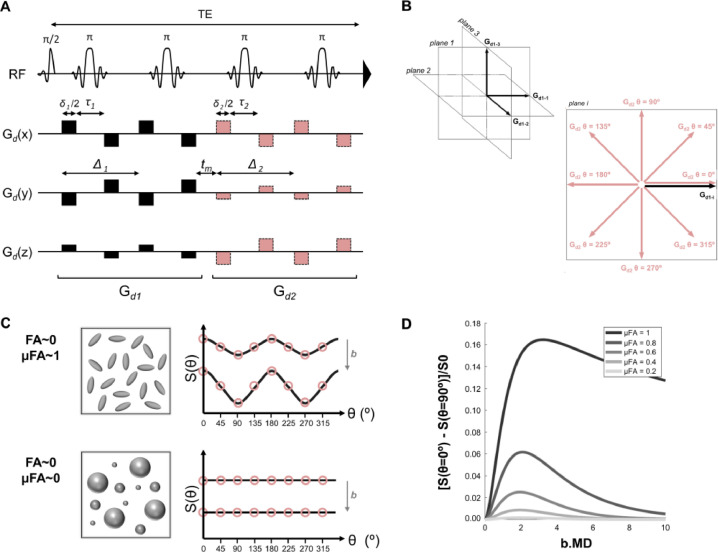
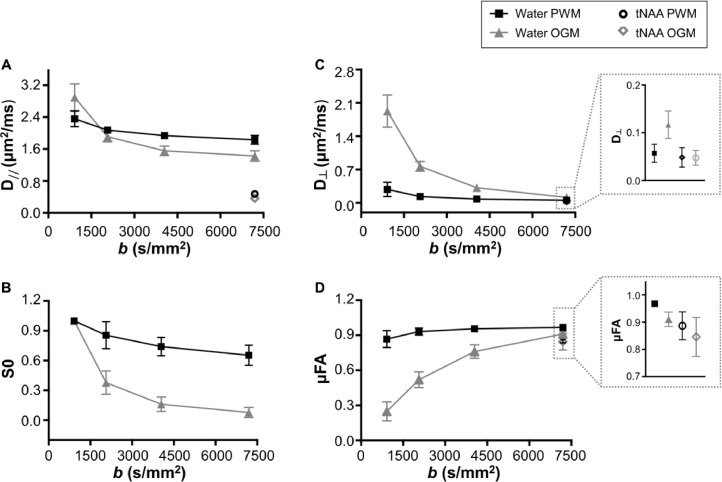
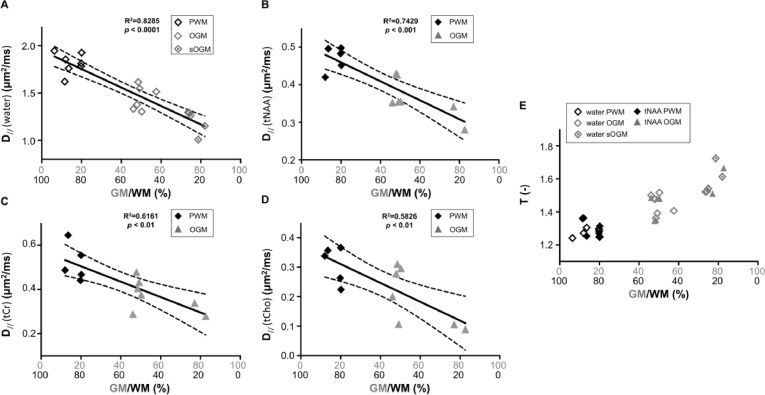
Double diffusion encoding (DDE) of the water signal offers a unique ability to separate the effect of microscopic anisotropic diffusion in structural units of tissue from the overall macroscopic orientational distribution of cells. However, the specificity in detected microscopic anisotropy is limited as the signal is averaged over different cell types and across tissue compartments. Performing side-by-side water and metabolite DDE spectroscopic (DDES) experiments provides complementary measures from which intracellular and extracellular microscopic fractional anisotropies (μFA) and diffusivities can be estimated. Metabolites are largely confined to the intracellular space and therefore provide a benchmark for intracellular μFA and diffusivities of specific cell types. By contrast, water DDES measurements allow examination of the separate contributions to water μFA and diffusivity from the intra- and extracellular spaces, by using a wide range of b values to gradually eliminate the extracellular contribution. Here, we aimed to estimate tissue and compartment specific human brain microstructure by combining water and metabolites DDES experiments. We performed our DDES measurements in two brain regions that contain widely different amounts of white matter (WM) and gray matter (GM): parietal white matter (PWM) and occipital gray matter (OGM) in a total of 20 healthy volunteers at 7 Tesla. Metabolite DDES measurements were performed at b = 7199 s/mm2, while water DDES measurements were performed with a range of b values from 918 to 7199 s/mm2. The experimental framework we employed here resulted in a set of insights pertaining to the morphology of the intracellular and extracellular spaces in both gray and white matter. Results of the metabolite DDES experiments in both PWM and OGM suggest a highly anisotropic intracellular space within neurons and glia, with the possible exception of gray matter glia. The water μFA obtained from the DDES results at high b values in both regions converged with that of the metabolite DDES, suggesting that the signal from the extracellular space is indeed effectively suppressed at the highest b value. The μFA measured in the OGM significantly decreased at lower b values, suggesting a considerably lower anisotropy of the extracellular space in GM compared to WM. In PWM, the water μFA remained high even at the lowest b value, indicating a high degree of organization in the interstitial space in WM. Tortuosity values in the cytoplasm for water and tNAA, obtained with correlation analysis of microscopic parallel diffusivity with respect to GM/WM tissue fraction in the volume of interest, are remarkably similar for both molecules, while exhibiting a clear difference between gray and white matter, suggesting a more crowded cytoplasm and more complex cytomorphology of neuronal cell bodies and dendrites in GM than those found in long-range axons in WM.

Keywords: Compartment specificity; Double diffusion encoding; Human brain tissue; Magnetic resonance spectroscopy; Microscopic anisotropy.


Conflict of interest statement

Declaration of Competing Interest None.

Figures

Image, graphical abstract
Graphical abstract
Fig 1
Fig. 1
Approaches used in this study to provide compartment-specific readouts of diffusivity: (A) Double diffusion encoding (DDE) enables the decoupling of global effects of fibers across the acquisition volume from local microscopic diffusion. (B) Studying metabolite diffusion with DDES provides access to cell-preferential or specific intracellular microscopic organization, including cell bodies and fibrous processes of the respective cell types. (C) Measuring water diffusion with DDES over a large range of b values allows separating the properties of CSF, the intra- and extracellular spaces. The progressively fading purple background indicates the gradual elimination of extracellular and CSF signals with increasing b value.
Fig 2
Fig. 2
Representative placement in the of the DDES VOI in (A) the PWM region and (B) the OGM region. The smaller OGM VOI (dashed lines) was added to increase the GM fraction within the VOI.
Fig 3
Fig. 3
(A) Schematic drawing of the DDE-sLASER sequence. For simplicity, only diffusion sensitizing gradients are shown. (B) Illustration of diffusion weighting (DW) gradient directions used in our study. The direction of the first DW group (Gd1, black vector) is fixed along one direction (larger panel to the right), while the direction of the second diffusion group (Gd2, shaded vectors) revolves in 8 angular steps in a plane that includes Gd1. This measurement is repeated for 3 orthogonal directions of Gd1 with Gd2 revolving in 3 separate orthogonal planes. (C) Schematic illustration of the modulation of the signal as a function of θ (angle between first and second encoding) expected for ensembles of rotationally disperse anisotropic (top) or isotropic (bottom) diffusion tensors for two different b values. (D) The contrast between parallel (θ = 0°) and perpendicular (θ = 90°) encodings for a rotationally uniform distribution of monodisperse diffusion tensors with different µFA as a function of the unitless attenuation factor b.MD (MD=(D// +2D)/3, Mean Diffusivity).
Fig 4
Fig. 4
Illustration of metabolite data pre-processing. Metabolite data sets consisted of individual spectra acquired with (b = 7199 s/mm2) and without (b = 0 s/mm2) diffusion-weighting (DW). DW spectra were alternatingly acquired with opposite gradient polarity (Gd+ and Gd) and with 24 angular conditions (3 (Gd1) x 8 (Gd2)). DW spectra were first powder-averaged across the three Gd1 values. DW and non-DW spectra were then quantified with LCModel (Provencher, 2001) resulting in signal amplitudes of tNAA, tCr, and tCho. The geometric means of estimates with opposite polarity were finally calculated and normalized to their respective non-DW signals.
Fig 5
Fig. 5
Illustration of individual DDES metabolite spectra for different θ in (A) PWM and (B) OGM VOIs. Following signal quantification, the θ-modulation for tNAA, tCr, and tCho in both (C) PWM (black) and (D) OGM (gray) VOIs were fitted using an ensemble of uniformly rotated axisymmetric diffusion tensors. The data (circle) and fits (solid line) for the mean over all participants are illustrated for both VOIs, and the error bars indicate the standard error of the mean.
Fig 6
Fig. 6
Fitted model parameters for the metabolites data (mean±s.d.). Statistical significance between PWM and (large) OGM (represented with *) and between tCho and tNAA (represented ‡) in both VOIs was evaluated using an unpaired Student's t-test with unequal variance and a false discovery rate correction for multiple comparison. *, p < 0.05, **, ‡‡p < 0.005 and ***, ‡‡‡p < 0.001.
Fig 7
Fig. 7
Individual water spectra (geometric mean of positive and negative gradient polarities) for different θ in (A) PWM and (B) OGM VOIs. Following signal quantification, the θ-modulation for both (C) PWM and (D) OGM VOIs was fitted using an ensemble of uniformly rotated axisymmetric diffusion tensors. The data (circles) and fits (solid line) for the mean over all participants are illustrated for both VOIs, error bars indicate the standard error.
Fig 8
Fig. 8
Water D// (A), D (B), S0 (C) and μFA (D) as a function of b value for the three brain regions: PWM VOI (black solid line) and OGM VOI (gray solid line). D and μFA values for tNAA in PWM (back circles) and OGM (gray diamonds) VOIs at the highest b value are also displayed in the zoomed boxes.
Fig 9
Fig. 9
Correlation between GM/WM tissue fraction (%) and (A) water (B) tNAA (C) tCr, and (D) tCho parallel diffusivities (D//). Data for different VOIs are represented with different markers: PWM VOI as filled black diamonds, OGM and sOGM VOIs as filled and open gray triangles, respectively. The solid line shows the linear regression and the dashed lines represent the 95% confidence intervals. (E) Tortuosity values are estimated for tNAA (filled black circles) and water (open diamonds) as a function of GM/WM tissue fraction (%). The regression lines for the tortuosity are not displayed for clarity. R2 > 0.8 and p < 0.0002 for both tNAA and water. All tests are statistically significant with a corrected threshold of p < 0.0125.
Fig 10
Fig. 10
Noise propagation in the parameter estimates for settings comparable to the metabolite acquisition for a substrate with D// = 0.5 µm2/ms and D = 0 µm2/ms (“stick” situation) comparable to tNAA in white matter. Mean and standard deviations are estimated from 1000 realizations of the data with Gaussian noise at different SNR. Metabolite data presented in this paper has an SNR range ~30–45.
Fig 11
Fig. 11
Schematic illustration of microstructural features such as deviation from propagation along a straight line and branching processes, that may affect microscopic diffusion metrics in neurons, fibrous, and protoplasmic astrocytes. Axons, dendrites and fibrous astrocytes are thin fibrous structures with few branches which may locally dictate highly anisotropic diffusion. Protoplasmic astrocytes are distinctly different, with highly branched and thicker processes that could entail a more isotropic diffusion, even at short diffusion times. In this qualitative illustration of different morphologies hypothezised to explain the differences in diffusion metrics across metabolites, different cells are not drawn to scale. Typical diameters of fibers are < 1 µm, while the processes of protoplasmic and fibrous astrocytes extend well beyond 100 µm.

Similar articles

Cited by

References

    1. Ackerman JJH, Neil JJ. The use of MR-detectable reporter molecules and ions to evaluate diffusion in normal and ischemic brain. NMR Biomed. 2010;23(7):725–733. doi: 10.1002/nbm.1530. - DOI - PMC - PubMed
    1. Assaf Y, Basser PJ. Composite hindered and restricted model of diffusion (CHARMED) MR imaging of the human brain. Neuroimage. 2005 doi: 10.1016/j.neuroimage.2005.03.042. - DOI - PubMed
    1. Budde MD, Skinner NP, Tugan Muftuler L, Schmit BD, Kurpad SN. Optimizing filter-probe diffusion weighting in the rat spinal cord for human translation. Front. Neurosci. 2017 doi: 10.3389/fnins.2017.00706. - DOI - PMC - PubMed
    1. Boer VO, van Lier ALHMW, Hoogduin JM, Wijnen JP, Luijten PR, Klomp DWJ. 7-T 1H MRS with adiabatic refocusing at short TE using radiofrequency focusing with a dual-channel volume transmit coil. NMR Biomed. 2011;24(9):1038–1046. doi: 10.1002/nbm.1641. - DOI - PubMed
    1. Callaghan PT, Jolley KW, Lelievre J. Diffusion of water in the endosperm tissue of wheat grains as studied by pulsed field gradient nuclear magnetic resonance. Biophys. J. 1979;28(1):133–141. doi: 10.1016/S0006-3495(79)85164-4. - DOI - PMC - PubMed

Publication types

MeSH terms