

Image-based biophysical modeling predicts cortical potentials evoked with subthalamic deep brain stimulation
- PMID: 33757931
- PMCID: PMC8164987
- DOI: 10.1016/j.brs.2021.03.009
Image-based biophysical modeling predicts cortical potentials evoked with subthalamic deep brain stimulation
Abstract
Background: Subthalamic deep brain stimulation (DBS) is an effective surgical treatment for Parkinson's disease and continues to advance technologically with an enormous parameter space. As such, in-silico DBS modeling systems have become common tools for research and development, but their underlying methods have yet to be standardized and validated.
Objective: Evaluate the accuracy of patient-specific estimates of neural pathway activations in the subthalamic region against intracranial, cortical evoked potential (EP) recordings.
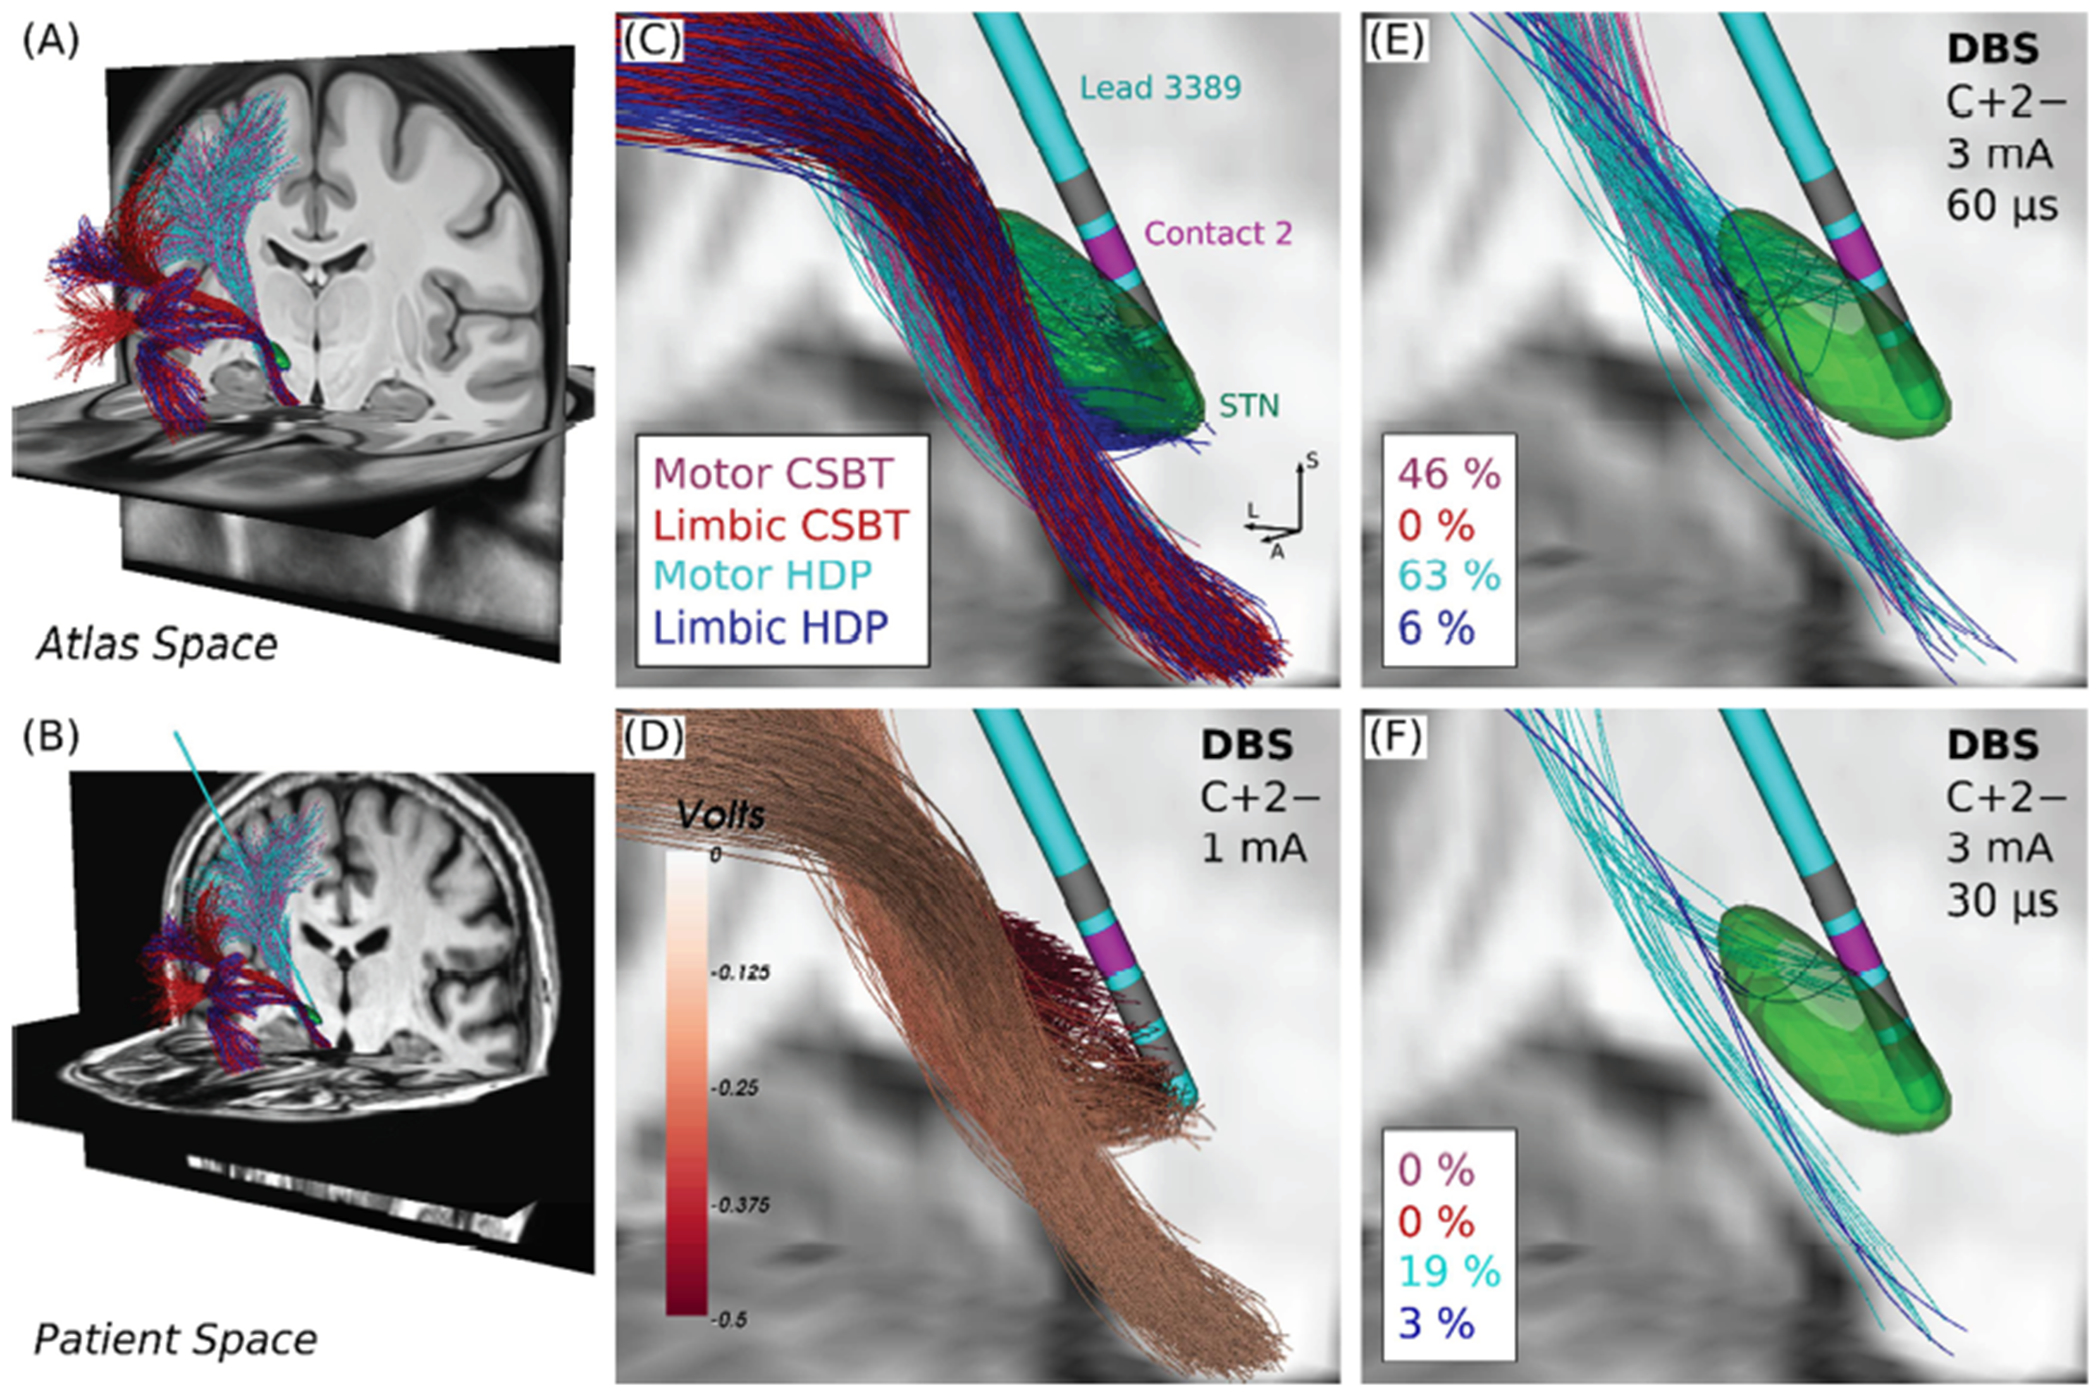
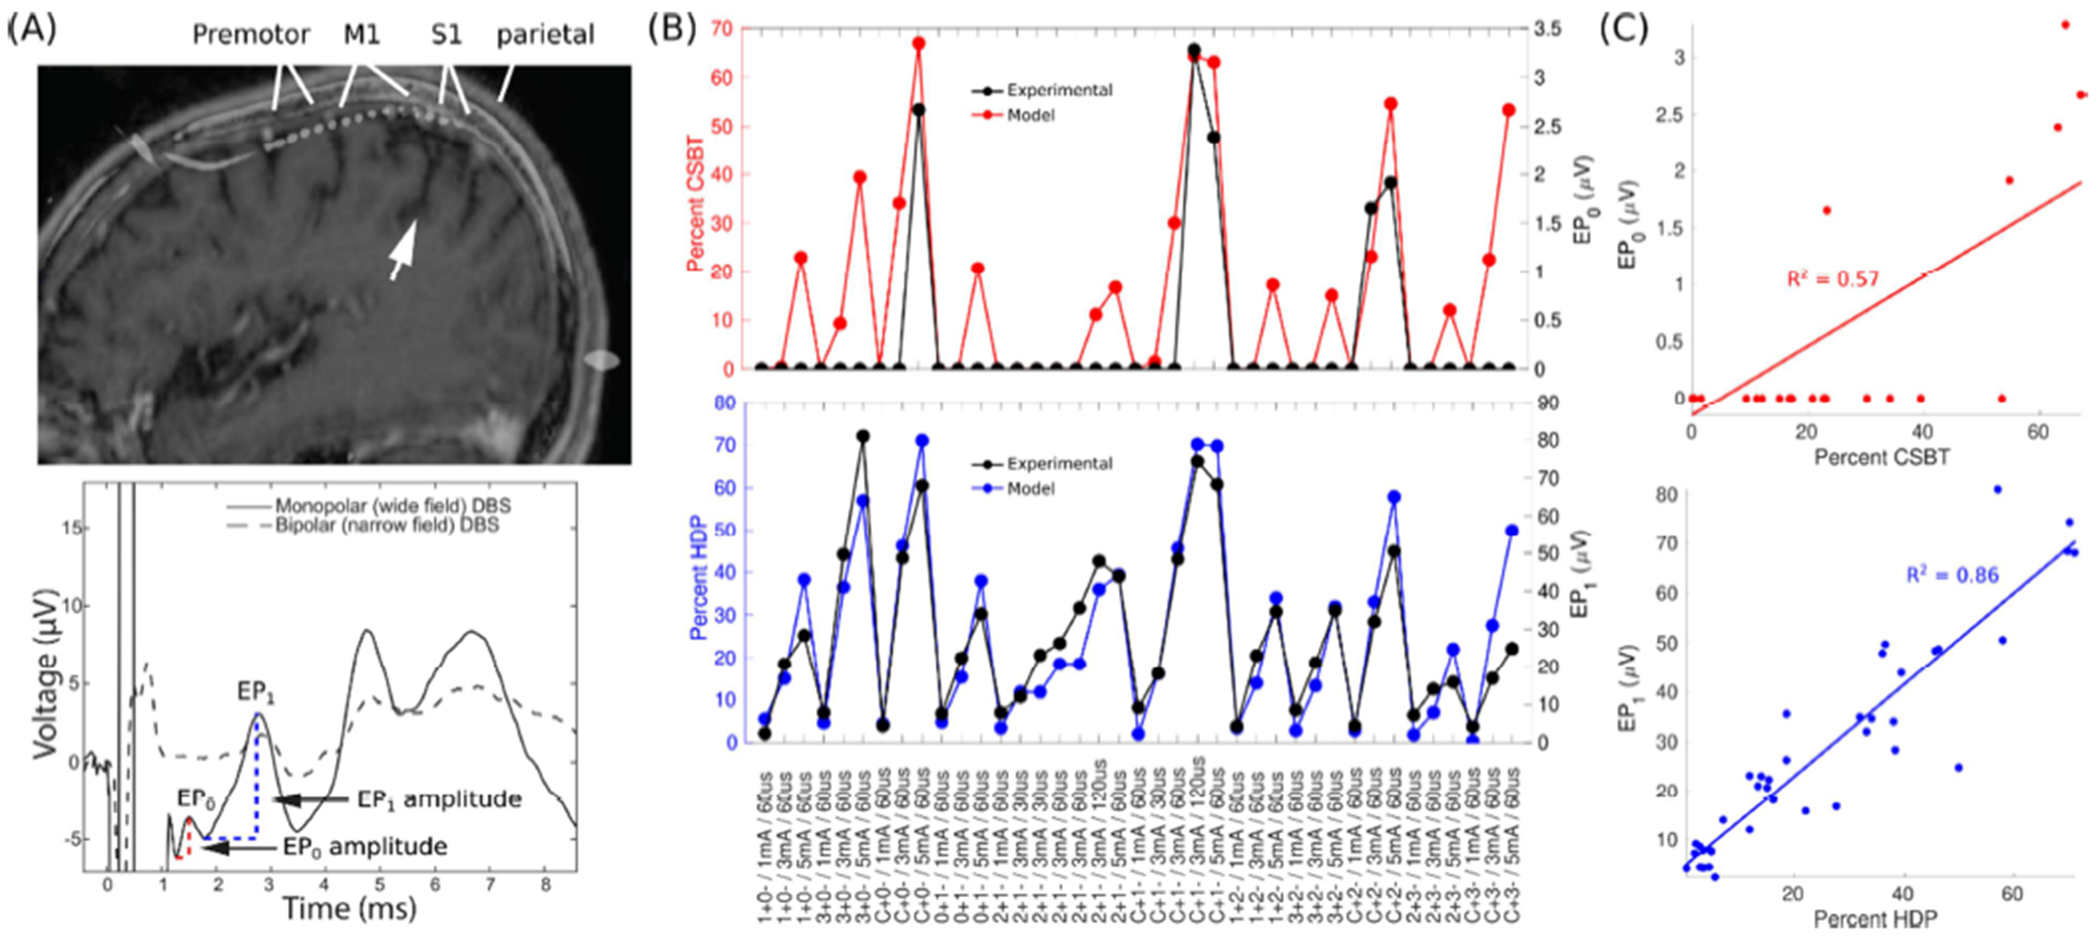
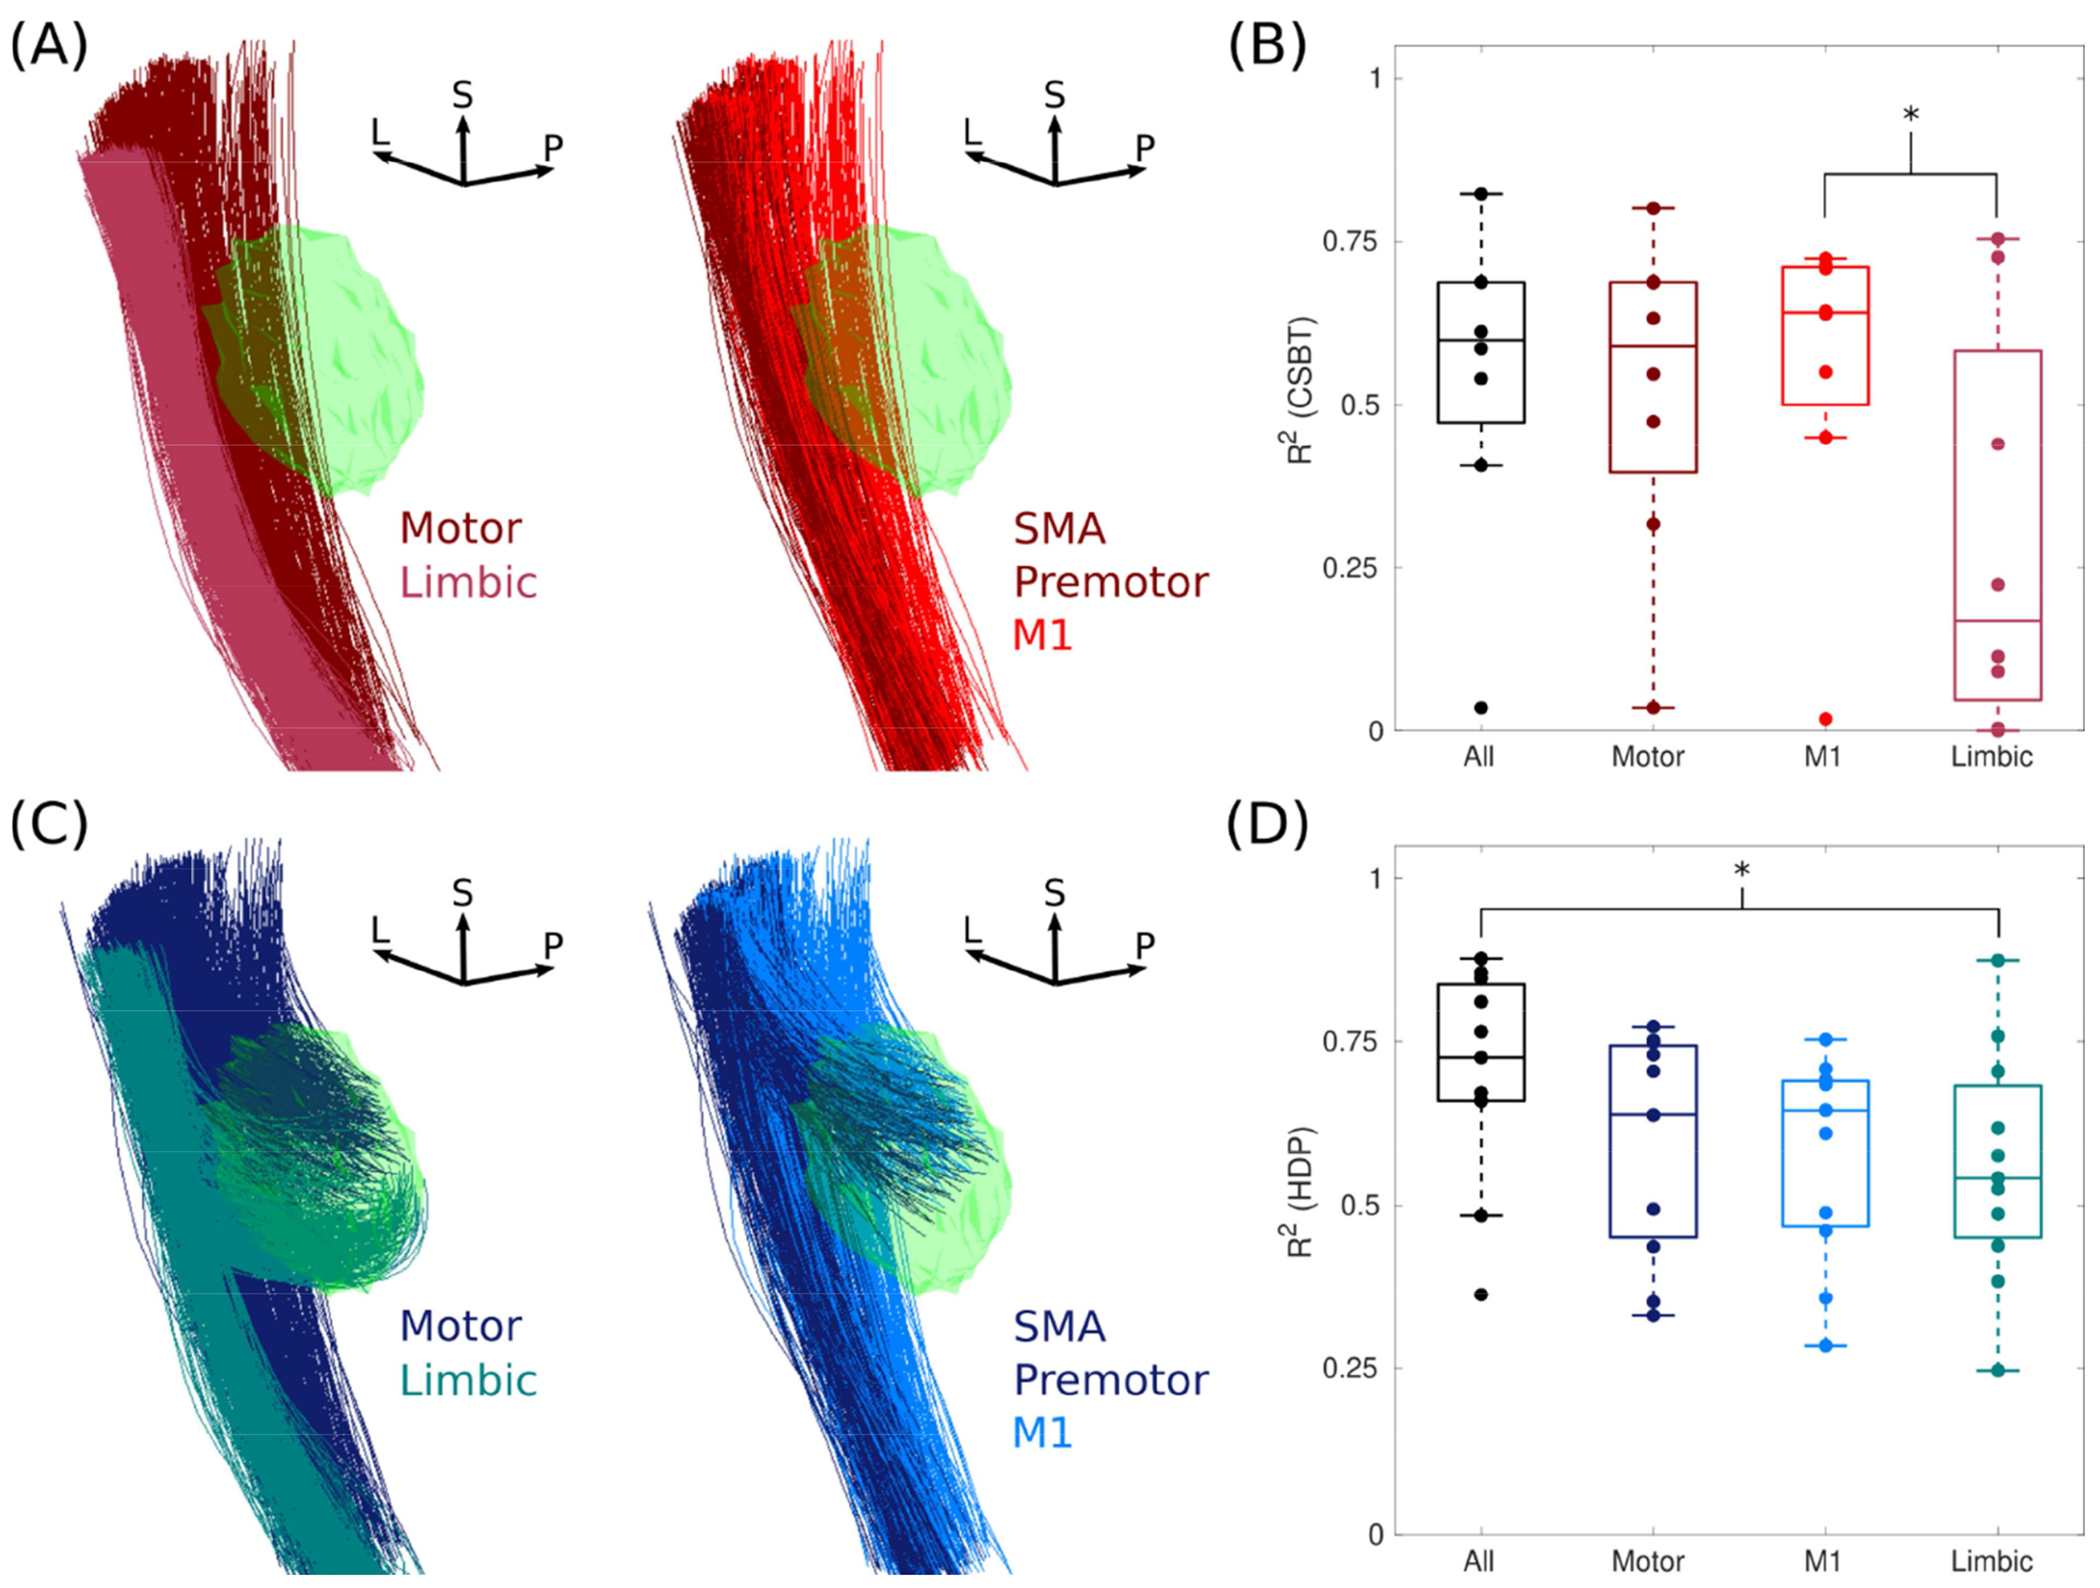
Methods: Pathway activations were modeled in eleven patients using the latest advances in connectomic modeling of subthalamic DBS, focusing on the hyperdirect pathway (HDP) and corticospinal/bulbar tract (CSBT) for their relevance in human research studies. Correlations between pathway activations and respective EP amplitudes were quantified.
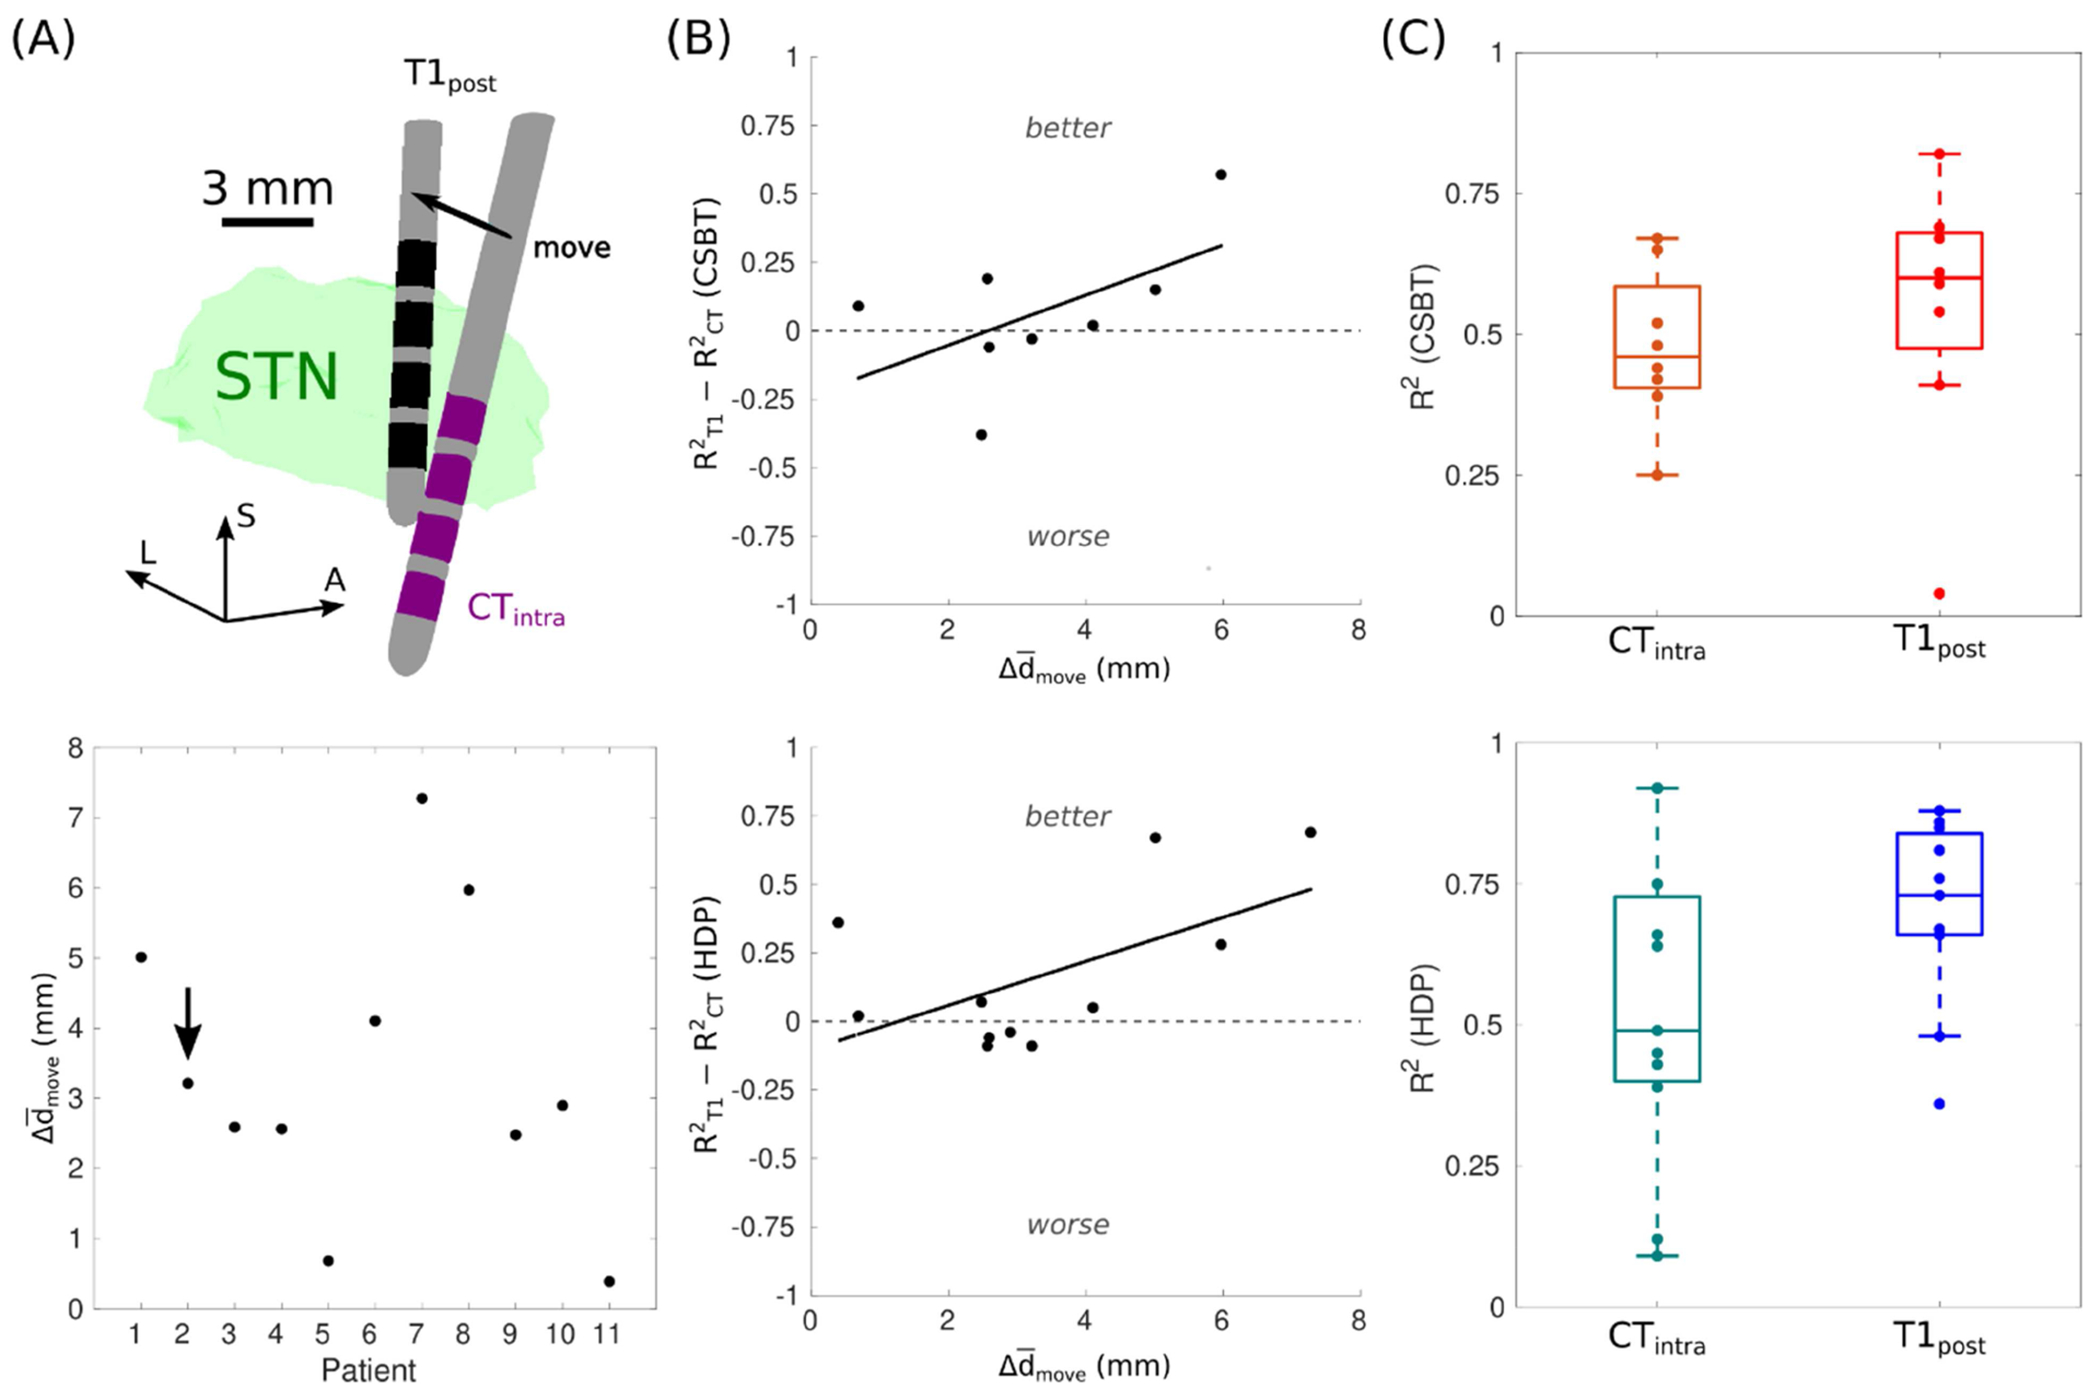
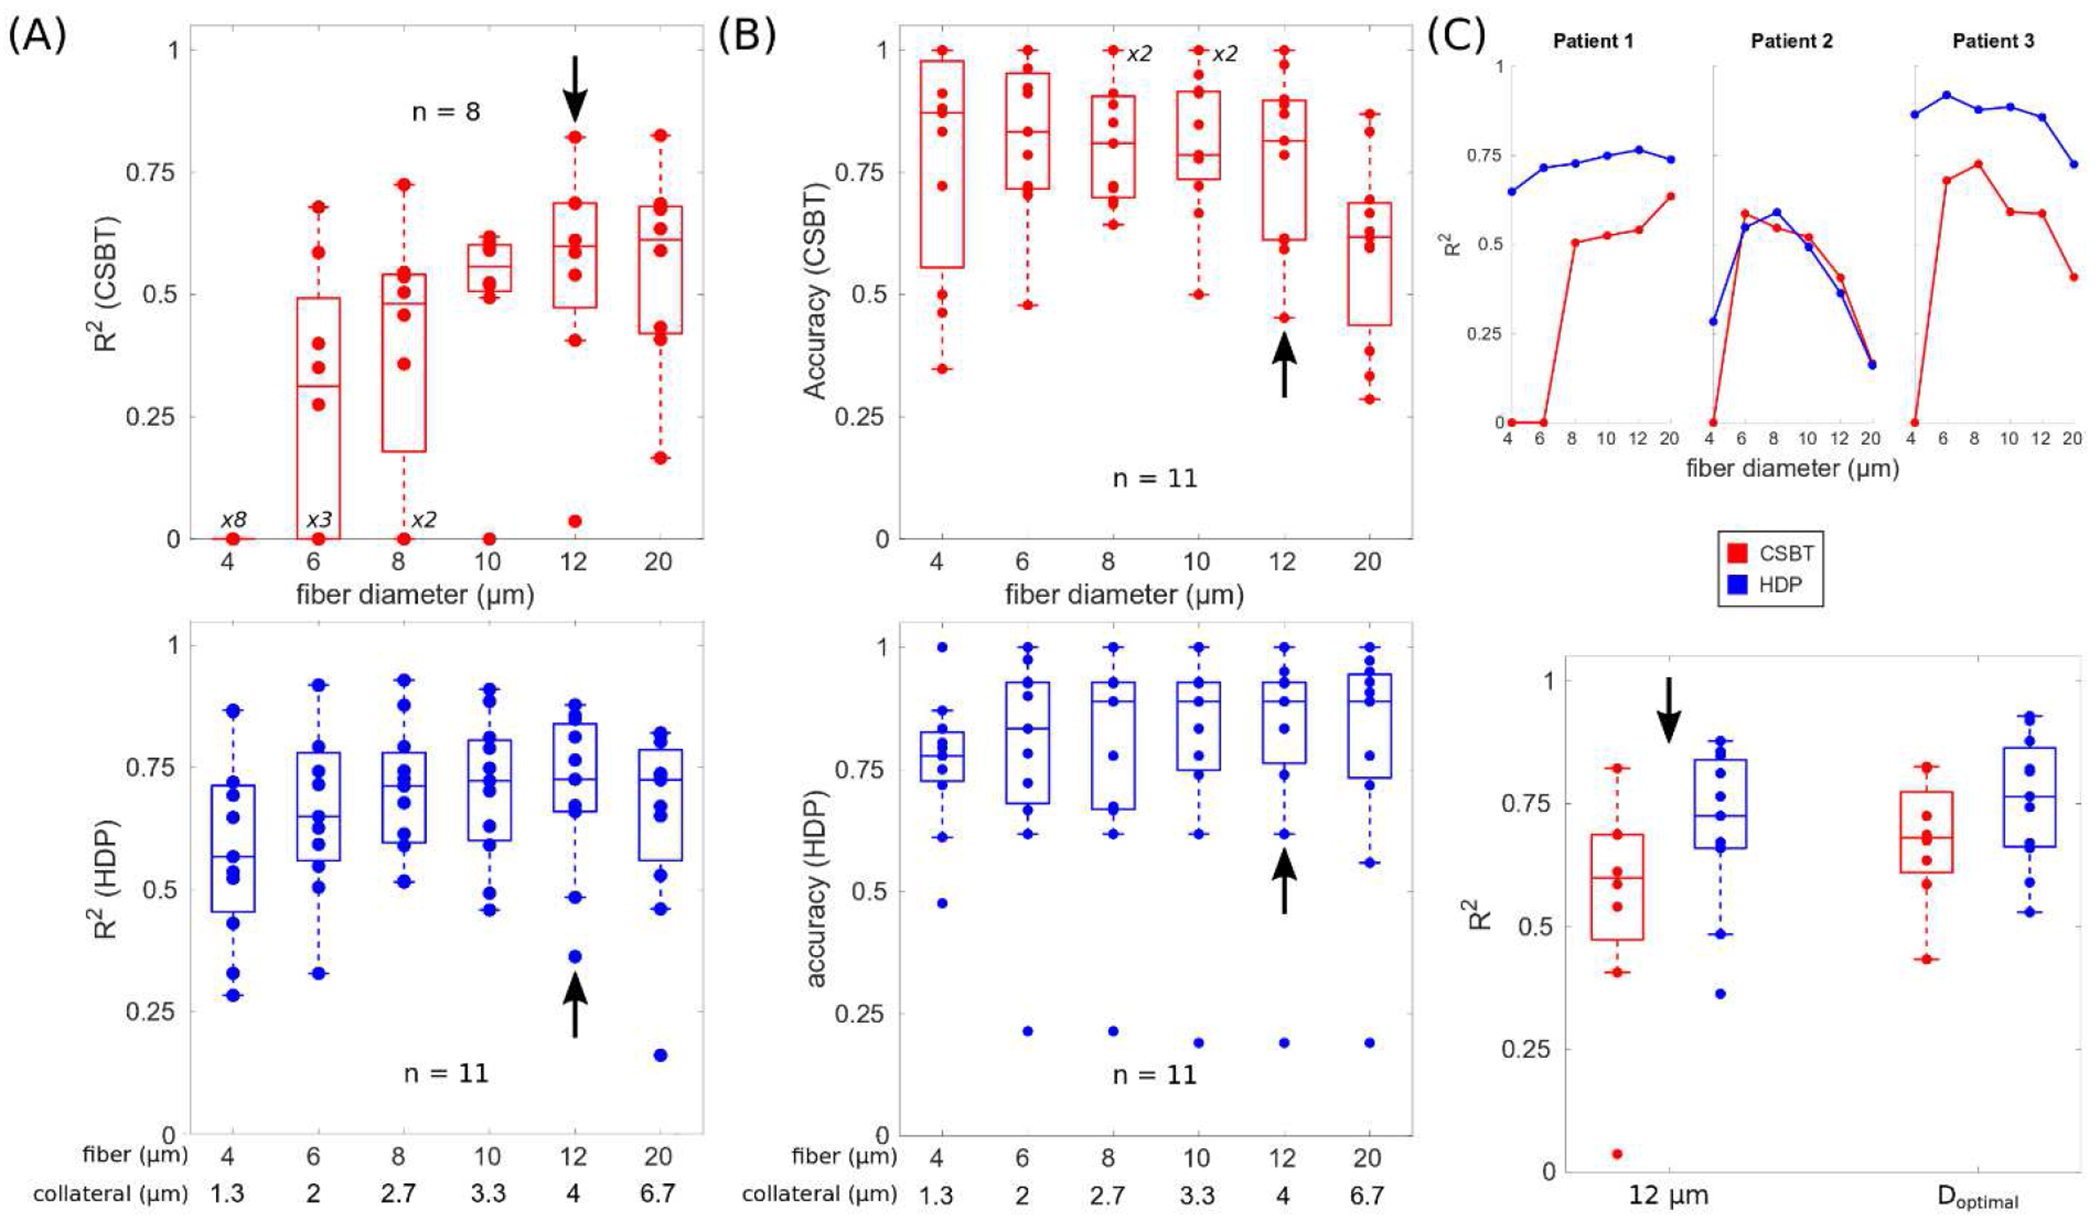
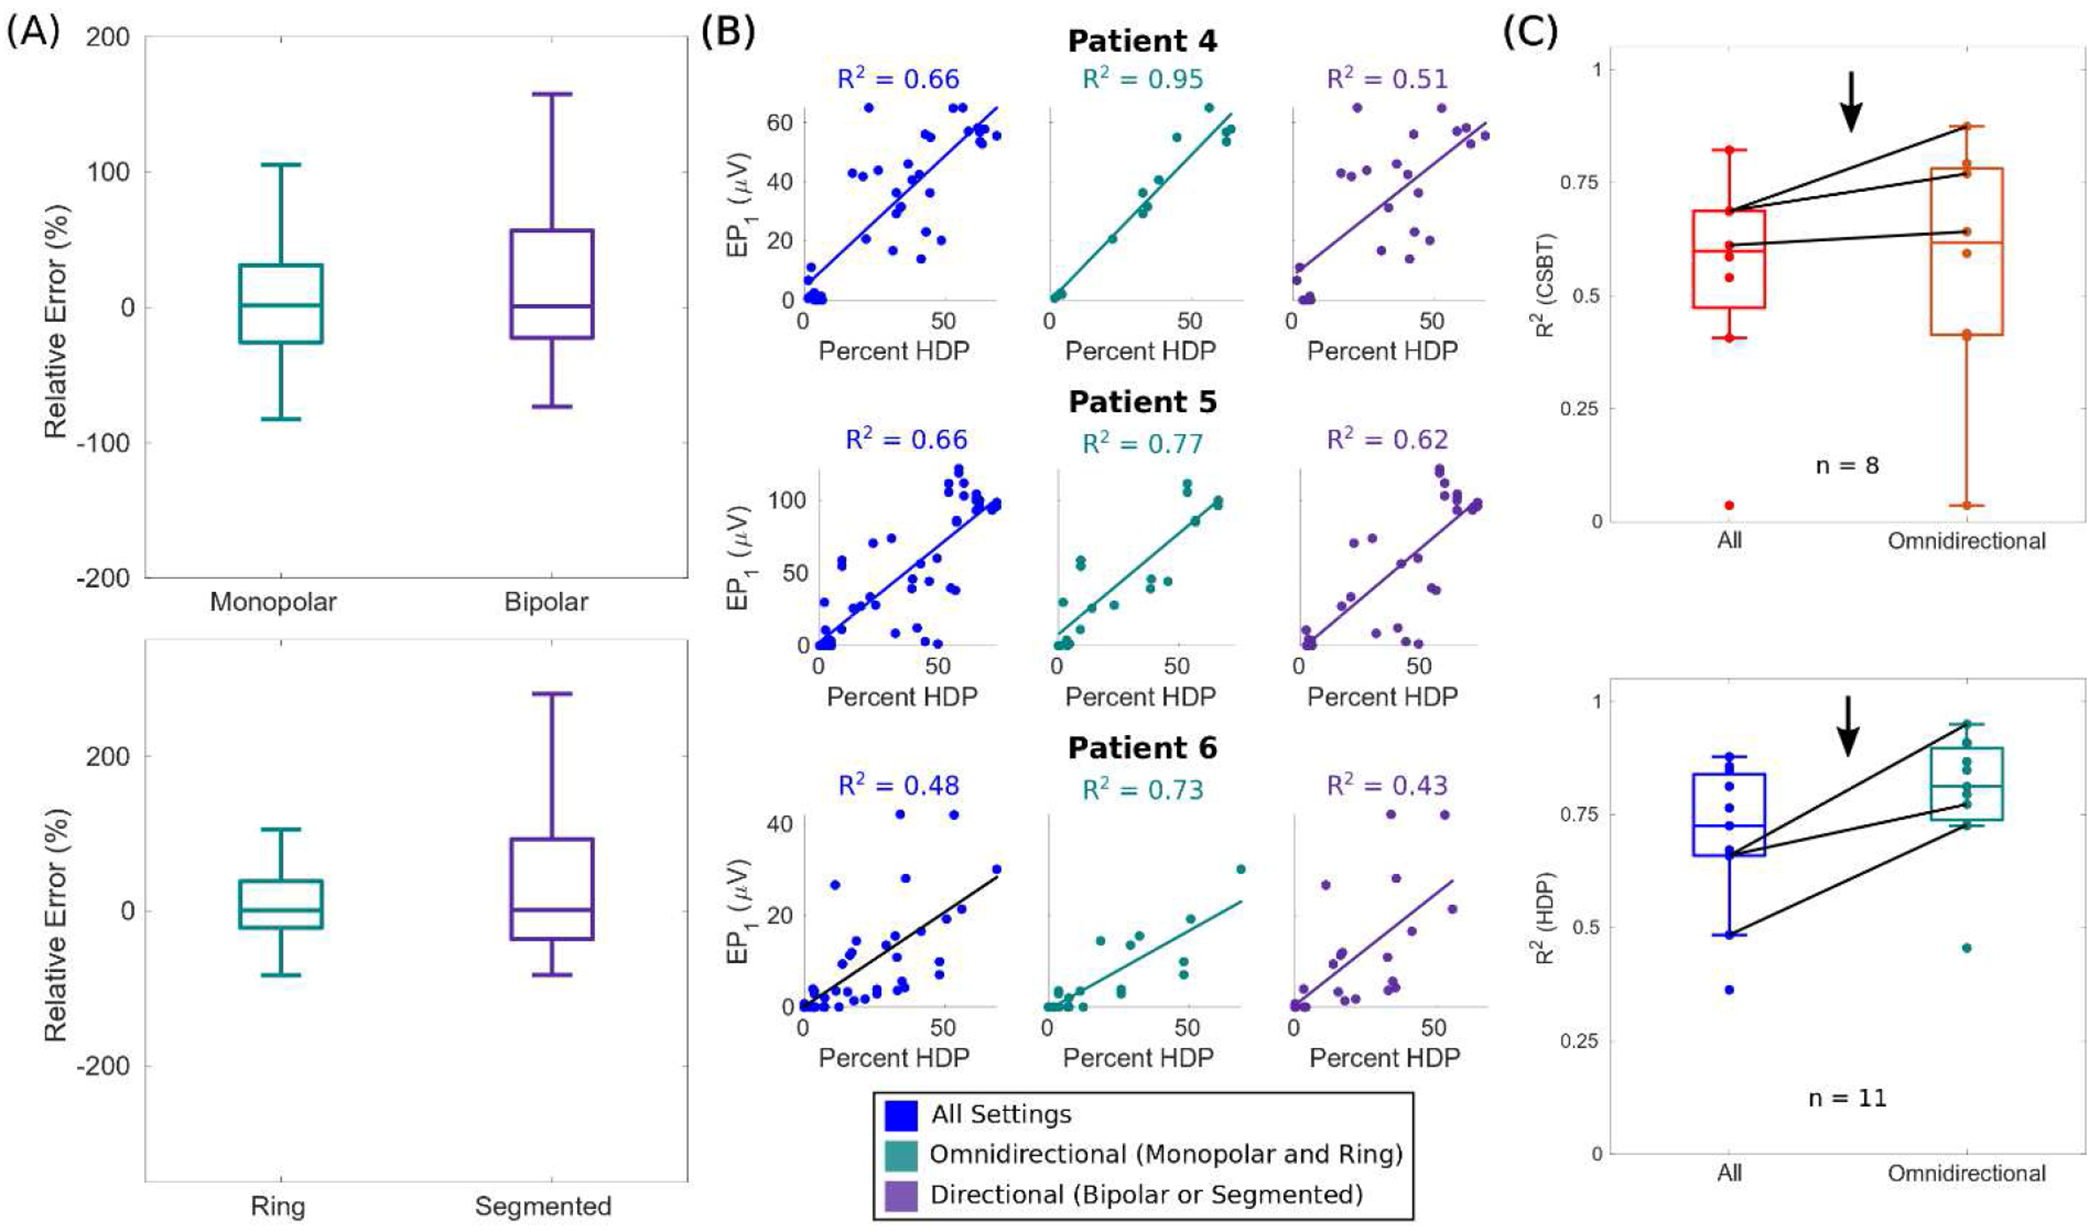
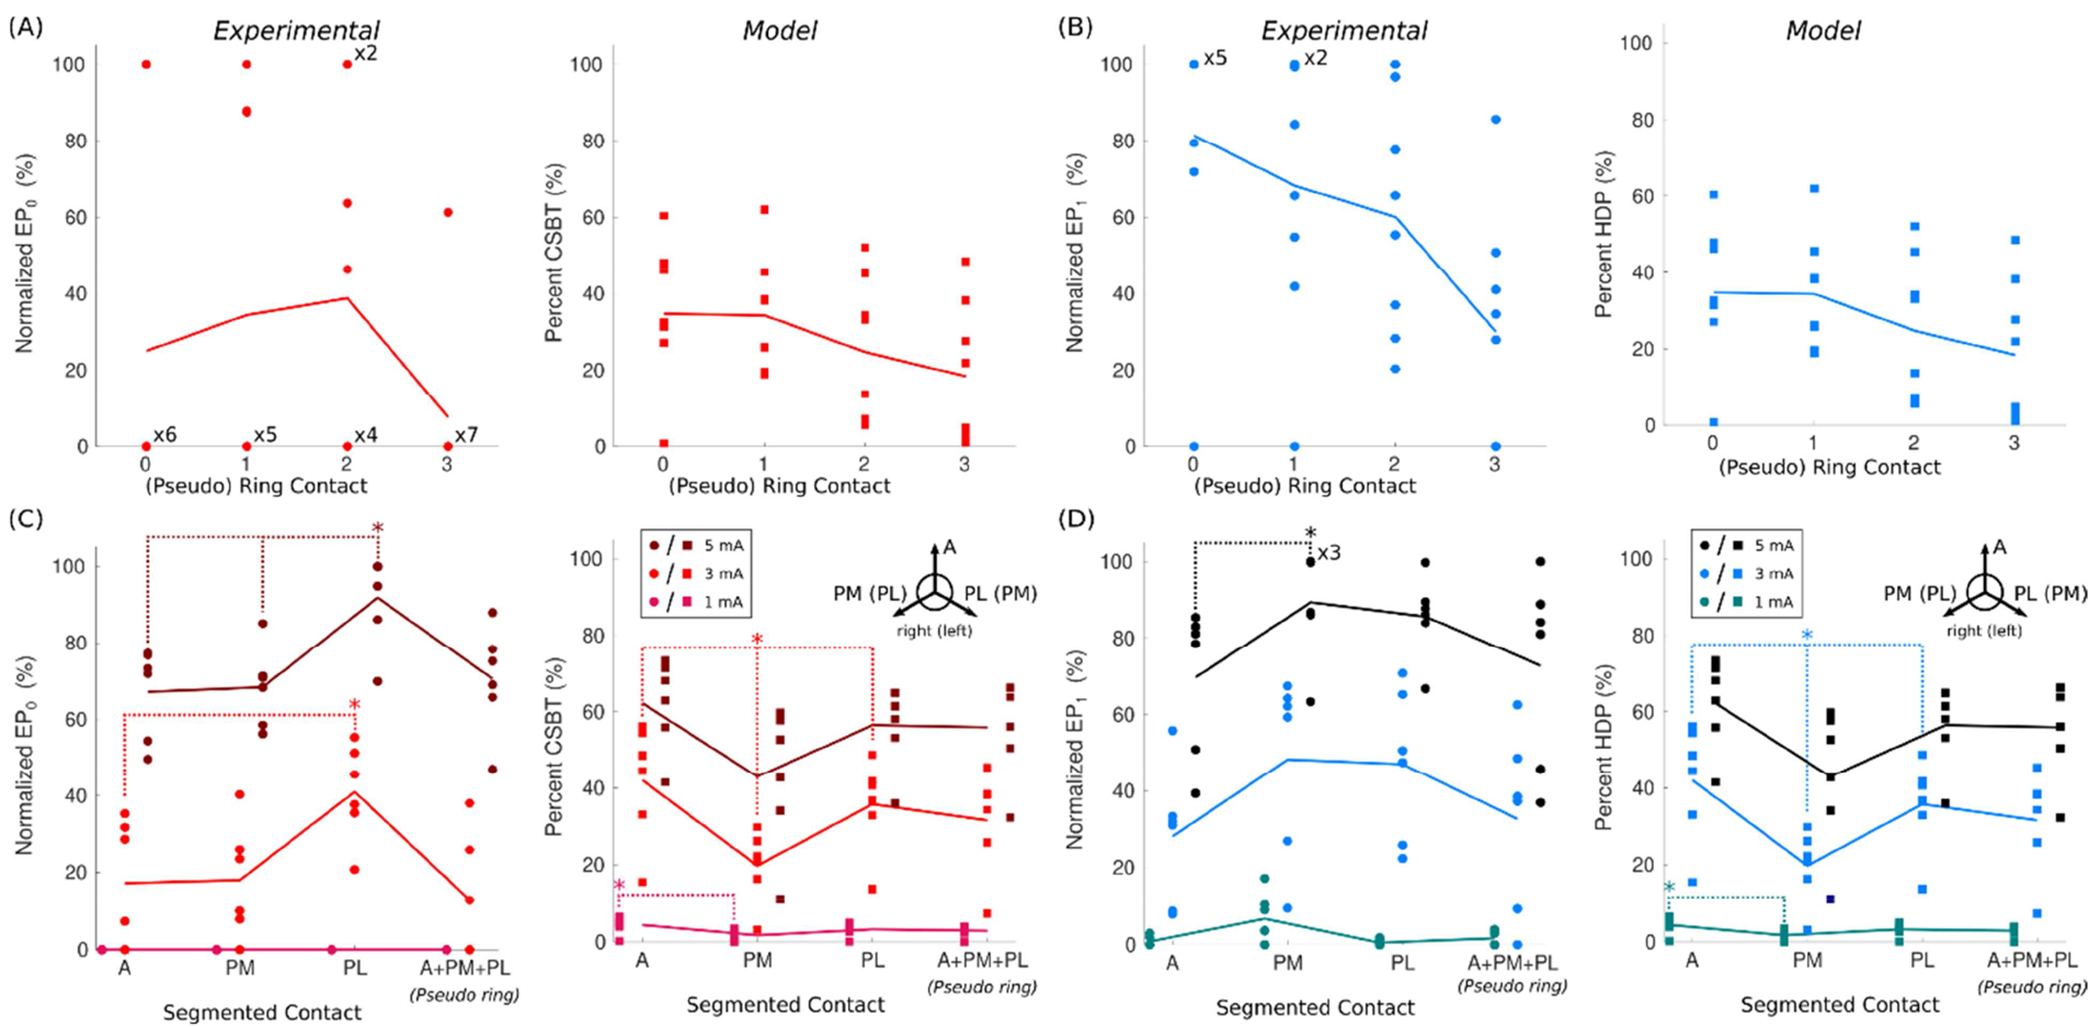
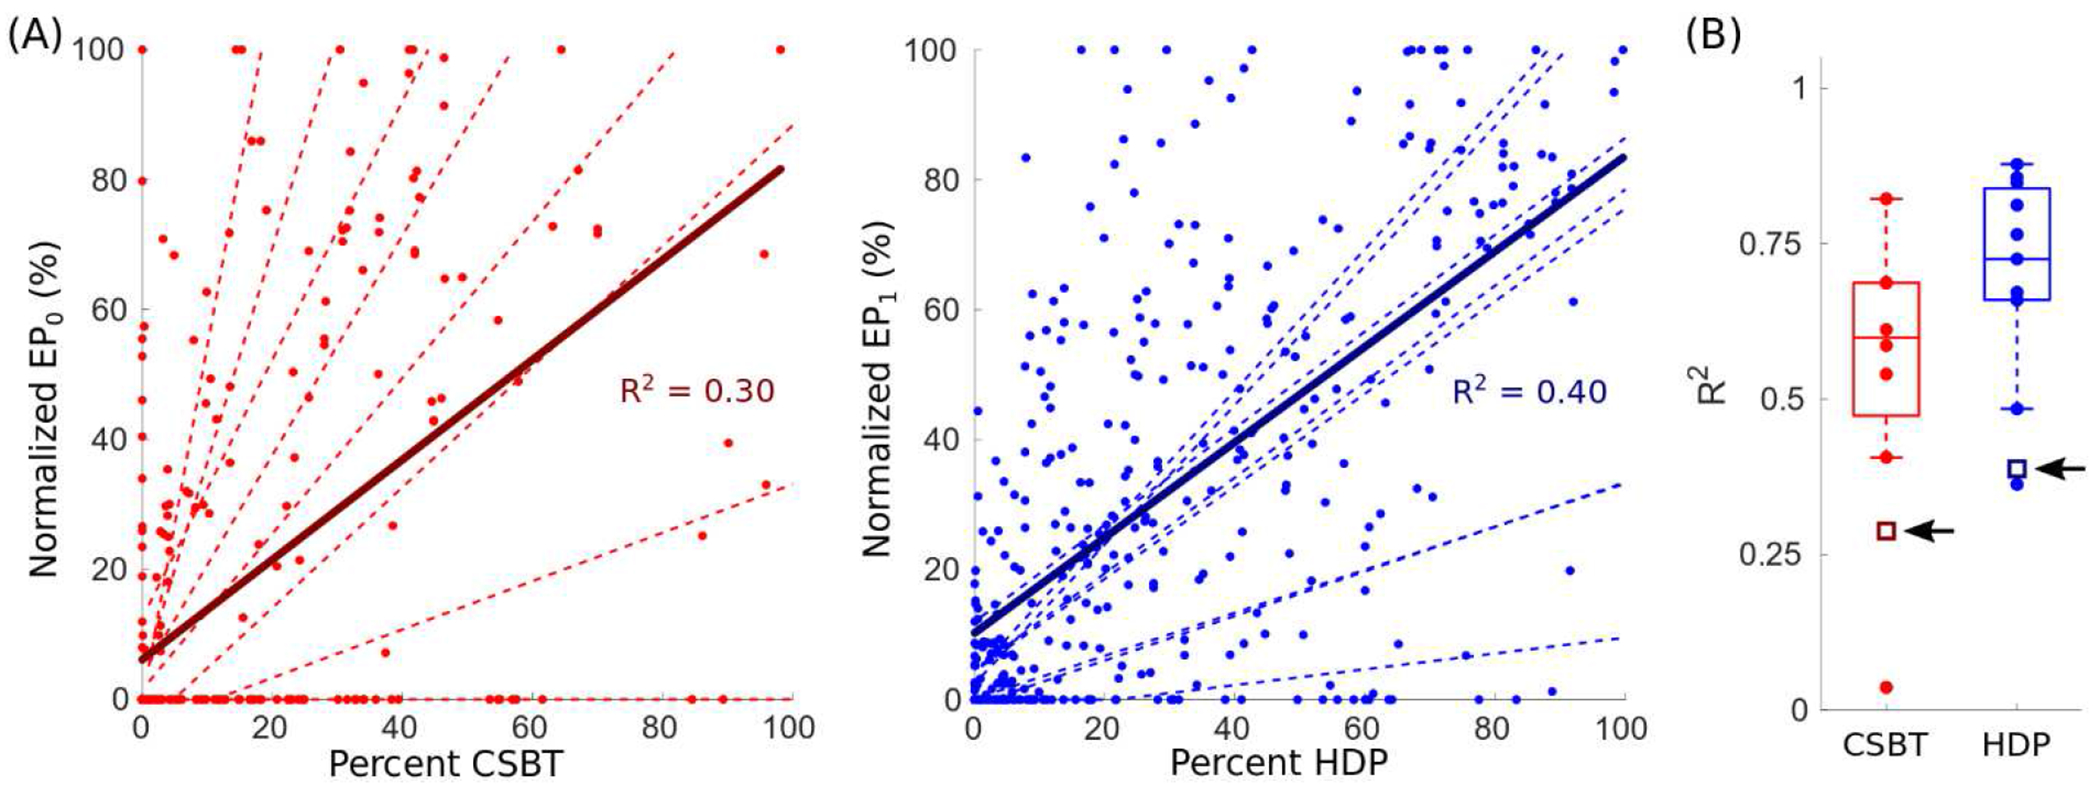
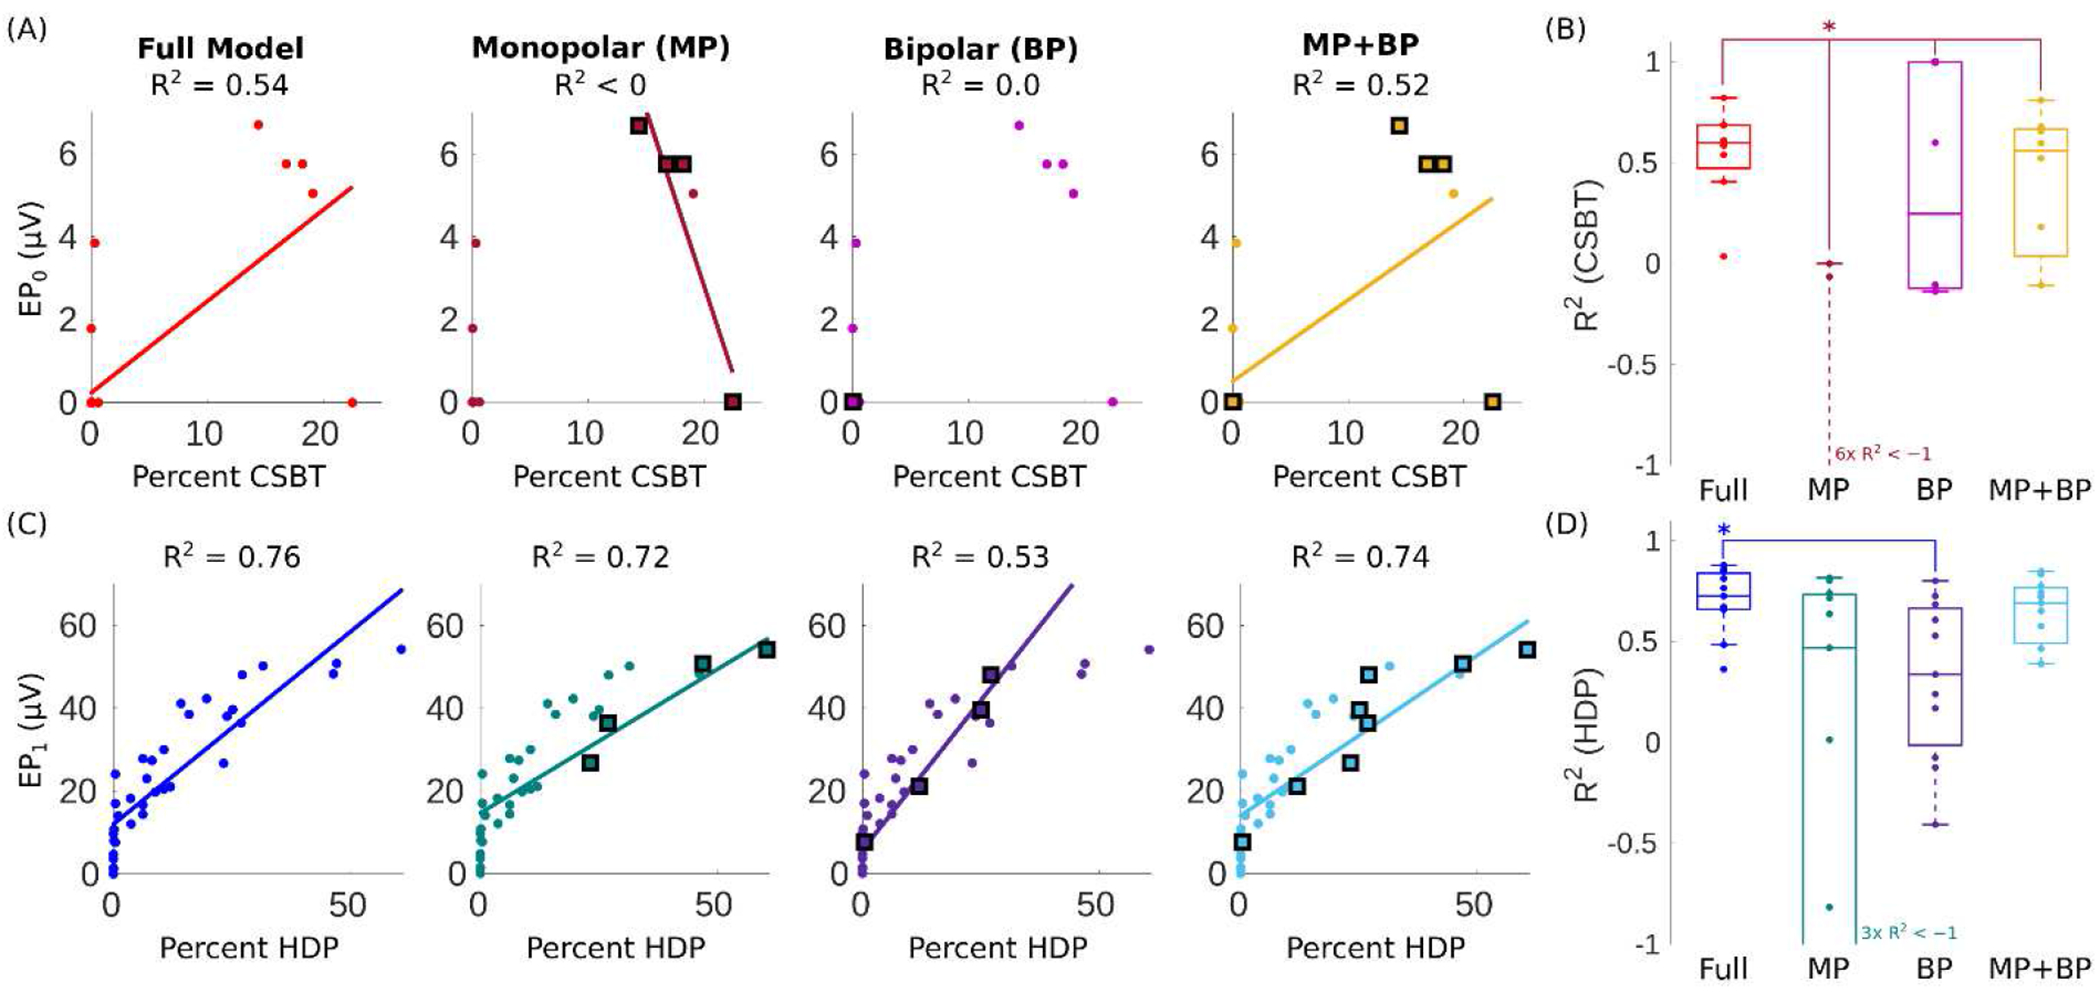
Results: Good model performance required accurate lead localization and image fusions, as well as appropriate selection of fiber diameter in the biophysical model. While optimal model parameters varied across patients, good performance could be achieved using a global set of parameters that explained 60% and 73% of electrophysiologic activations of CSBT and HDP, respectively. Moreover, restricted models fit to only EP amplitudes of eight standard (monopolar and bipolar) electrode configurations were able to extrapolate variation in EP amplitudes across other directional electrode configurations and stimulation parameters, with no significant reduction in model performance across the cohort.
Conclusions: Our findings demonstrate that connectomic models of DBS with sufficient anatomical and electrical details can predict recruitment dynamics of white matter. These results will help to define connectomic modeling standards for preoperative surgical targeting and postoperative patient programming applications.
Keywords: Biophysical modeling; Deep brain stimulation; Electrocorticography; Evoked potentials; Parkinson’s disease; Subthalamic nucleus.
Copyright © 2021 The Authors. Published by Elsevier Inc. All rights reserved.
Conflict of interest statement
Declaration of competing interest Bryan Howell is a paid consultant for Abbott Laboratories. Robert E. Gross is a paid consultant for Medtronic, PLC and Abbot Laboratories. Philip A: Starr has research supported by Medtronic, PLC and Boston Scientific, Co. Jon T. Willie is a paid consultant for Medtronic, PLC and Neuropace, Inc. Cameron C. McIntyre is a paid consultant for Boston Scientific, Co., receives royalties from Hologram Consultants, Neuros Medical, and Qr8 Health, and is a shareholder in the following companies: Hologram Consultants, Surgical Information Sciences, CereGate, Autonomic Technologies, Cardionomic, Enspire DBS. All other authors have no competing interests.
Figures
Similar articles
-
Evolving characterization of the human hyperdirect pathway.Brain Struct Funct. 2023 Mar;228(2):353-365. doi: 10.1007/s00429-023-02610-5. Epub 2023 Jan 28. Brain Struct Funct. 2023. PMID: 36708394 Free PMC article. Review.
-
Cortical Potentials Evoked by Subthalamic Stimulation Demonstrate a Short Latency Hyperdirect Pathway in Humans.J Neurosci. 2018 Oct 24;38(43):9129-9141. doi: 10.1523/JNEUROSCI.1327-18.2018. Epub 2018 Sep 10. J Neurosci. 2018. PMID: 30201770 Free PMC article.
-
Subthalamic deep brain stimulation of an anatomically detailed model of the human hyperdirect pathway.J Neurophysiol. 2022 May 1;127(5):1209-1220. doi: 10.1152/jn.00004.2022. Epub 2022 Mar 23. J Neurophysiol. 2022. PMID: 35320026 Free PMC article.
-
Neural pathway activation in the subthalamic region depends on stimulation polarity.Brain Commun. 2025 Jan 21;7(1):fcaf006. doi: 10.1093/braincomms/fcaf006. eCollection 2025. Brain Commun. 2025. PMID: 39980742 Free PMC article.
-
Electrophysiological characterization of the hyperdirect pathway and its functional relevance for subthalamic deep brain stimulation.Exp Neurol. 2022 Jun;352:114031. doi: 10.1016/j.expneurol.2022.114031. Epub 2022 Mar 2. Exp Neurol. 2022. PMID: 35247373 Review.
Cited by
-
Comparison of Anatomical Pathway Models with Tractography Estimates of the Pallidothalamic, Cerebellothalamic, and Corticospinal Tracts.Brain Connect. 2023 May;13(4):237-246. doi: 10.1089/brain.2022.0068. Epub 2023 Mar 24. Brain Connect. 2023. PMID: 36772800 Free PMC article.
-
Optimal deep brain stimulation sites and networks for cervical vs. generalized dystonia.Proc Natl Acad Sci U S A. 2022 Apr 5;119(14):e2114985119. doi: 10.1073/pnas.2114985119. Epub 2022 Mar 31. Proc Natl Acad Sci U S A. 2022. PMID: 35357970 Free PMC article.
-
Evolving characterization of the human hyperdirect pathway.Brain Struct Funct. 2023 Mar;228(2):353-365. doi: 10.1007/s00429-023-02610-5. Epub 2023 Jan 28. Brain Struct Funct. 2023. PMID: 36708394 Free PMC article. Review.
-
Comparison of structural connectomes for modeling deep brain stimulation pathway activation.Neuroimage. 2025 May 15;312:121211. doi: 10.1016/j.neuroimage.2025.121211. Epub 2025 Apr 11. Neuroimage. 2025. PMID: 40222498 Free PMC article.
-
Evaluation of DBS computational modeling methodologies using in-vivo electrophysiology in Parkinson's disease.medRxiv [Preprint]. 2025 May 6:2025.05.05.25326314. doi: 10.1101/2025.05.05.25326314. medRxiv. 2025. PMID: 40385436 Free PMC article. Preprint.
References
-
- Ramirez-Zamora A, Giordano J, Gunduz A, Alcantara J, Cagle JN, Cernera S, et al. Proceedings of the Seventh Annual Deep Brain Stimulation Think Tank: Advances in Neurophysiology, Adaptive DBS, Virtual Reality, Neuroethics and Technology. Frontiers in Human Neuroscience 2020;14:54. 10.3389/fnhum.2020.00054. - DOI - PMC - PubMed
-
- Bina RW, Langevin J-P. Developing New Indications: Strategies and Hurdles to Discovery. In: Pouratian N, Sheth SA, editors. Stereotactic and Functional Neurosurgery: Principles and Applications, Cham: Springer International Publishing; 2020, p. 501–9. 10.1007/978-3-030-34906-6_35. - DOI
Publication types
MeSH terms
Grants and funding
LinkOut - more resources
Full Text Sources
Other Literature Sources
Medical
Research Materials
