

Interpregnancy intervals and child development at age 5: a population data linkage study
- PMID: 33757954
- PMCID: PMC7993213
- DOI: 10.1136/bmjopen-2020-045319
Interpregnancy intervals and child development at age 5: a population data linkage study
Abstract
Objective: To investigate the associations between interpregnancy intervals (IPIs) and developmental vulnerability in children's first year of full-time school (age 5).
Design: Retrospective cohort study using logistic regression. ORs were estimated for associations with IPIs with adjustment for child, parent and community sociodemographic variables.
Setting: Western Australia (WA), 2002-2015.
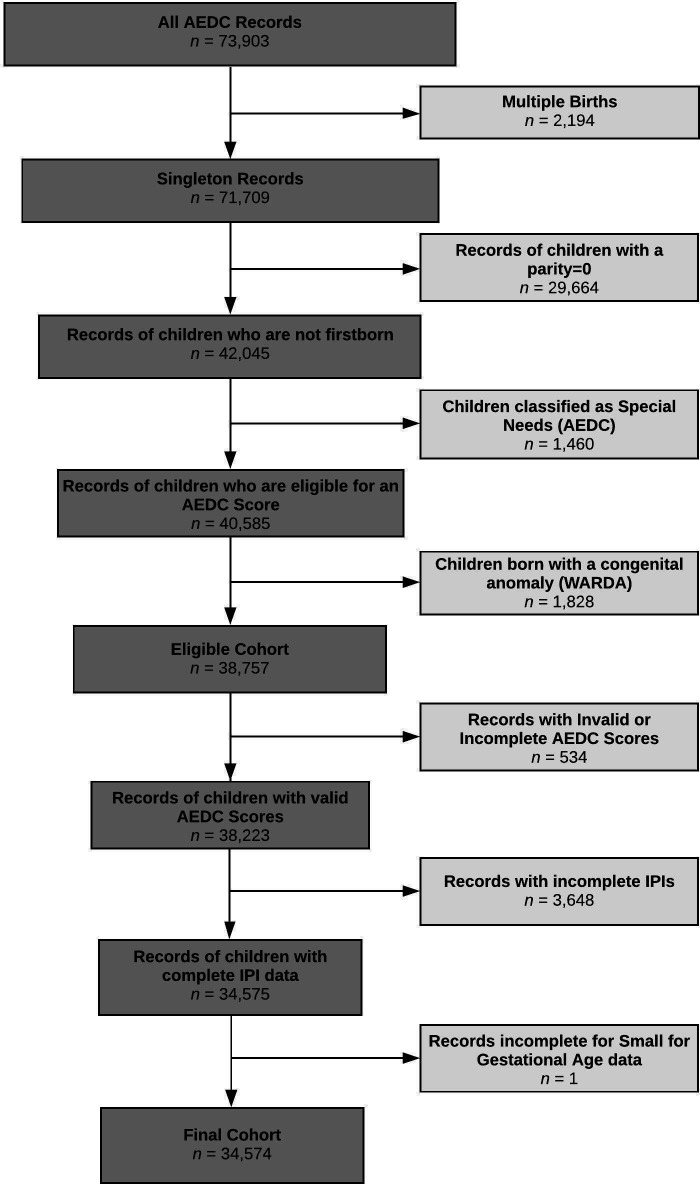
Participants: 34 574 WA born singletons with a 2009, 2012 or 2015 Australian Early Development Census (AEDC) record.
Main outcome measure: The AEDC measures child development across five domains; Physical Health and Wellbeing, Social Competence, Emotional Maturity, Language and Cognitive Skills (school-based) and Communication Skills and General Knowledge. Children with scores <10th percentile were classified as developmentally vulnerable on, one or more domains (DV1), or two or more domains (DV2).
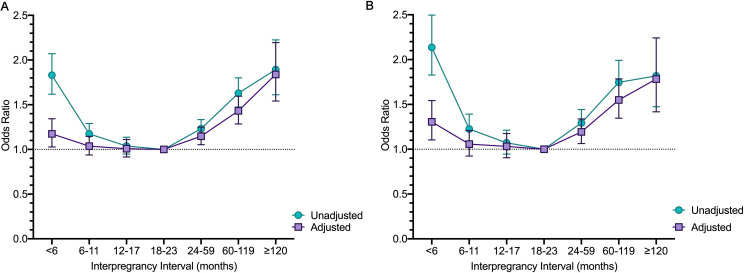
Results: 22.8% and 11.5% of children were classified as DV1 and DV2, respectively. In the adjusted models (relative to the reference category, IPIs of 18-23 months), IPIs of <6 months were associated with an increased risk of children being classified as DV1 (adjusted OR (aOR) 1.17, 95% CI 1.08 to 1.34), DV2 (aOR 1.31, 95% CI 1.10 to 1.54) and an increased risk of developmental vulnerability for the domains of Physical Health and Wellbeing (aOR 1.25, 95% CI 1.06 to 1.48) and Emotional Maturity (aOR 1.36, 95% CI 1.12 to 1.66). All IPIs longer than the reference category were associated with and increased risk of children being classified as DV1 and DV2 (aOR >1.15). IPIs of 60-119 months and ≥120 months, were associated with an increased risk of developmental vulnerability on each of the five AEDC domains, with greater odds for each domain for the longer IPI category.
Conclusions: IPIs showed independent J-shaped relationships with developmental vulnerability, with short (<6 months) and longer (≥24 months) associated with increased risks of developmental vulnerability.
Keywords: community child health; epidemiology; public health.
© Author(s) (or their employer(s)) 2021. Re-use permitted under CC BY-NC. No commercial re-use. See rights and permissions. Published by BMJ.
Conflict of interest statement
Competing interests: None declared.
Figures
Similar articles
-
Is early childhood development impeded by the birth timing of the younger sibling?PLoS One. 2022 May 10;17(5):e0268325. doi: 10.1371/journal.pone.0268325. eCollection 2022. PLoS One. 2022. PMID: 35536788 Free PMC article.
-
Associations between biological and sociodemographic risks for developmental vulnerability in twins at age 5: a population data linkage study in Western Australia.BMJ Open. 2020 Oct 16;10(10):e038846. doi: 10.1136/bmjopen-2020-038846. BMJ Open. 2020. PMID: 33067288 Free PMC article.
-
Associations between clusters of early life risk factors and developmental vulnerability at age 5: a retrospective cohort study using population-wide linkage of administrative data in Tasmania, Australia.BMJ Open. 2020 Apr 20;10(4):e033795. doi: 10.1136/bmjopen-2019-033795. BMJ Open. 2020. PMID: 32312726 Free PMC article.
-
Influence of preterm birth on the association between gestational diabetes mellitus and childhood developmental vulnerability: a causal mediation analysis.World J Pediatr. 2024 Jan;20(1):54-63. doi: 10.1007/s12519-023-00741-7. Epub 2023 Jul 31. World J Pediatr. 2024. PMID: 37523007 Free PMC article.
-
The effects of pre-eclampsia on social and emotional developmental vulnerability in children at age five in Western Australia: A population data linkage study.J Affect Disord. 2024 May 1;352:349-356. doi: 10.1016/j.jad.2024.02.042. Epub 2024 Feb 13. J Affect Disord. 2024. PMID: 38360367
Cited by
-
Perinatal and early life risk factors of adverse early childhood developmental outcomes: Protocol for systematic review using socioecological model.PLoS One. 2024 Oct 17;19(10):e0311500. doi: 10.1371/journal.pone.0311500. eCollection 2024. PLoS One. 2024. PMID: 39418240 Free PMC article.
-
Short birth interval prevalence, determinants and effects on maternal and child health outcomes in Asia-Pacific region: a systematic review and meta-analysis protocol.BMJ Open. 2023 Dec 28;13(12):e076908. doi: 10.1136/bmjopen-2023-076908. BMJ Open. 2023. PMID: 38154890 Free PMC article.
-
Thirty years of declining stunting in Tanzania: Trends and ongoing challenges.PLoS One. 2025 Jul 29;20(7):e0327779. doi: 10.1371/journal.pone.0327779. eCollection 2025. PLoS One. 2025. PMID: 40729352 Free PMC article.
-
The effects of birth spacing on early childhood development in high-income nations: A systematic review.Front Pediatr. 2022 Nov 25;10:851700. doi: 10.3389/fped.2022.851700. eCollection 2022. Front Pediatr. 2022. PMID: 36507145 Free PMC article. Review.
-
Gestational age and child development at school entry.Sci Rep. 2021 Jul 15;11(1):14522. doi: 10.1038/s41598-021-93701-y. Sci Rep. 2021. PMID: 34267259 Free PMC article.
References
Publication types
MeSH terms
LinkOut - more resources
Full Text Sources
Other Literature Sources
Medical