. 2021 Aug;11(8):2072-2093.
doi: 10.1158/2159-8290.CD-20-1453. Epub 2021 Mar 23.

Obesity-Dependent Adipokine Chemerin Suppresses Fatty Acid Oxidation to Confer Ferroptosis Resistance

Affiliations

Obesity-Dependent Adipokine Chemerin Suppresses Fatty Acid Oxidation to Confer Ferroptosis Resistance

Sze Kiat Tan et al. Cancer Discov. 2021 Aug.

Abstract

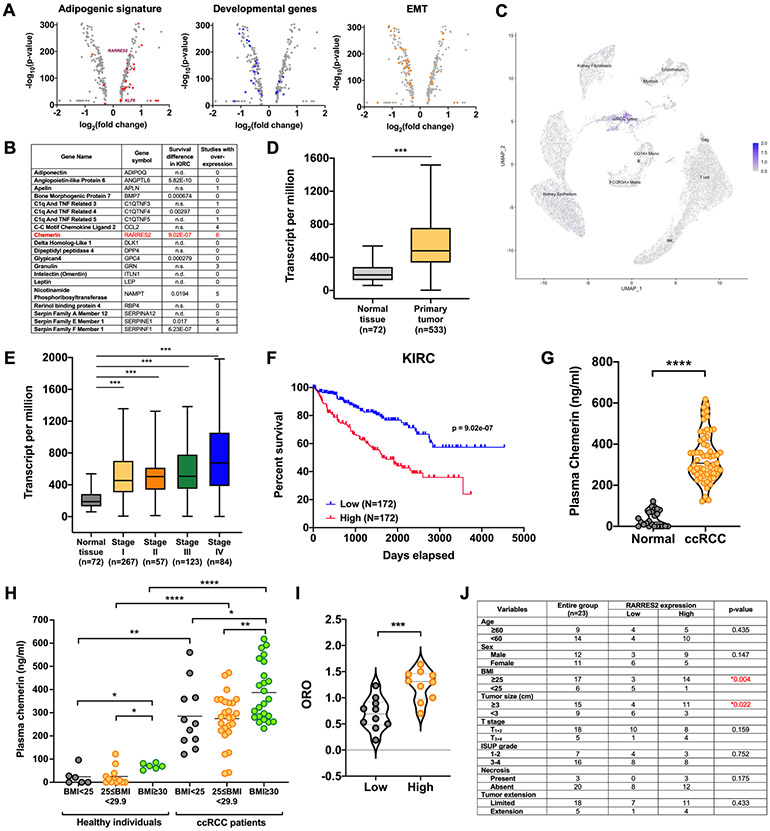
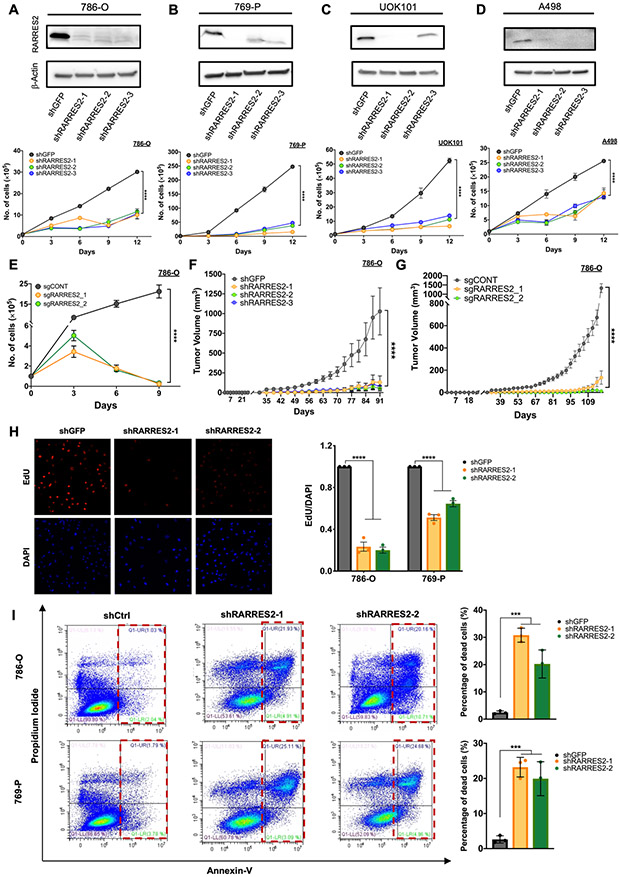
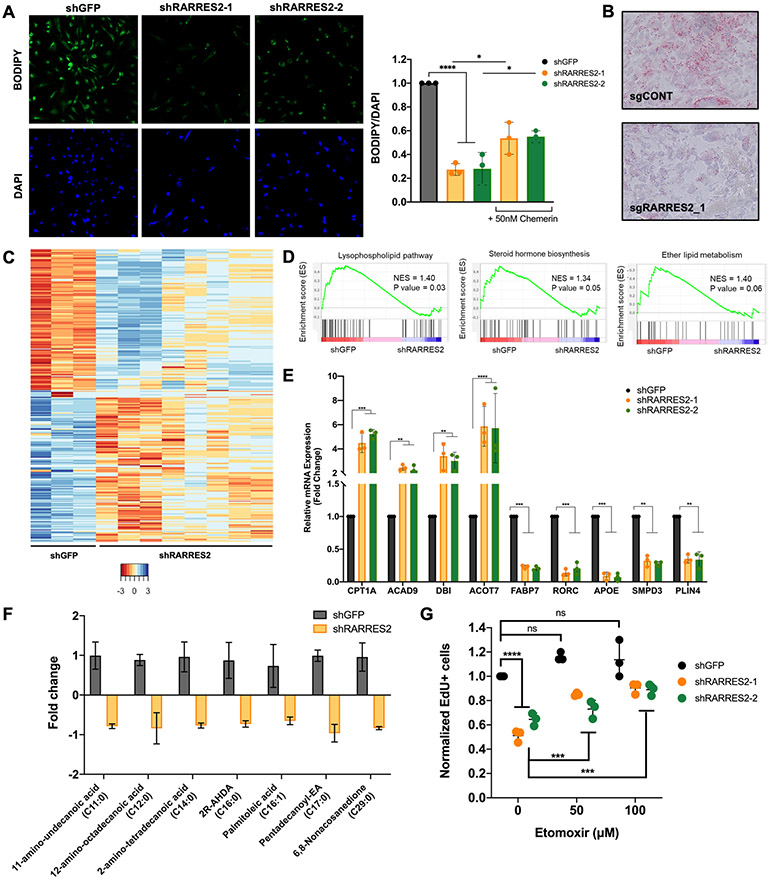
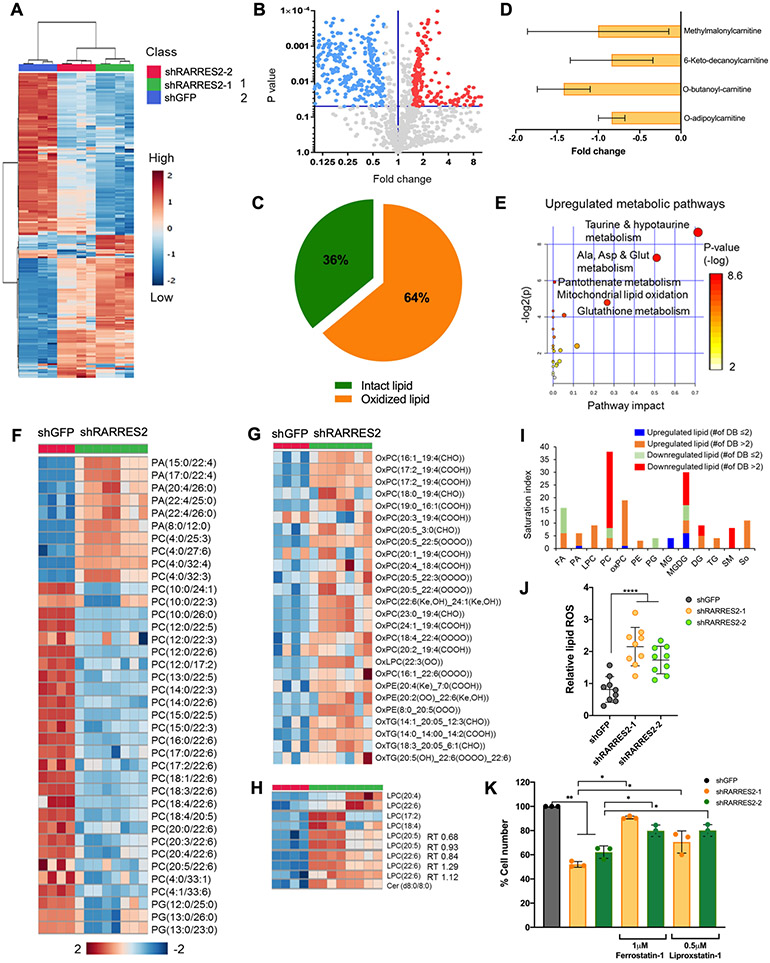
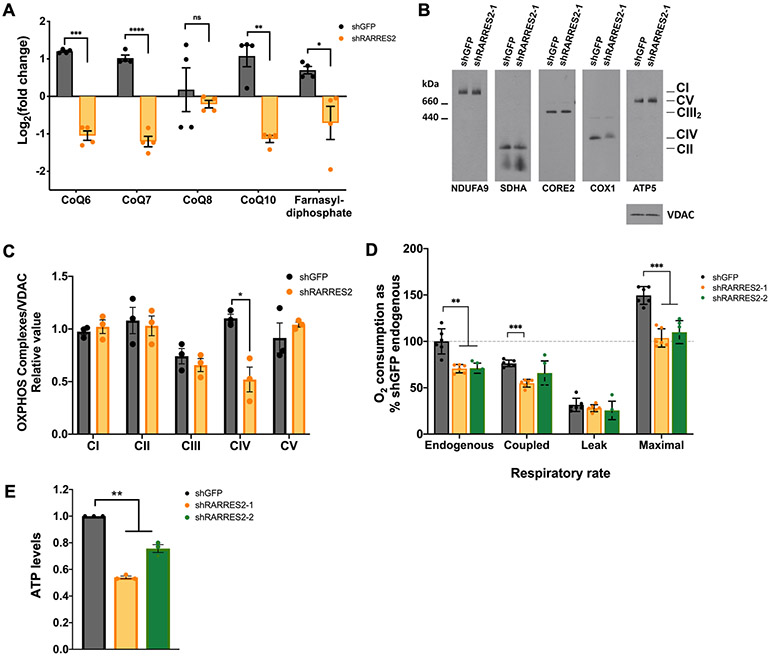
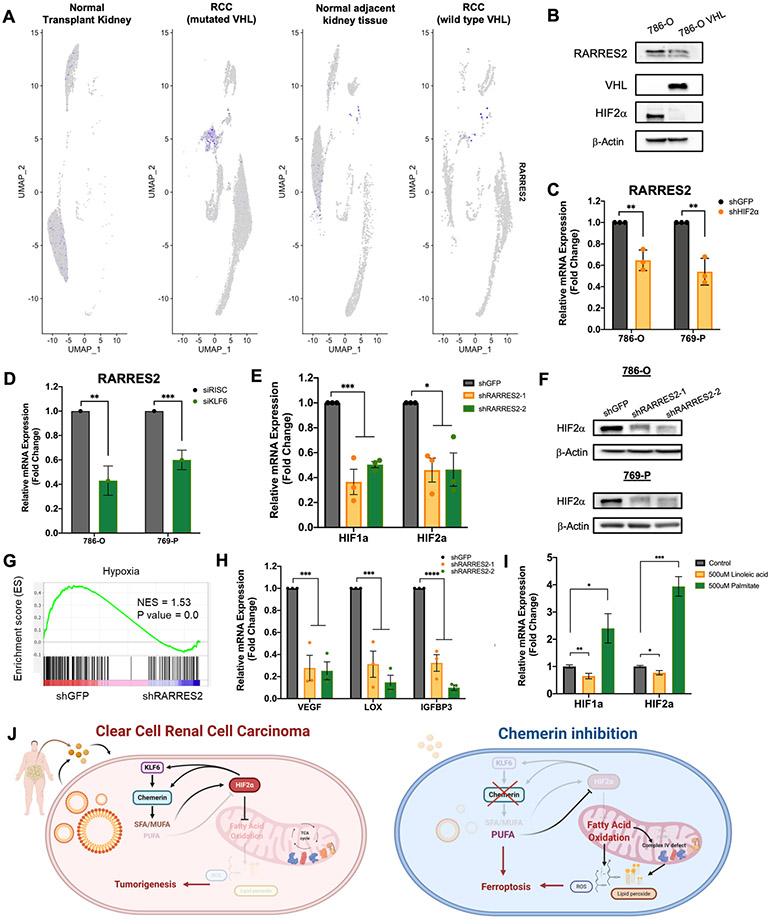
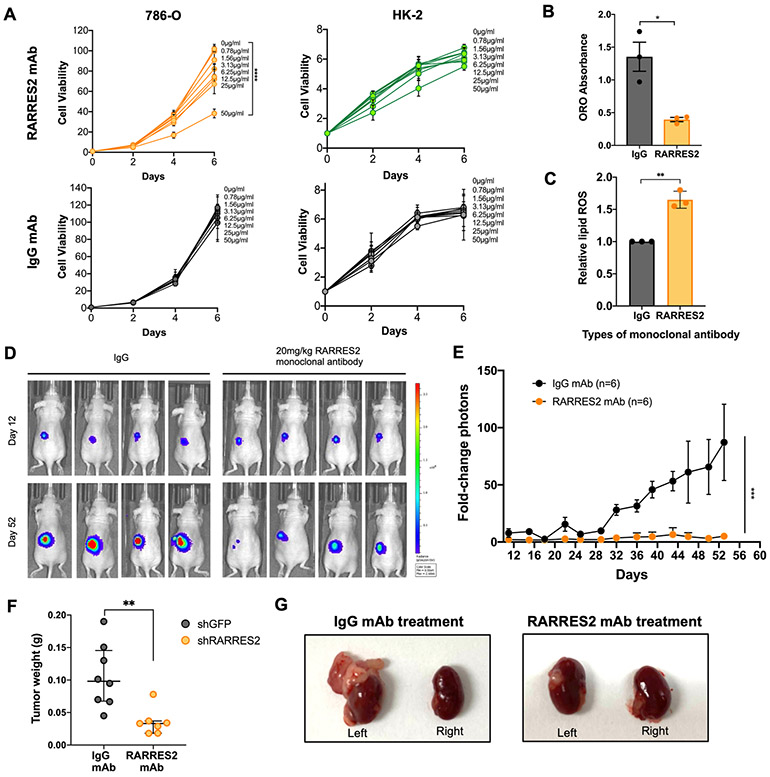
Clear cell renal cell carcinoma (ccRCC) is characterized by accumulation of neutral lipids and adipogenic transdifferentiation. We assessed adipokine expression in ccRCC and found that tumor tissues and patient plasma exhibit obesity-dependent elevations of the adipokine chemerin. Attenuation of chemerin by several approaches led to significant reduction in lipid deposition and impairment of tumor cell growth in vitro and in vivo. A multi-omics approach revealed that chemerin suppresses fatty acid oxidation, preventing ferroptosis, and maintains fatty acid levels that activate hypoxia-inducible factor 2α expression. The lipid coenzyme Q and mitochondrial complex IV, whose biogeneses are lipid-dependent, were found to be decreased after chemerin inhibition, contributing to lipid reactive oxygen species production. Monoclonal antibody targeting chemerin led to reduced lipid storage and diminished tumor growth, demonstrating translational potential of chemerin inhibition. Collectively, the results suggest that obesity and tumor cells contribute to ccRCC through the expression of chemerin, which is indispensable in ccRCC biology. SIGNIFICANCE: Identification of a hypoxia-inducible factor-dependent adipokine that prevents fatty acid oxidation and causes escape from ferroptosis highlights a critical metabolic dependency unique in the clear cell subtype of kidney cancer. Targeting lipid metabolism via inhibition of a soluble factor is a promising pharmacologic approach to expand therapeutic strategies for patients with ccRCC.See related commentary by Reznik et al., p. 1879.This article is highlighted in the In This Issue feature, p. 1861.


Conflict of interest statement

Conflict of interests: The authors declare no potential conflict of interests.

Figures

Figure 1.
Figure 1.. Chemerin is clinically relevant in ccRCC.
(A) Volcano plots showing the differentially expressed genes from comparison of the ccRCC tumor cluster and normal kidney epithelium cluster from single-cell RNA-sequencing (scRNA-seq). Adipogenic trans-differentiation of normal kidney epithelium to ccRCC is demonstrated by an enrichment of adipogenic genes (red circles, left), downregulation of developmental genes (blue circles, middle) and epithelial-to-mesenchymal (EMT) transition genes (downregulated epithelial genes and upregulated mesenchymal genes; orange circles, right). (B) List of adipkines identified by in silico data mining from The Cancer Genome Atlas (TCGA) and Oncomine databases. (C) scRNA-seq data from human ccRCC specimens presented as a UMAP plot demonstrating overexpression of chemerin in tumor cell cluster. Data derived from Young et al. (19). (D) mRNA expression transcripts per million (TPM) of chemerin in ccRCC tumor samples (n=533) and the normal adjacent tissues (n=72) from TCGA. Mann-Whitney U-test. Boxplot represents median and 25th and 75th percentiles, whiskers 1.5 times the interquartile range. (E) mRNA expression TPM of chemerin in Stage I (n=267), Stage II (n=57), Stage III (n=123), Stage IV (n=84) of ccRCC and normal adjacent tissues (n=72) from TCGA. Mann-Whitney U-test. Boxplot represents median and 25th and 75th percentiles, whiskers 1.5 times the interquartile range. (F) Kaplan-Meier curve showing correlation of higher mRNA expression of RARRES2 with poorer survival of ccRCC patients in the TCGA KIRC dataset. Log rank analysis. (G) ELISA analysis of plasma chemerin protein level in 24 normal individuals and 59 ccRCC patients. Mann-Whitney U-test. (H) Plasma chemerin protein level stratified according to BMI status. Normal BMI is defined as value <25kg/m2, overweight as BMI 25kg/m2 ≤BMI<30kg/m2, and obese as BMI≥30kg/m2. Mann-Whitney U-test. (I) Correlation of 20 plasma chemerin expression with corresponding Oil Red O (ORO) staining of tumor sections. Two-tailed student’s t-test. (J) Correlation of plasma chemerin expression with patient characteristics and tumor pathology. p-values based on χ2 analysis. Error bars represent SEM of three independent experiments and three technical replica per experiment. *p<0.05, **p<0.01, ***p<0.001; **** p < 0.0001.
Figure 2.
Figure 2.. Chemerin regulates ccRCC tumor growth in vitro and in vivo.
(A) Immunoblot of lysate confirming knockdown of chemerin (upper panel) and cell proliferation assay from 786-O cells infected with shGFP control or 3 different shRNAs encoding lentivirus targeting chemerin (shRARRES2-1, shRARRES2-2, shRARRES2-3). Two-way repeated measures ANOVA with Geisser-Greenhouse correction. (B) Same as above for 769-P cells. (C) Same as above for UOK101 cells. (D) Same as above for A-498 cells. (E) Cell proliferation assay of 786-O cells infected with lentivirus encoding either sgCONT or sgRARRES2 (sgRARRES2_1 and sgRARRES2_2). 2 different clones for sgRARRES2 were selected. Two-way repeated measures ANOVA with Geisser-Greenhouse correction. (F) Subcutaneous tumor volume measurement in nude mice implanted with 786-O cells which were infected with lentivirus encoding either shGFP (n=7) or 3 different shRARRES2 (n=7 in each arm). Two-way measures ANOVA with Dunnett’s multiple comparison test correction. (G) Same as (F) from 786-O cells infected with lentivirus encoding either sgCONT (n=5) or 2 different sgRARRES2 (n=5 in each arm). Two-way measures ANOVA with Dunnett’s multiple comparison test correction. (H) Representative EdU staining and quantification of 786-O and 769-P cells infected with shGFP control or 2 different shRARRES2 (shRARRES2-1, shRARRES2-2). One-way ANOVA. (I) Flow cytometry for annexin V and propidium iodide staining of 786-O and 769-P cells infected with shGFP control or 2 different shRARRES2 (shRARRES2-1, shRARRES2-2). One-way ANOVA. Error bars represent SEM of three independent experiments and three technical replica per experiment. *p<0.05, **p<0.01, ***p<0.001, ****p<0.0001.
Figure 3.
Figure 3.. Chemerin suppresses fatty acid oxidation.
(A) BODIPY staining of 786-O cells infected with lentivirus targeting shGFP control or 2 different shRARRES2 (upper panels). DAPI staining of nucleus in lower panels. Quantification of BODIPY staining, normalized to DAPI staining, in 786-O cells infected with lentivirus targeting shGFP control or 2 different shRARRES2. One-way ANOVA. Treatment of chemerin-silenced 786-O cells with 50nM recombinant chemerin protein rescued the lipid deposition defect. Two-tailed student’s t-test. (B) Oil-Red-O staining of lipid droplets of tumors harvested from mice implanted with 786-O cells infected with lentivirus encoding either sgCONT or sgRARRES2 (4×). (C) Heatmap of RNA-sequencing for 786-O cells infected with lentivirus encoding either shGFP control (shGFP 1-3) or shRARRES2 (shRARRES2 1-8). (D) Gene set enrichment analysis of RNA-seq demonstrated downregulation of lipid metabolism pathways, including lysophospholipid pathway, steroid hormone biosynthesis pathway and ether lipid metabolism pathway. (E) Expression of CPT1A, ACAD9, DBI, ACOT7, FABP7, RORC, APOE, SMPD3, and PLIN4, as measured by qRT-PCR, in the 786-O cells infected with lentivirus targeting shGFP or 2 different shRARRES2. One-way ANOVA. (F) Fatty acid species that were significantly reduced in metabolite profiling of 786-O cells infected with lentivirus encoding shGFP or 2 different shRARRES2. Two-tailed student’s t-test. (G) Etomoxir treatment (50 μM and 100μM) rescues tumorigenesis in chemerin-knockdown 786-O cells, measured by EdU flow cytometry. Two-tailed student’s t-test. Error bars represent SEM of three independent experiments and three technical replica per experiment. *p < 0.05; **p < 0.01; ***p < 0.001; **** p < 0.0001.
Figure 4.
Figure 4.. Chemerin-dependent lipid homeostasis pathways affects ferroptosis.
(A) Heatmap from untargeted lipidomics of 786-O infected with lentivirus targeting shGFP control, shRARRES2-1, and shRARRES2-2. Blue, low expression; red, high expression. (B) Volcano plot showing the differentially expressed lipid metabolites in shGFP in comparison to shRARRES2. Blue and red circles represent lipid species that were significantly downregulated and upregulated, respectively, in RARRES2-targeted cells. (C) Proportion of oxidized or breakdown versus intact lipid levels in shRARRES2 cells compared to shGFP. (D) Fold change of acylcarnitine species in RARRES2-targeted 786-O cells versus shGFP. (E) Metabolic Pathway Analysis using KEGG human metabolome database that shows the significantly upregulated metabolic pathways according to untargeted lipidomics and metabolomics data after chemerin knockdown. (F) Heatmap from untargeted lipidomics of 786-O infected with lentivirus targeting shGFP (n=4) or shRARRES2 (including shRARRES2-1 and shRARRES2-2, n=8) showing lower glycerophospholipid species in chemerin deficient cells. Blue, low expression; red, high expression. PA, phosphatidic acid; PC, phosphatidylcholine; PG, phosphatidylglycerol. (G) Heatmap from untargeted lipidomics showing higher oxidized glycerophospholipid species in chemerin deficient cells. Blue, low expression; red, high expression. OxPC, oxidized phosphatidylcholine; OxLPC, oxidized lysophosphatidylcholine; OxPE, oxidized phosphatidylethanolamine; OxTG, oxidized triacylglycerols. (H) Heatmap from untargeted lipidomics showing higher lysophosphatidylcholine, the breakdown product of phosphatidylcholine, in chemerin deficient cells. Blue, low expression; red, high expression. LPC, lysophosphatidylcholine; Cer, ceramides. (I) Saturation index of different lipid species after chemerin knockdown. Stacked bar chart shows different saturation abundances of significant lipid classes in chemerin knockdown cells compared to controls. DB, double bond. (J) Lipid reactive oxygen species (ROS) measurement by BODIPY 581/591 C-11 in 786-O infected with lentivirus encoding either shGFP or shRARRES2. One-way ANOVA. (K) 786-O cells infected with lentivirus encoding either shGFP or shRARRES2, were treated with 2 different ferroptosis inhibitors (1 μM Ferrostatin-1 or 0.5 μM Liproxstatin-1). Two-tailed student’s t-test. Error bars represent SEM of three independent experiments and three technical replica per experiment. *p < 0.05; **p < 0.01; ***p < 0.001; **** p < 0.0001.
Figure 5.
Figure 5.. Genetic deletion of chemerin in ccRCC cells affects mitochondrial OXPHOS.
(A) Metabolic profiling of CoQ (CoQ6, CoQ7, CoQ8, and CoQ10) and farnesyl-diphosphate from mass spectrometry analysis of 786-O cells infected with lentivirus targeting shGFP control or shRARRES2. Four technical replicates were performed. (B) Steady-state levels of mitochondrial individual OXPHOS complexes were evaluated by BN-PAGE analysis of whole cell extracts prepared in the presence of 1% lauryl maltoside (LM) and probed with antibodies against complex I subunit NDUFA9, complex II subunit SDHA, complex III subunit CORE2, complex IV subunit COX1 and complex V subunit ATP5. (C) Signals from (B) were quantified and normalized by VDAC using the histogram function of Adobe Photoshop on digitalized images. Error bars represent the mean ± SD of three independent experiments with two technical replicates. Unpaired T-test with Welch’s correction. (D) NADH substrate-driven cellular respiratory rates expressed as percentile of shGFP control endogenous O2 consumption. Error bars represent the mean ± SD of three independent experiments with two technical replicates. Unpaired t-test with Welch’s correction. (E) ATP measurement following chemerin knockdown in 786-O cells. One-way ANOVA. Error bars represent SEM of three independent experiments and three technical replica per experiment. *p < 0.05; **p < 0.01; ***p < 0.001; **** p < 0.0001; ns, not significant.
Figure 6.
Figure 6.. Chemerin expression is VHL dependent and regulates HIF expression.
(A) scRNA-seq data from human normal transplant kidney, normal kidney tissue adjacent to tumor, ccRCC specimens with wild-type VHL and ccRCC specimens with VHL mutation, presented as UMAP plots. (B) Immunoblots of lysates from 786-O transfected with VHL plasmids. (C) Relative mRNA expression of chemerin in 786-O and 760-P cells infected with lentivirus encoding shGFP or shHIF2α. Two-tailed student’s t-test. (D) Relative mRNA expression of chemerin in 786-O and 769-P cells transfected with control siRISC or siKLF6. Two-tailed student’s t-test. (E) Expression of HIF1α and HIF2α after chemerin knockdown in 786-O cells, measured by qRT-PCR. One-way ANOVA. (F) Immunoblots of lysates from 786-O and 769-P for HIF2α after infection with lentivirus targeting shGFP or 2 different shRARRES2. (G) Gene set enrichment analysis of RNA-sequencing of 786-O infected with lentivirus encoding either shGFP or shRARRES2, demonstrating downregulation of hypoxia associated pathways. Blue, low expression; red, high expression. (H) Relative mRNA expression of HIF target genes, VEGF, LOX and IGFBP3 after chemerin knockdown in 786-O cells, measured by qRT-PCR. One-way ANOVA. (I) Relative mRNA expression of HIF1α and HIF2α in 786-O after incubation with 500μM linoleic acid or 500μM palmitic acid for 24 hours, measured by qRT-PCR. One-way ANOVA. (J) Proposed mechanism of chemerin regulation of ccRCC tumorigenesis. HIF2α, hypoxia inducible factor 2 alpha; MUFA, monounsaturated fatty acid; PUFA, polyunsaturated fatty acid; ROS, reactive oxygen species; SFA, saturated fatty acid; TCA cycle, tricarboxylic acid cycle. Error bars represent SEM of three independent experiments and three technical replica per experiment. *p < 0.05; **p < 0.01; ***p < 0.001; **** p < 0.0001.
Figure 7.
Figure 7.. Monoclonal antibody (mAb) targeting chemerin reduces ccRCC tumor burden.
(A) Cell viability assay of 786-O and HK-2 cells treated with RARRES2 mAb (upper panels) and IgG mAb control (lower panels). Two-way repeated measures ANOVA was used for statistical analysis with Tukey correction. (B) ORO staining quantification in 786-O cells treated with either IgG mAb or RARRES2 mAb. Two tailed student’s t-test. (C) Relative lipid ROS measured using BODIPY 581/591 C11 assay in 786-O cells treated with either IgG mAb or RARRES2 mAb. Two tailed student’s t-test. (D) Representative bioluminescence imaging of before (Day 0) and Day 28 post-treatment in mice receiving 20 mg/kg of either mAb (n=6 each arm), after 786-O was implanted orthotopically under the left kidney capsule of nude mice. (E) Quantification of bioluminescence imaging of before (day 0) and day 52 post-treatment in mice receiving 20 mg/kg of either mAb (n=6 each arm), after 786-O cells were implanted orthotopically under the left kidney capsule of nude mice. One-tailed student’s t-test. (F) Tumor weight measurement (n=6 each group) at the end of the assay. Student’s t-test. (G) Representative kidney tumor from (E). Error bars represent SEM of three independent experiments and three technical replica per experiment. *p < 0.05; **p < 0.01; ***p < 0.001; **** p < 0.0001.

Comment in

Similar articles

Cited by

References

    1. Zhang Z, Lin E, Zhuang H, Xie L, Feng X, Liu J, et al. Construction of a novel gene-based model for prognosis prediction of clear cell renal cell carcinoma. Cancer Cell Int 2020;20:27 doi 10.1186/s12935-020-1113-6. - DOI - PMC - PubMed
    1. Cui W, Luo W, Zhou X, Lu Y, Xu W, Zhong S, et al. Dysregulation of Ketone Body Metabolism Is Associated With Poor Prognosis for Clear Cell Renal Cell Carcinoma Patients. Front Oncol 2019;9:1422 doi 10.3389/fonc.2019.01422. - DOI - PMC - PubMed
    1. Siegel RL, Miller KD, Jemal A. Cancer statistics, 2019. CA Cancer J Clin 2019;69(1):7–34 doi 10.3322/caac.21551. - DOI - PubMed
    1. Padala SA, Barsouk A, Thandra KC, Saginala K, Mohammed A, Vakiti A, et al. Epidemiology of Renal Cell Carcinoma. World J Oncol 2020;11(3):79–87 doi 10.14740/wjon1279. - DOI - PMC - PubMed
    1. Garje R, An J, Greco A, Vaddepally RK, Zakharia Y. The Future of Immunotherapy-Based Combination Therapy in Metastatic Renal Cell Carcinoma. Cancers 2020;12(1):143 doi 10.3390/cancers12010143. - DOI - PMC - PubMed

Publication types