. 2022 Mar;71(3):509-520.
doi: 10.1136/gutjnl-2020-323363. Epub 2021 Mar 23.

Activation of the GPR35 pathway drives angiogenesis in the tumour microenvironment

Affiliations

Activation of the GPR35 pathway drives angiogenesis in the tumour microenvironment

Ester Pagano et al. Gut. 2022 Mar.

Abstract

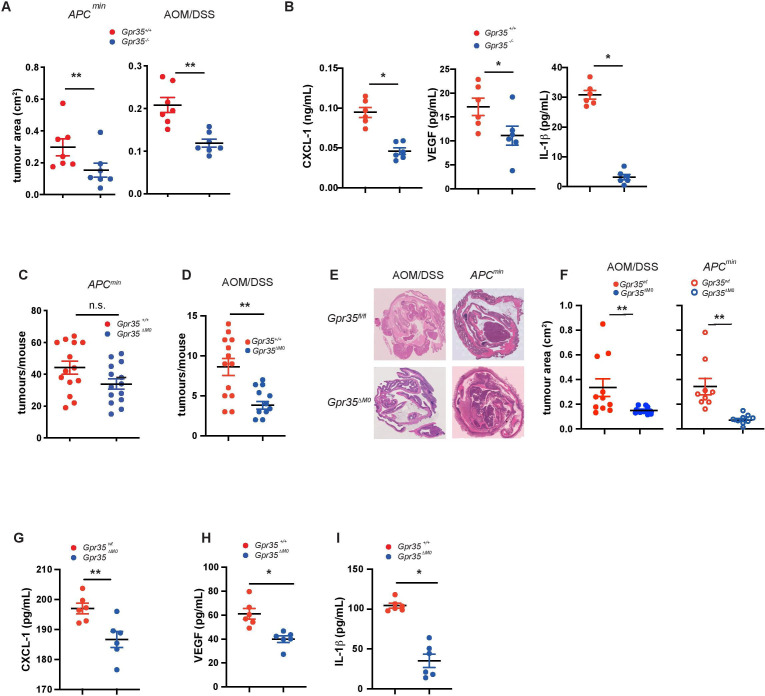
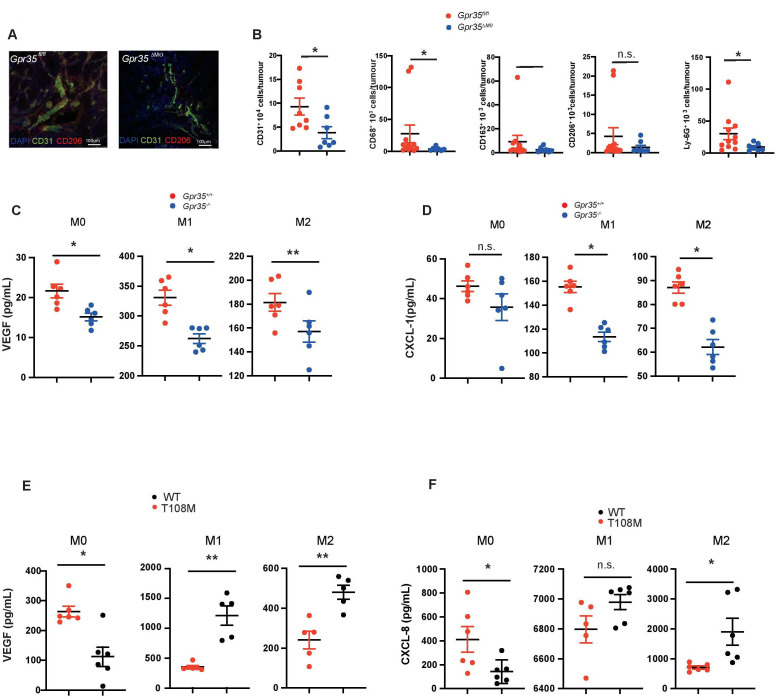
Objective: Primary sclerosing cholangitis (PSC) is in 70% of cases associated with inflammatory bowel disease. The hypermorphic T108M variant of the orphan G protein-coupled receptor GPR35 increases risk for PSC and ulcerative colitis (UC), conditions strongly predisposing for inflammation-associated liver and colon cancer. Lack of GPR35 reduces tumour numbers in mouse models of spontaneous and colitis associated cancer. The tumour microenvironment substantially determines tumour growth, and tumour-associated macrophages are crucial for neovascularisation. We aim to understand the role of the GPR35 pathway in the tumour microenvironment of spontaneous and colitis-associated colon cancers.

Design: Mice lacking GPR35 on their macrophages underwent models of spontaneous colon cancer or colitis-associated cancer. The role of tumour-associated macrophages was then assessed in biochemical and functional assays.

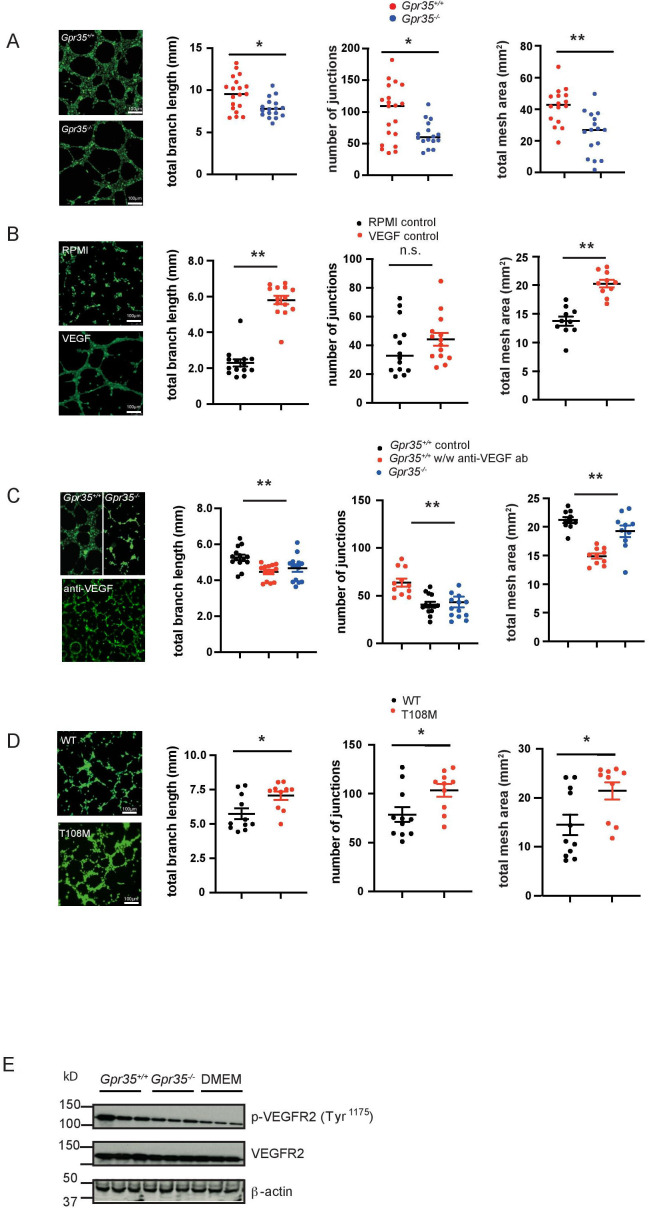
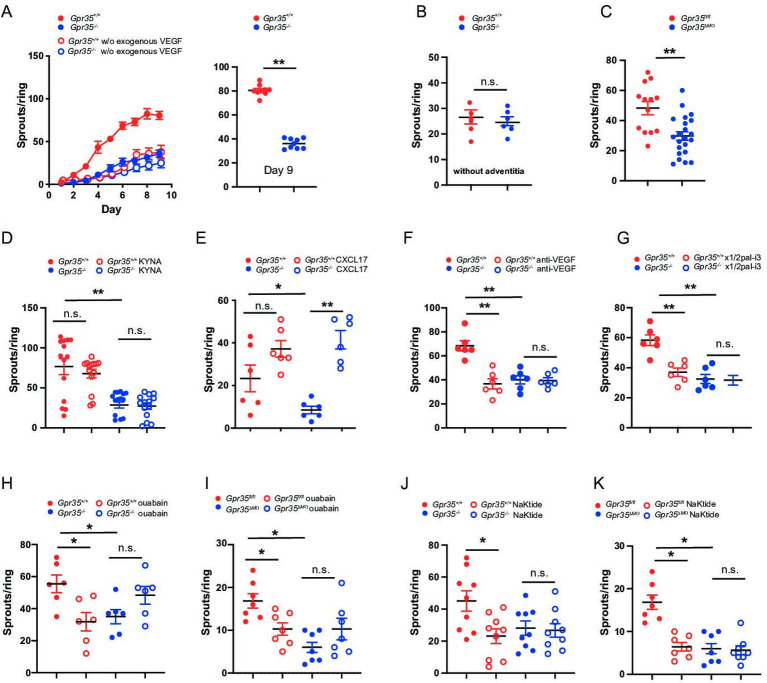
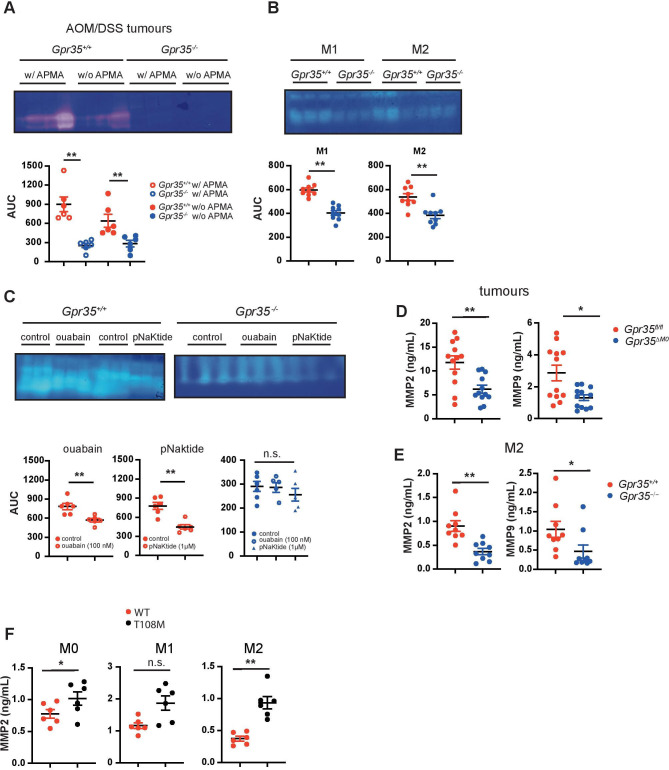
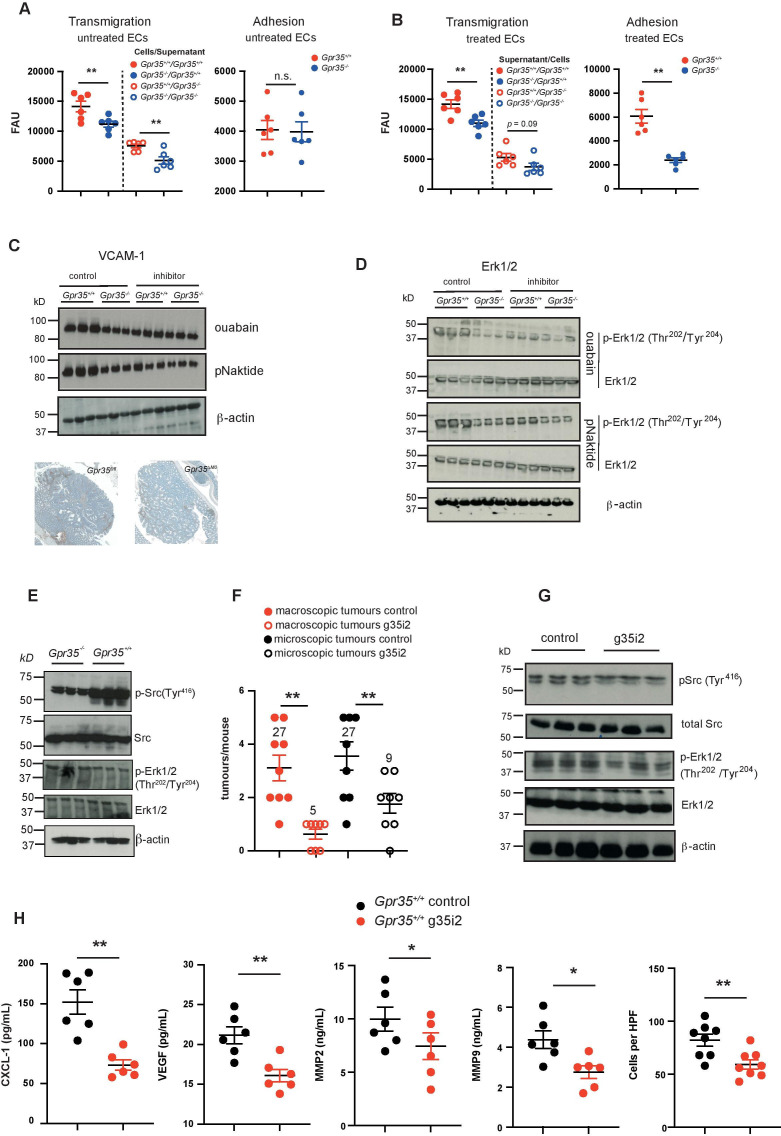
Results: Here, we show that GPR35 on macrophages is a potent amplifier of tumour growth by stimulating neoangiogenesis and tumour tissue remodelling. Deletion of Gpr35 in macrophages profoundly reduces tumour growth in inflammation-associated and spontaneous tumour models caused by mutant tumour suppressor adenomatous polyposis coli. Neoangiogenesis and matrix metalloproteinase activity is promoted by GPR35 via Na/K-ATPase-dependent ion pumping and Src activation, and is selectively inhibited by a GPR35-specific pepducin. Supernatants from human inducible-pluripotent-stem-cell derived macrophages carrying the UC and PSC risk variant stimulate tube formation by enhancing the release of angiogenic factors.

Conclusions: Activation of the GPR35 pathway promotes tumour growth via two separate routes, by directly augmenting proliferation in epithelial cells that express the receptor, and by coordinating macrophages' ability to create a tumour-permissive environment.

Keywords: angiogenesis; colorectal cancer; primary sclerosing cholangitis; receptor characterisation; ulcerative colitis.


Conflict of interest statement

Competing interests: None declared.

Figures

Figure 1
Figure 1
GPR35 increases tumour size and release of proangiogenic cytokines. (A) The area of intestinal adenomas from Apc min mice either wild-type (Gpr35+/+ ) and globally deficient for GPR35 (Gpr35-/- ) (left panel) or from Gpr35+/+ and Gpr35-/- mice exposed to AOM and three cycles of DSS (right panel) were compared. N=7 tumours per genotype. (B) CXCL-1, VEGF and IL-1β levels measured in AOM/DSS tumour tissue of Gpr35+/+ and Gpr35-/- mice. N=6 tumours per genotype. (C) Mice conditionally deficient for macrophage GPR35 (Gpr35 ΔMΦ) were crossed with APCmin mice and tumours were counted when the mice reached an age of 16 weeks. N=14 mice per genotype. (D) Gpr35 ΔMΦ mice were exposed to AOM and DSS. Colon adenomas were counted in Gpr35 ΔMΦ mice and in their control Gpr35fl/fl . N=11 to 13 mice per genotype. (E) Representative images showing H&E stain of tumours from Gpr35fl/fl and Gpr35 ΔMΦ mice. (F) The area of intestinal adenomas from either Gpr35fl/fl ; APC min and Gpr35 ΔMΦ; Apc min mice (left panel) or from Gpr35fl/fl and Gpr35 ΔMΦ mice exposed to AOM/DSS (right panel) were compared. N=9 tumours per genotype. (G–I) CXCL-1 (G), VEGF (H) and IL-1β (I) levels measured in AOM/DSS tumour tissue of Gpr35fl/fl and Gpr35 ΔMΦ mice. N=6 tumours per genotype. All data represented as mean±SEM. Statistical significance was calculated using Mann-Whitney U after Kruskal-Wallis testing. * p<0.05, ** p<0.01. AOM, azoxymethane; APC, Adenomatosis Polyposis Coli; DSS, dextran sodium sulphate; IL-1β, interleukin 1β; n.s., not significant.
Figure 2
Figure 2
GPR35 deletion in myeloid cells reduces angiogenic potential. (A) Adenomas from Gpr35fl/fl and Gpr35 ΔMΦ mice exposed to AOM/DSS stained for CD31+ endothelial cells and CD206+ M2 macrophages. N=5 each genotype, representative confocal microscopy. Scale bars 100 µm. (B) FACS analyses of CD31+, CD68+, CD163+, CD206+ and Ly-G6+ cells in Gpr35fl/fl and Gpr35 ΔMΦ tumour tissue. N=8–12 Gpr35fl/fl tumours from 8 to 12 mice and N=7 Gpr35 ΔMΦ tumours from mice. (C) VEGF levels in M0, M1 and M2 BMDM from Gpr35+/+ and Gpr35-/- mice. N=6 per genotype. (D) CXCL-1 levels in M0, M1 and M2 BMDM from Gpr35+/+ and Gpr35-/- mice. N=6 per genotype. (E) VEGF levels in supernatants of M0, M1 and M2 human iPS cell-derived macrophages. N=6 each genotype. (F) CXCL-8 levels in supernatants of M0, M1 and M2 human iPS cell-derived macrophages. N=6 each genotype. * p<0.05, ** p<0.01. AOM/DSS, azoxymethane followed by dextran sodium sulphate; iPS, inducible-pluripotent-stem; n.s., not significant; WT, wild type.
Figure 3
Figure 3
GPR35 deletion in macrophages and neutrophils reduces tube formation. (A) Tube formation assay with murine SVEC endothelial cells incubated with Gpr35+/+ and Gpr35-/- M2 macrophage supernatants. Branch length, number of junctions and total mesh area were determined using ImageJ’s angiogenesis tool. N=18. (B) 2 H-11 control tube formation assays with control RPMI/10%FBS and RPMI/10%FBS containing 30 ng/mL VEGF. No macrophage supernatants present. Branch length, number of junctions and total mesh area were determined using the Image J’s angiogenesis tool. N=14 C. 2 H-11 tube formation assays with supernatants of wild-type (WT) and knock-out macrophages in the presence of blocking anti-VEGF antibody. Branch length, number of junctions and total mesh area were determined using Image J’s angiogenesis tool. N=14. (D) HMVEC tube formation assays with human microvascular endothelial cells. Endothelial cells were incubated with supernatants of iPS cell-derived macrophage supernatants (WT and T108M risk variant). Branch length, number of junctions and total mesh area were determined using Image J’s angiogenesis tool. N=10. (E) VEGF receptor 2 phosphorylation of 2 H-11 cells treated with WT or Gpr35–/– M2 supernatants. All data represented as mean±SEM. Statistical significance was calculated using Mann-Whitney U after Kruskal-Wallis testing. HMVEC, human microvascular endothelial cell; iPS, inducible-pluripotent-stem; n.s., not significant.
Figure 4
Figure 4
Macrophage GPR35 controls vascular sprouting by interacting with the Na/K-ATPase. (A) Aortic rings from Gpr35 +/+ or Gpr35 –/– mice embedded in collagen matrix. Number of sprouts counted daily until day 9 of the experiment. Aortic rings were either embedded in media containing 30 ng/mL of VEGF (full circles) or left in OptiMEM media without growth factors (open circles) N=9 mice per genotype. (B) Vascular adventitia was removed from aortic rings from Gpr35 +/+ or Gpr35 –/–. Number of sprouts on day 9. N=6 mice per genotype. (C) Aortic rings from wildtype animals (Gpr35fl/fl ) or mice lacking GPR35 conditionally on their LysM+ cellsGpr35 ΔMΦ. N=13 for Gpr35fl/fl and 23 for Gpr35ΔMΦ mice. (D) KYNA (100 µM) was added to the aortic rings of Gpr35 +/+ or Gpr35 –/– mice and vascular sprouts counted on day 9. N=5 mice for each genotype. (E) CXCL-17 (20 ng/mL) was added to the aortic rings of Gpr35 +/+ or Gpr35 –/– mice and vascular sprouts counted on day 9. N=6 mice for each genotype. (F) Anti-VEGF antibody (100 ng/mL) was added to the aortic rings of Gpr35 +/+ or Gpr35 –/– mice and vascular sprouts counted on day 9. n=6 for each genotype. (G) Blocking CXCR2 pepducin x1/2pal-i3 (3 µM) was added to the aortic rings of Gpr35 +/+ or Gpr35 –/– mice and vascular sprouts counted on day 9. n=6 for each genotype. (H, I.) ouabain (100 µM) was added to the aortic rings of Gpr35 +/+ or Gpr35 –/– mice (H) and to the aortic rings of Gpr35fl/fl and Gpr35 ΔMΦ mice (I) and vascular sprouts counted on day 9. N=6 for each genotype. (J, K) pNaKtide (1 µM) was added to the aortic rings of Gpr35 +/+ or Gpr35 –/– mice (J) and to the aortic rings of Gpr35fl/fl and Gpr35 ΔMΦ mice (K) and vascular sprouts counted on day 9. N=9 for each genotype. All data represented as mean±SEM. Statistical significance was calculated using Mann-Whitney U after Kruskal-Wallis testing.* p<0.05, ** p<0.01. n.s., not significant.
Figure 5
Figure 5
Lack of GPR35 results in reduced MMP levels. (A) MMP levels in Gpr35 +/+ and Gpr35 –/– adenomas. Tissue extract MMPs were activated with APMA. Area under the curve was analysed using image J. N=6 tumours per genotype. (B) MMP levels in M1 and M2 BMDM supernatants from Gpr35 +/+ and Gpr35 –/– mice. Supernatants were APMA-activated. area under the curve was analysed using image J N=9 mice per genotype. (C) MMP levels in M2 macrophages pretreated with ouabain (100 µM) or pNaKtide (1 µM). Area under the curve was analysed using image J N=6 mice per genotype. (D) Total (inactive zymogen and active enzyme) MMP2 and MMP9 levels in tumour tissue from Gpr35fl/fl and Gpr35 ΔMΦ mice. (E) MMP2 and MMP9 levels from M2 murine BMDM supernatants. (F) Total (inactive zymogen and active enzyme) MMP2 levels from supernatants of human iPS cell-derived macrophages. Macrophages were polarised to M0, M1 and M2 macrophages. All data represented as mean±SEM. Statistical significance was calculated using Mann-Whitney U after Kruskal-Wallis testing. * p<0.05, ** p<0.01/ APMA, aminophenylmercuric acetate; MMP, matrix-metallo-proteinase; n.s., not significant; WT, wild type.
Figure 6
Figure 6
Lack of GPR35 decreases endothelial transmigration. (A) Right panel: Gpr35 +/+ and Gpr35 –/– monocytes transendothelial migration towards conditioned media from Gpr35 +/+ and Gpr35 –/– M2 macrophages in the lower compartments of migration chambers. Untreated endothelial cell monolayer. Left panel: adhesion of Gpr35 +/+ and Gpr35 –/– monocytes to 2 H-11 murine endothelial cells. Untreated endothelial cell monolayer. N=6 mice per genotype. (B) Left panel: transendothelial migration of monocytes through monolayers of 2 H-11 murine endothelial cells exposed to conditioned media from Gpr35 +/+ and Gpr35 –/– M2 macrophages. right panel: adhesion of Gpr35 +/+ and Gpr35 –/– monocytes to 2 H-11 murine endothelial cells treated with conditioned media from Gpr35 +/+ and Gpr35 –/– M2 macrophages. N=6 mice per genotype. (C) Upper panel: VCAM-1 expression in 2 H-11 cells treated with conditioned media from Gpr35 +/+ and Gpr35 –/– M2 macrophages pretreated with control RPMI, ouabain (100 µM) or pNaKtide (1 µM). Lower panel: VCAM-1 expression in Gpr35fl/fl and Gpr35 ΔMΦ AOM/DSS tumours. (D) ERK1/2 phosphorylation of 2 H-11 cells treated with conditioned media from Gpr35 +/+ and Gpr35 –/– M2 macrophages pretreated with control RPMI, ouabain (100 µM) or pNaKtide (1 µM). (E) Src and ERK1/2 phosphorylation in Gpr35 +/+ and Gpr35 –/– AOM/DSS tumours. N=3 tumours per genotype. (F) Numbers of macroscopic and microscopic tumours of either g35i2 or vehicle treated mice with AOM/DSS induced tumours. N=8–9 mice/group. (G) AOM/DSS tumour tissue from g35i2 or vehicle treated mice probed for Src and ERK1/2 phosphorylation. N=3 tumours per genotype. (H) CXCL-1, VEGF, MMP2, MMP9 and inflammatory infiltrate in tumour tissue from g35i2 or vehicle-treated wild-type mice. N=6 per genotype for CXCL-1, VEGF, MMP2 and MMP9 ELISA assays, and n=8 for histological assessment of inflammatory cell infiltrate. All data represented as mean±SEM. Statistical significance was calculated using Mann-Whitney U after Kruskal-Wallis testing. AOM/DSS, azoxymethane followed by dextran sodium sulphate; n.s., not significant.

Similar articles

Cited by

References

    1. Siegel RL, Miller KD, Jemal A. Cancer statistics, 2019. CA Cancer J Clin 2019;69:7–34. 10.3322/caac.21551 - DOI - PubMed
    1. Fearon ER, Hamilton SR, Vogelstein B. Clonal analysis of human colorectal tumors. Science 1987;238:193–7. 10.1126/science.2889267 - DOI - PubMed
    1. Ritter B, Greten FR. Modulating inflammation for cancer therapy. J Exp Med 2019;216:1234–43. 10.1084/jem.20181739 - DOI - PMC - PubMed
    1. Henriksen EKK, Melum E, Karlsen TH. Update on primary sclerosing cholangitis genetics. Curr Opin Gastroenterol 2014;30:310–9. 10.1097/MOG.0000000000000052 - DOI - PubMed
    1. Danese S, Mantovani A. Inflammatory bowel disease and intestinal cancer: a paradigm of the yin-yang interplay between inflammation and cancer. Oncogene 2010;29:3313–23. 10.1038/onc.2010.109 - DOI - PubMed

Publication types

MeSH terms

Substances