. 2021 Mar 23;4(6):e202000903.
doi: 10.26508/lsa.202000903. Print 2021 Jun.

Cancer-associated cells release citrate to support tumour metastatic progression

Affiliations

Cancer-associated cells release citrate to support tumour metastatic progression

Konstantin Drexler et al. Life Sci Alliance. .

Abstract

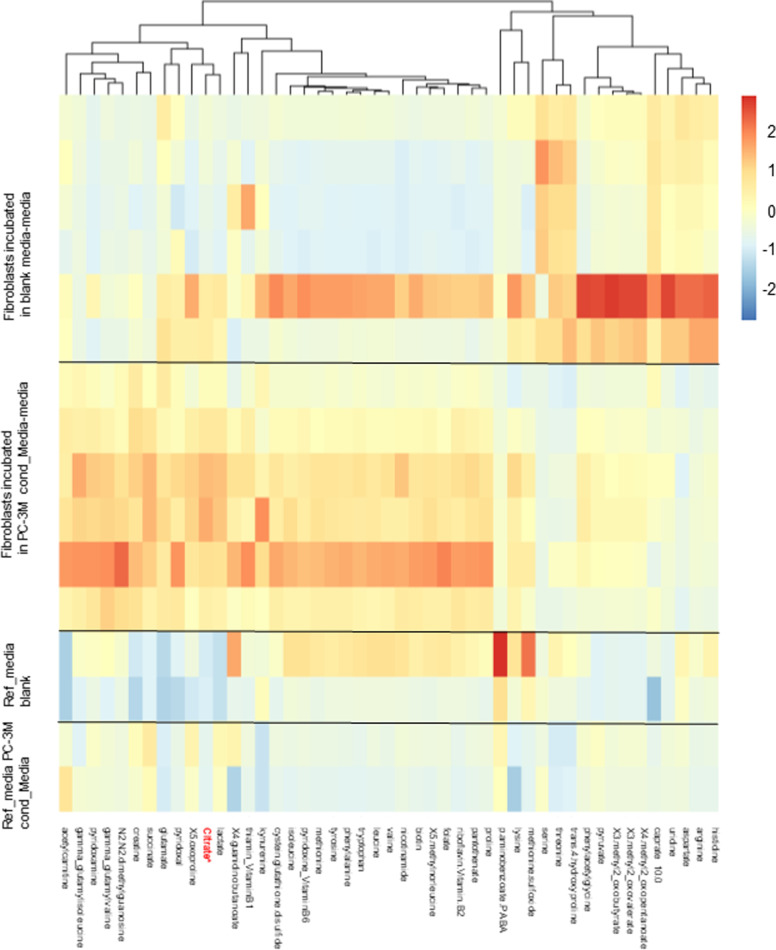
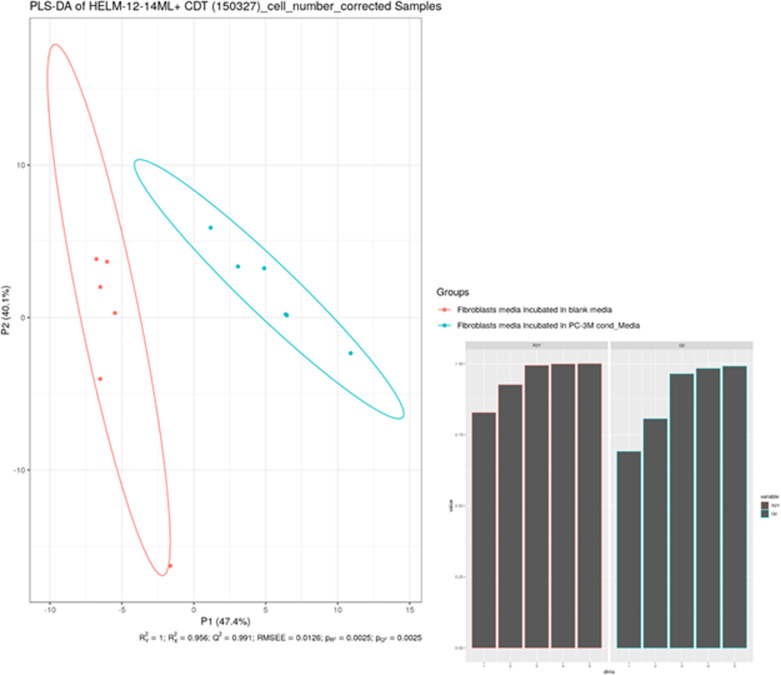
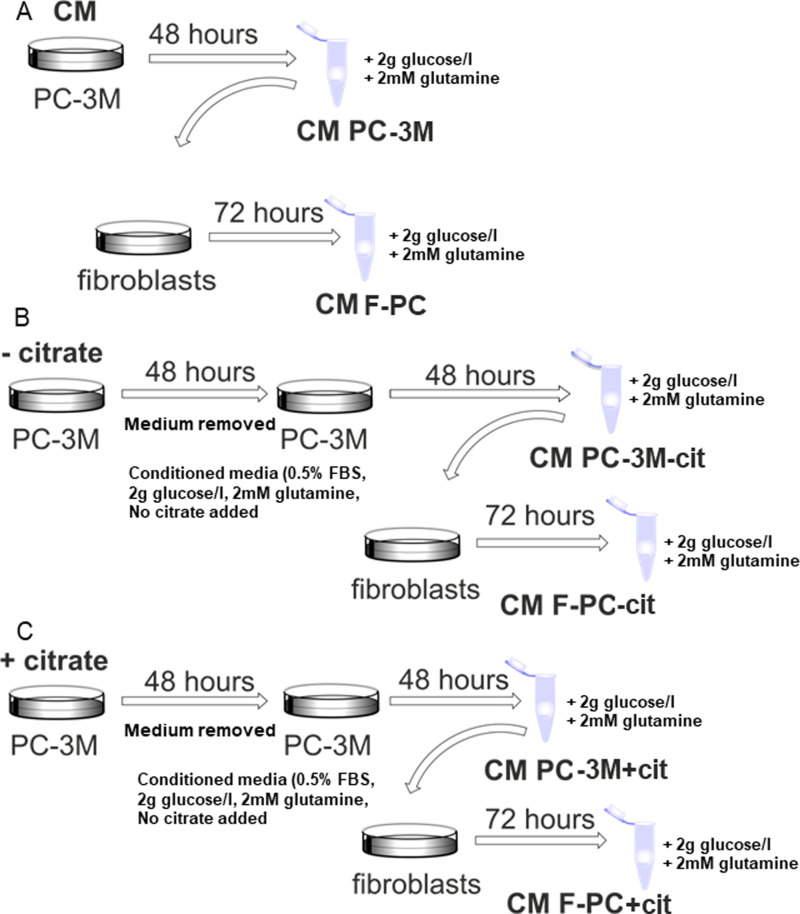
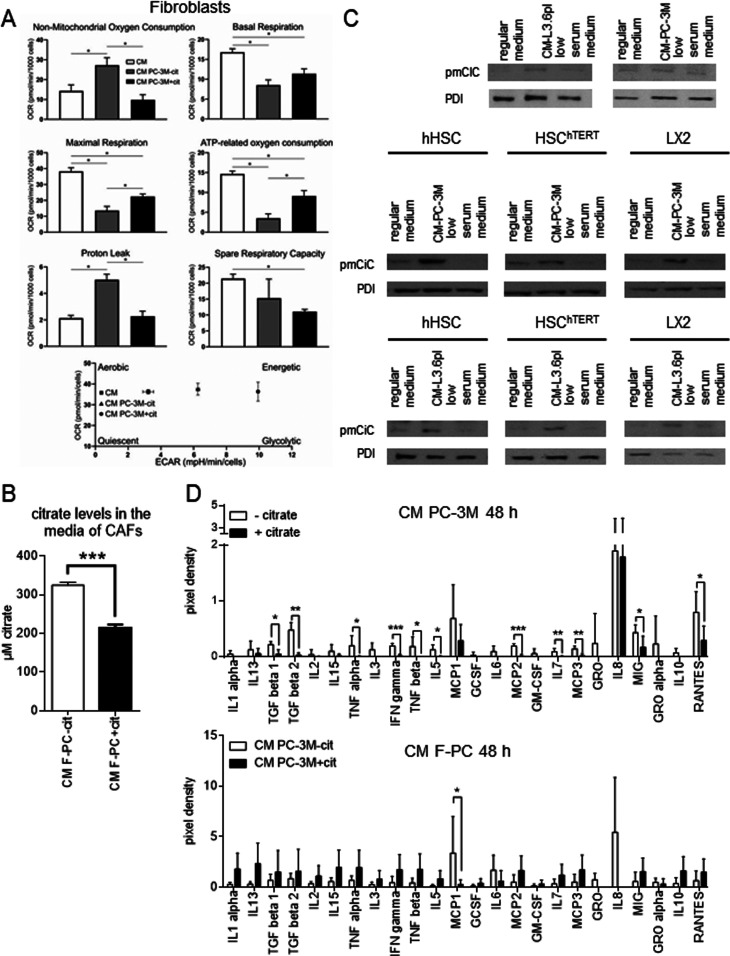
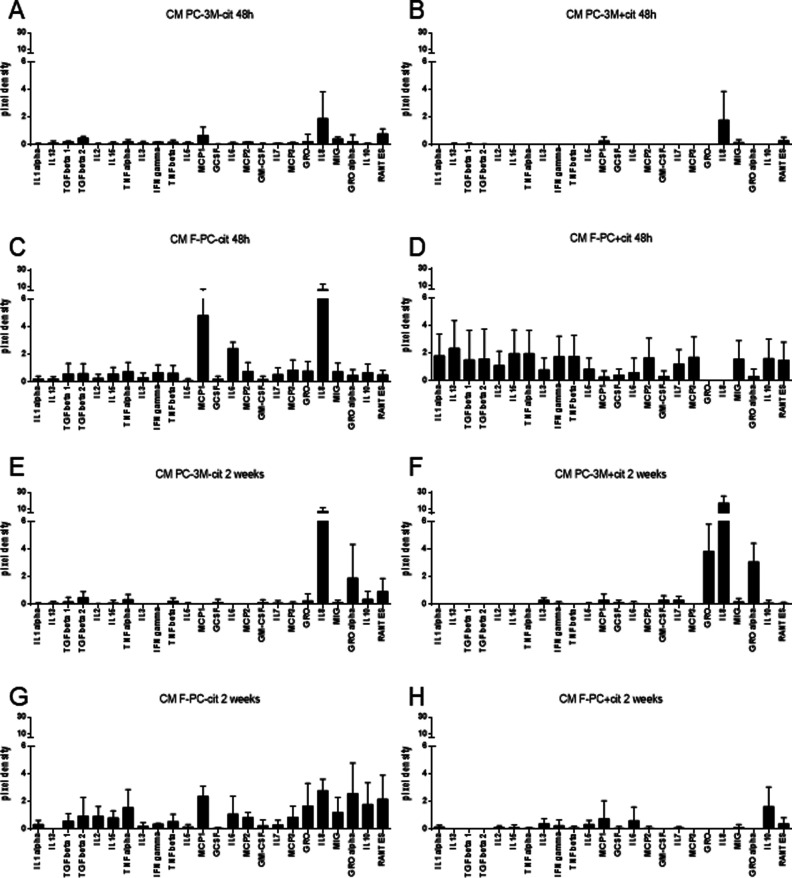
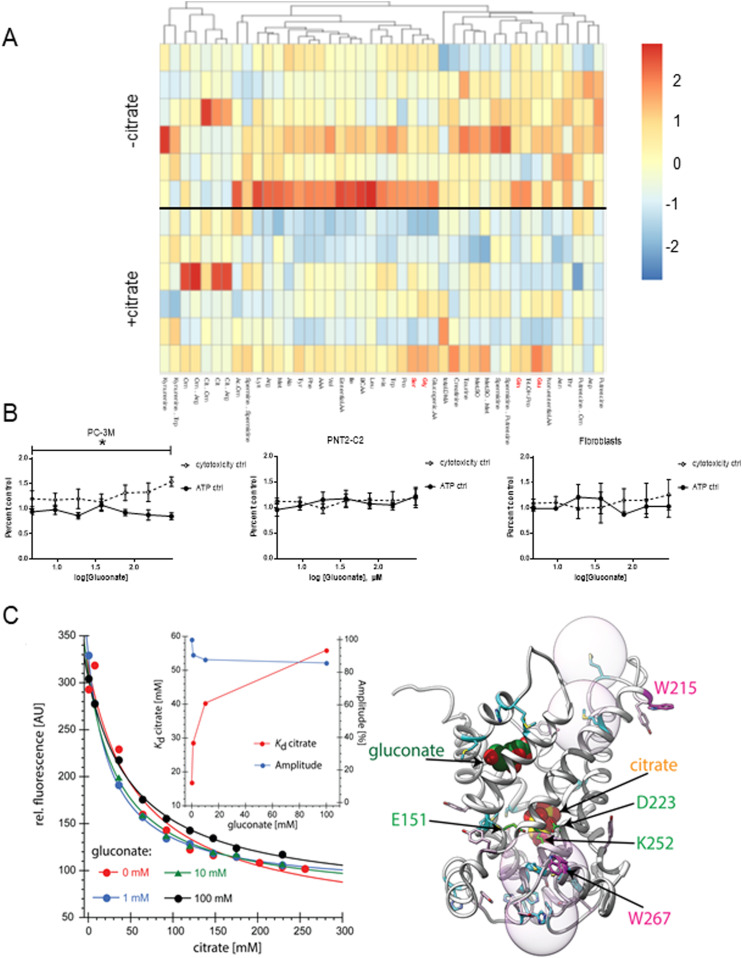
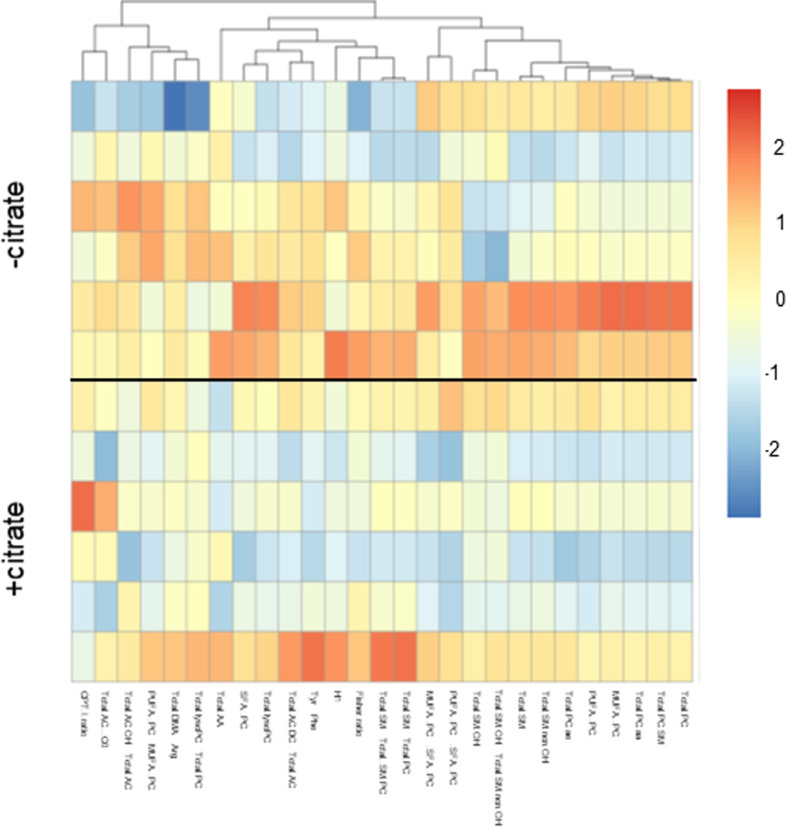
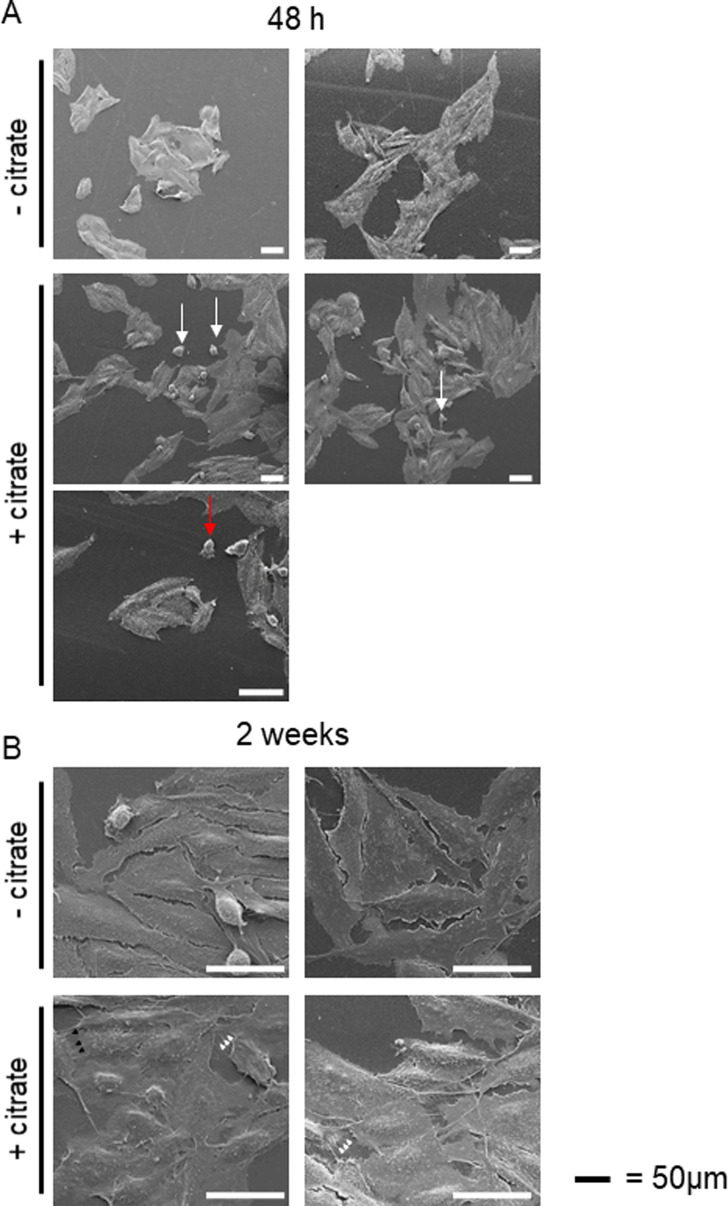
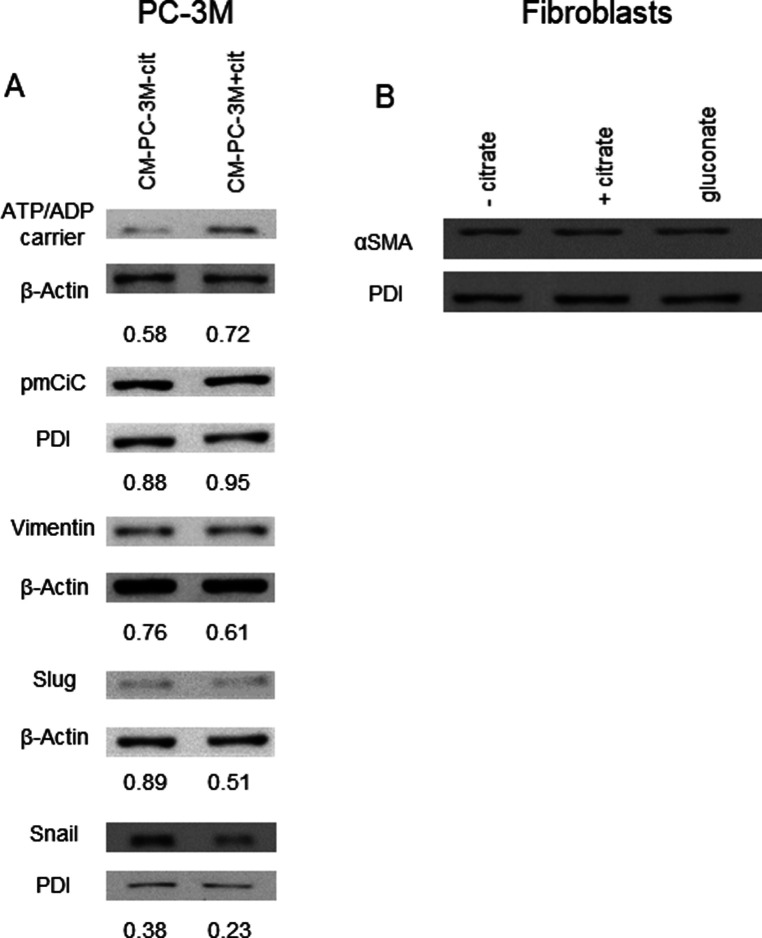
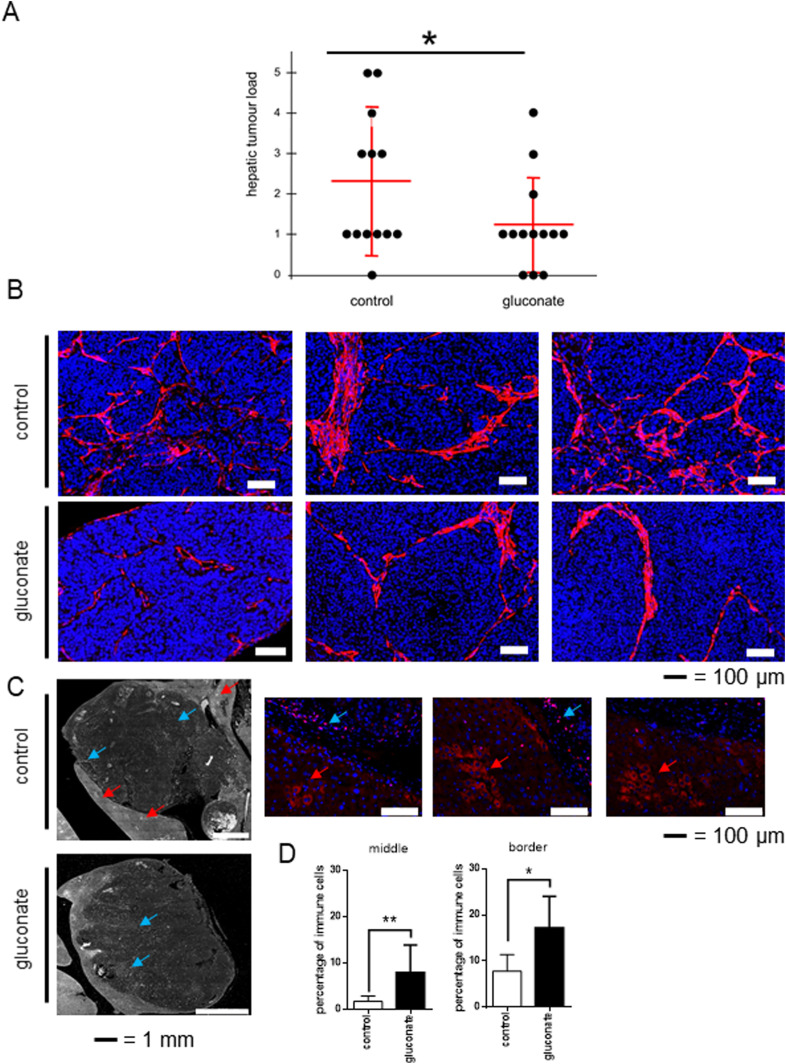
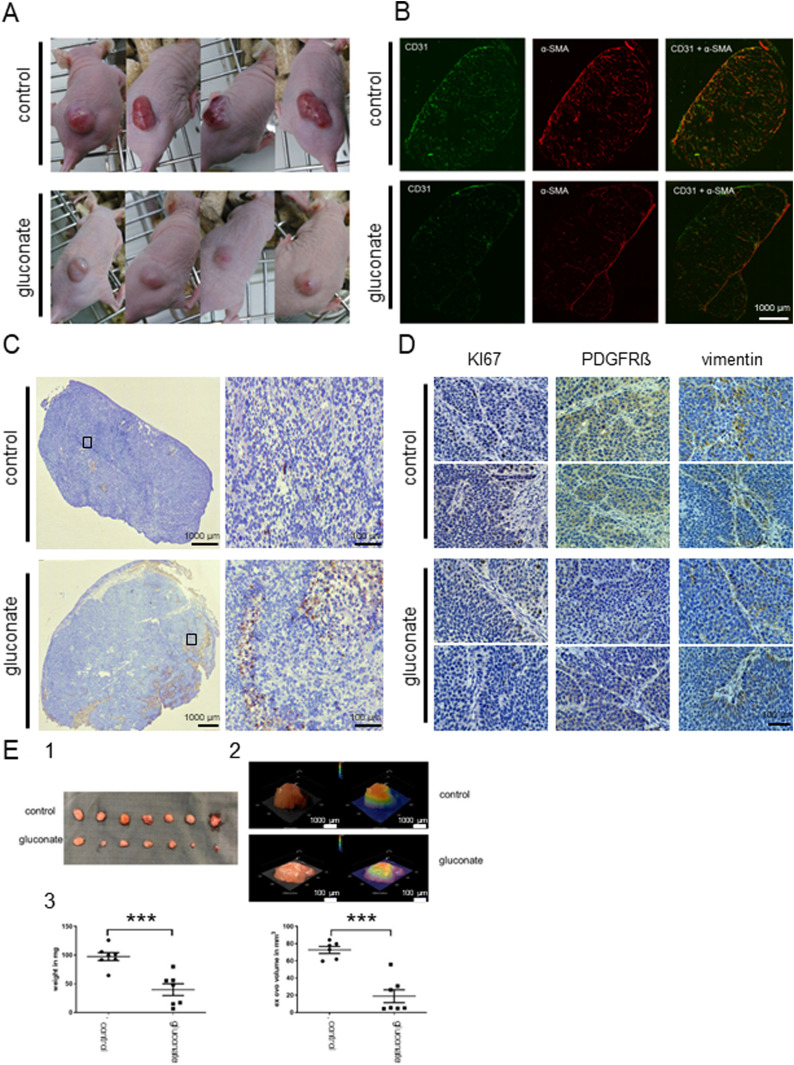
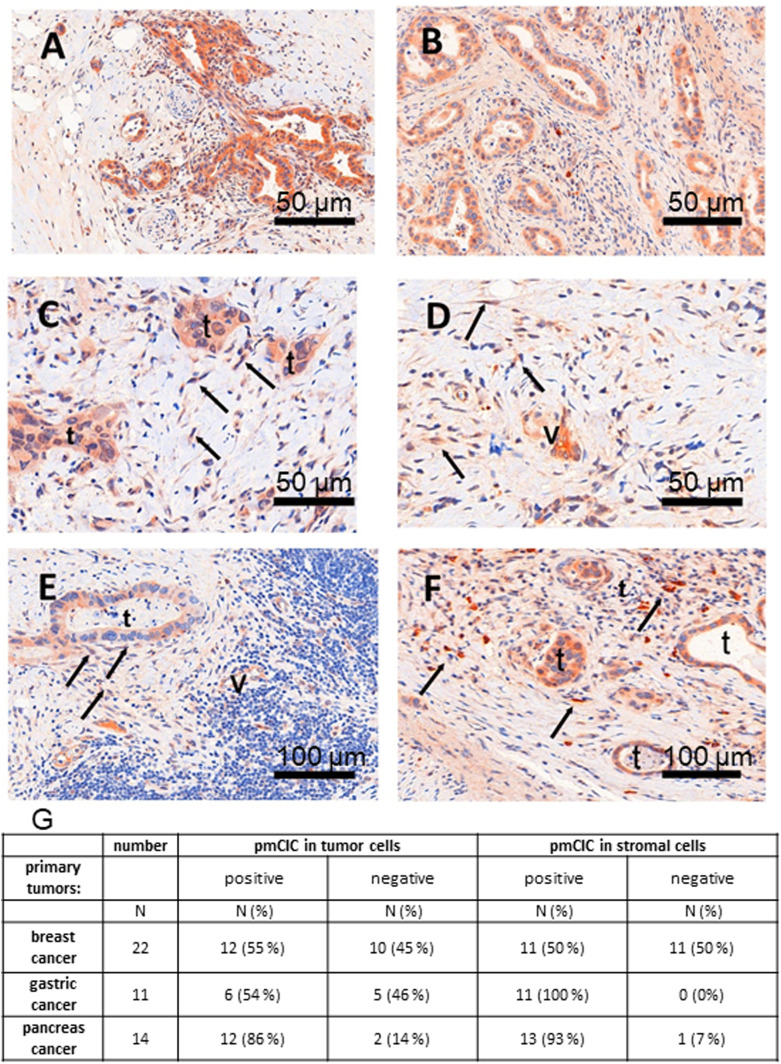
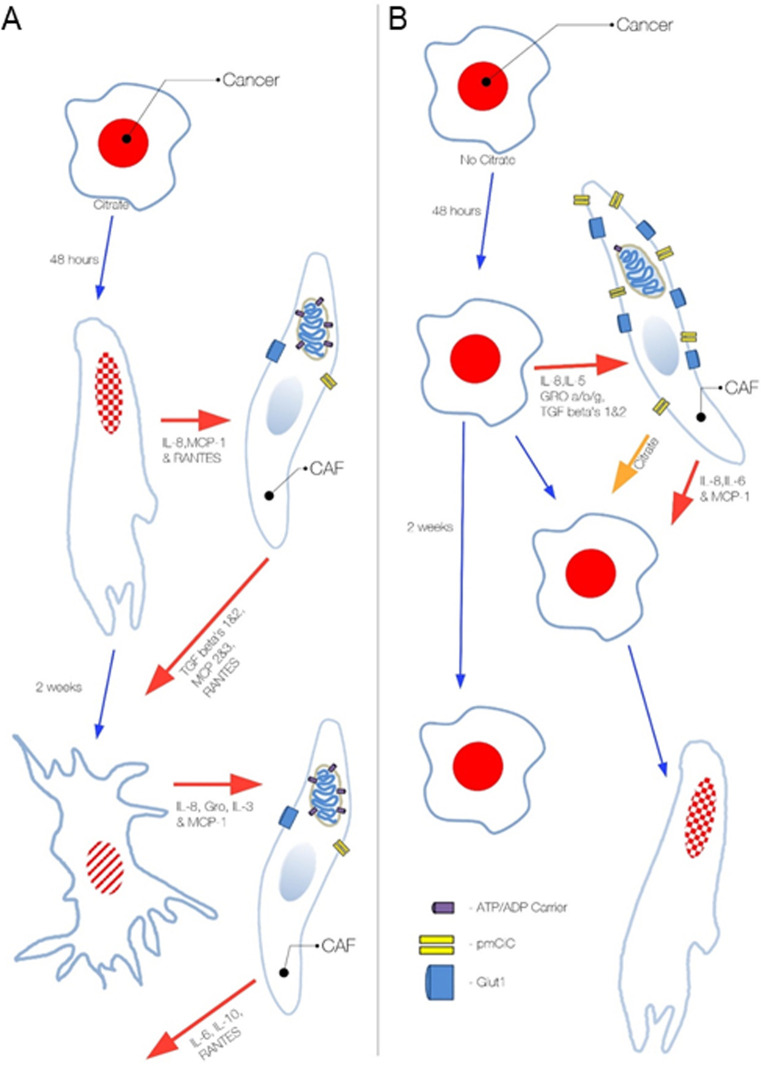
Citrate is important for lipid synthesis and epigenetic regulation in addition to ATP production. We have previously reported that cancer cells import extracellular citrate via the pmCiC transporter to support their metabolism. Here, we show for the first time that citrate is supplied to cancer by cancer-associated stroma (CAS) and also that citrate synthesis and release is one of the latter's major metabolic tasks. Citrate release from CAS is controlled by cancer cells through cross-cellular communication. The availability of citrate from CAS regulated the cytokine profile, metabolism and features of cellular invasion. Moreover, citrate released by CAS is involved in inducing cancer progression especially enhancing invasiveness and organ colonisation. In line with the in vitro observations, we show that depriving cancer cells of citrate using gluconate, a specific inhibitor of pmCiC, significantly reduced the growth and metastatic spread of human pancreatic cancer cells in vivo and muted stromal activation and angiogenesis. We conclude that citrate is supplied to tumour cells by CAS and citrate uptake plays a significant role in cancer metastatic progression.


Conflict of interest statement

ME Mycielska and EK Geissler are inventors on the Patent Application no. EP15767532.3 and US2020/408741 (status patent pending) and US2017/0241981 (patent issued) “The plasma membrane citrate transporter for use in the diagnosis and treatment of cancer” owned by the University Hospital Regensburg. No potential conflicts of interest are disclosed by the other authors.

Figures

Figure S1.
Figure S1.. Cancer-associated fibroblasts release citrate.
Metabolomic analysis of supernatants collected from primary cultures of human skin fibroblasts after 72 h incubation in conditioned media from cancer cells or bottle (blank) media (n = 6 per group; Fig S3A). Reference media show basal level of metabolites in the bottle media (Ref media blank) and conditioned media from PC-3M cells (Ref. media PC-3M; n = 2 per group).
Figure S2.
Figure S2.. Statistical analysis of metabolites released by control fibroblasts and cancer-associated fibroblasts.
Mann–Whitney U tests showed a total of 27 significantly different metabolites with P < 0.05 after Bonferroni correction. The PLS-DA yielded highly significant clustering of the respective groups of fibroblasts grown in media which was conditioned with cancer cells or non-conditioned medium. R2X was calculated to be 0.441, 0.877, 0.919, 0.940, and 0.953. R2Y was calculated to be 0.905, 0.994, 0.999, 0.999, and 1.000. The values given here are listed from first to fifth predictive component for R2X and R2Y, respectively. Q2Y was calculated to be 0.828, 0.979, 0.991, 0.992, and 0.993 (again from first to fifth predictive component), whereas the RMSEE is estimated to be 0.0129. The results were seven times cross-validated and permutation tests were run (i = 2,000). The permutation tests resulted in pR2Y and pQ2Y of 0.0025. As for the VIPs (variables of importance in projection), above the selection threshold (VipScore > 1): 37 metabolites fit this criterion.
Figure S3.
Figure S3.. Experimental procedure scheme.
Diagram showing the way in which conditioned media were obtained. (A, B, C) Cancer cells were grown in either (A) normal growth media and then left for conditioning, or before conditioning, the PC-3M cells were incubated in dialyzed serum (B) without or (C) with extracellular citrate for 48 h. The following treatment was the same for all the conditions. Cancer cells were conditioned for 48 h. The collected media were filtered and supplemented with 2 mM glutamine and 2 g/l glucose at every step of the procedure to allow for unlimited intracellular citrate synthesis. Fibroblasts were incubated in similarly prepared media for 72 h.
Figure 1.
Figure 1.. Cancer-associated fibroblasts release citrate through pmCiC.
(A) Seahorse analysis of the metabolic characteristics and the energy map of fibroblasts grown in media used for conditioning, CM PC-3M−cit or CM PC-3M+cit (n = 4). The graphs show differences between normal fibroblasts (white), fibroblasts transformed with CM PC-3M−cit (grey), and CM PC-3M+cit (black). (B) The graph depicts citrate levels in the media from fibroblasts stimulated with CM PC-3M−cit (white) and CM PC-3M+cit (black). (C) pmCiC expression in fibroblasts and different hepatic stellate cell lines grown in regular medium, low serum medium or transformed with conditioned media from PC-3M cells or L3.6pl cells. (D) The graphs show selected cytokines (n = 5) released from PC-3M cancer cells preincubated without or with extracellular citrate for 48 h (CM PC-3M−cit CM PC-3M+cit, respectively; upper panel) and human primary skin fibroblasts transformed by CM PC-3M−cit CM PC-3M+cit (CM F-PC−cit and CM F-PC+cit, respectively; lower panel).
Figure S4.
Figure S4.. Cancer cells release different set of cytokines depending on the extracellular citrate availability.
(A, B, C, D, E, F, G, H) The graphs show selected cytokines released from cancer cells grown for 48 h (A, B) or 2 wk (E, D) under the following conditions (A) and preincubated without (CM PC-3M−cit) or (B) with extracellular citrate (CM PC-3M+cit) and fibroblasts (C, D and G, H) transformed by the differentially treated cancer cells (C, G) CM F-PC−cit and (D) CM F-PC+cit (F, H) over 48 h or 2 wk, respectively. (A, B, D, E) The values of cytokines released by fibroblasts were obtained by subtracting the values of cytokines measured in conditioned media from cancer cells (A, B and E, D) from the values measured in the media from fibroblasts.
Figure 2.
Figure 2.. 48 h of preincubation with extracellular citrate induces intracellular metabolite changes.
(A) Heat map of the intracellular content of amino acids of PC-3M cells grown for 48 h under control conditions or in the media supplemented with 200 μM citrate. Each row represents a separate repeat. (B) Mitotoxicity assay of different types of cells (PC-3M, PNT2-C2, human skin fibroblasts and fibroblasts transformed with conditioned media from PC-3M cells preincubated under control conditions, with extracellular citrate, with gluconate and citrate or with gluconate alone; Fig S7, n ≥ 3) showed that when applied alone at high concentration, gluconate has a cytotoxic effect on cancer cells. (C) Trp quenching at different concentrations of citrate and gluconate. Inset: Kd values determined from the Trp quenching (red) and fluorescence change amplitudes (blue) in titrations of citrate in the presence of different concentrations of gluconate. Right panel: Possible inhibition of citrate binding by gluconate binding to a second binding site predicted by a homology model (Mycielska et al, 2018). Spheres indicate Trp quenching radii by sulfur.
Figure S5.
Figure S5.. List of metabolites measured with the AbsoluteIDQ p180 Kit GAC.
Figure S6.
Figure S6.. Extracellular citrate uptake induces changes of the levels of intracellular metabolites.
Heat map of ratios and total amounts of different metabolic groups (Fig S5) of PC-3M cancer cells grown for 48 h under control conditions or in the media supplemented with 200 μM citrate. Each row represents a separate repeat (n = 6).
Figure S7.
Figure S7.. Statistical analysis of the intracellular metabolite levels.
(A) PLS-DA analysis of pC-3M cancer cells incubated for 48 h under different experimental conditions (control, 200 mM citrate, 200 mM citrate + 150 and 150 mM gluconate). R2Y (cumulative) was calculated to be 0.857. The values given here are not listed from first to fifth predictive component for R2X and R2Y as they never reached near 1.0. Q2Y was calculated to be 0.199, whereas the RMSEE is estimated to be 0.189. This low Q2Y value indicates small differences between the groups. These results were seven times cross-validated and permutation tests were run (i = 2,000). The permutation tests resulted in pR2Y and pQ2Y of 0.012 and 0.004, respectively. (B) For the VIPs (variables of importance in projection) above the selection threshold (VipScore > 1): 80 metabolites fit this criterion.
Figure S8.
Figure S8.. Study of mitotoxic effects of citrate and gluconate on cancer cells and cancer-associated fibroblasts.
(A, B, C) Mitotoxicity assay of different types of cells (cancer (A) versus benign PNT-2C2 cells and untreated fibroblasts (B and C, respectively)) in the presence of ascending concentrations of gluconate, gluconate in the presence of 200 mM citrate and citrate. (D, E, F, G) Fibroblasts transformed with the conditioned media from control (D), preincubated with citrate (E), gluconate (F) and citrate and gluconate (G) cancer cells. The results show mitotoxic activity of the studied compounds by measuring ATP synthesis and cytotoxicity. CCCP stands for carbonyl cyanide m-chlorophenyl hydrazine used as control toxicity test.
Figure S9.
Figure S9.. Trp quenching at different concentrations of citrate.
(A) Titration with citrate and gluconate in presence of 70 mM citrate (blue) is shown as raw data and deconvoluted spectra. (B) Changes in relative fluorescence and similar changes depicted in a Benesi–Hildebrand (double reciprocal) plot of citrate data are shown. Similar to the Lineweaver–Burk linearization method, only data that satisfy a 1:1 binding model with a constant Kd result in a linear dependency—the data clearly deviate from this model.
Figure 3.
Figure 3.. Citrate in the extracellular space induces metabolic changes and contributes to the metastatic status of cancer cells.
(A) PC-3M cells were preincubated with or without extracellular citrate for either 48 h (left panel) or 2 wk (right panel). Western blots show typical expression of metabolic transporters and EMT/mesenchymal–epithelial transition related proteins (n ≥ 3). The numbers under the Western blots show average normalised values obtained using densitometric analysis; stars depict statistical significance. (B) The graphs (left) represent the number of single/ameboid shaped cells in cancer cells preincubated with or without extracellular citrate for 48 h. The graphs on the right hand side show the differences in the number of cells with invadopodia between PC-3M cells grown for 2 wk with or without extracellular citrate. For each condition at least 20 different areas from three repeats were analysed. Pictures were taken with the scanning electron microscope. (C) Measurement of phosphatidylcholine (PC), phopspahtidylinositol (PI), phosphatdylethanolamine (PE), and sphingomyelin (SM) in cells under experimental conditions with or without extracellular citrate for 48 h (n = 4). (D) Western blot analysis of the expression of metabolic transporters and EMT/mesenchymal–epithelial transition–related proteins of PC-3M cells grown for 48 h in the media from fibroblasts transformed with the conditioned media from PC-3M cells preincubated for 48 h with or without extracellular citrate (CM F-PC−cit and CM F-PC+cit, respectively; right panel; n = 3). The numbers under the Western blots show average normalised values obtained using densitometric analysis; stars depict statistical significance.
Figure S10.
Figure S10.. Extracellular citrate induces changes in cancer cells morphology.
(A) Changes in cancer cell morphology influenced by extracellular citrate (A) 48 h of preincubation with extracellular citrate resulted in spindle shape cells with a clear lamelipodium with many relatively short filopodia. There were many single (white arrows) and ameboid shaped (red arrows) cells under conditions with extracellular citrate. (B) On the other hand, long-term preincubation of cancer cells with citrate was consistent with the colonizing phase in which cells are rounder with long invadopodia reaching either ECM (white arrowheads) or each other (black arrowheads). Cells in control conditions (-citrate) showed unchanged morphology regardless of the incubation time. Their plasma membrane seemed to have decreased fluidity with a very small number of filopodia.
Figure S11.
Figure S11.. Conditioned media from cancer cells do not induce significant changes in cancer markers.
(A) Western blot analysis of the expression of metabolic transporters and EMT/mesenchymal–epithelial transition–related proteins of PC-3M cells grown for 48 h in conditioned media from PC-3M cells preincubated with or without extracellular citrate (CM PC-3M−cit and CM PC-3M+cit; n = 3). (B) Western blot analysis of the αSMA expression in fibroblasts grown under standard conditions with added 200 mM citrate or 150 mM gluconate for 48 h.
Figure 4.
Figure 4.. Blocking of citrate uptake by cancer cells decreases metastasis rate in vivo.
Human pancreatic cancer L3.6pl cells were injected into the lower spleen pole of immunodeficient mice. 15 min after tumour cell injection, the spleen was removed. Animals were daily intraperitoneally injected with sodium gluconate (500 mg/kg/d), respectively, NaCl. After 24 d, mice were euthanized, and livers and laparotomy wounds were assessed. (A) Liver metastases were evaluated by a macroscopic score (0 = no tumour load; 1 = small singular tumours; 2 = large singular tumours; 3 = confluent tumours in less than half of liver; 4 = confluent tumours in more than half of the liver; 5 = tumours in all liver segments). Hepatic tumour load was significantly decreased (P = 0.046; n = 13 mice per group, one-tailed unpaired t test) in the treatment group (500 mg/kg/d sodium gluconate) compared with control group (NaCl). (B) Pictures showing differences in the αSMA staining pattern in metastasis in mouse livers treated with gluconate versus control. (C) Liver metastasis were stained with the anti-fibroblast activating protein (FAP) antibody. Red arrows show stained area in the stroma consistent with cancer-associated cells, whereas blue arrows depict immune cells expressing FAP. Enlarged pictures from the control group (on the right) show cells stained with anti-FAP antibody (in red) in the stroma (indicated with red arrows) and immune cells (blue arrows). (D) Graphs showing average number of immune cells per total number of cells in the studied area. For these measurements two border and two central areas were calculated per metastasis. For each experimental group, four different metastases were evaluated.
Figure 5.
Figure 5.. Gluconate treatment in vivo increases apoptosis, decreases angiogenesis, stromal transformation, proliferation and expression of PDGRβ and vimentin in cancerous tissues.
Human pancreatic cancer cells L3.6pl were injected subcutaneously in nude mice. Control mice were injected with saline and treated group with Na+-gluconate (as described before, Mycielska et al, 2018). (A) Pictures of mice showing qualitative differences between the cancerous growths in treated versus untreated animals. The photos cannot be used to compare tumour size. (B) Angiogenesis (CD31) and stromal transformation (αSMA) were also significantly decreased in the case of treated animals. (C) Staining of the sections of tumours (TUNEL) show increased apoptosis in the treated group. Moreover, apoptotic regions were mainly observed at the lower parts of the tissues. (D) Cancer cells proliferation in the tissues was decreased (Ki67), as well as PDGFRβ and vimentin expression. (E) The CAM assay was performed using L3.6pl cells. The cells were left to grow for 2 d then NaCl was used in the control group and Na+-gluconate in gluconate group for 5 d. (1) Tumour explants after daily treatment with NaCl (upper) or Na+-gluconate (lower). (2) Examples of tumour volume measurements with the 3D digital microscope (Keyence VHX-7000 microscope). (3) Graphs showing changes in the tumour weight and tumour volume of NaCl versus gluconate treated groups.
Figure 6.
Figure 6.. pmCiC is expressed in the stroma of human cancerous tissues.
(A, B) immunohistochemical staining of pmCIC showed strong expression in human pancreatic (A) and gastric cancer glands (B) (DAB—150 μm). (C, D) In close contact to infiltrating cancer glands, there is also a prominent expression in micro-vessels (v) but also in spindle cells (→) of the tumour microenvironment (TME) in both cancer types (C, D) (DAB, — 50 μm). The latter cell type of the TME could be identified by vimentin as tumour associated fibroblasts (data not shown). (E) Consecutive examination of lymph node metastasis (E) (DAB—50 μm) demonstrate a positive tumour gland but also expression in micro-vessels (v) and fibroblasts. (F) The same was true for a metastatic gastric cancer shown in figure (F) (DAB, — 50 μm). (G) A table showing the number/percentage of human tumour tissues expressing pmCiC in cancer cells and in cancer-associated stroma cells.
Figure S12.
Figure S12.. Diagram summarizing the influence of extracellular citrate on cancer progression.
Cancer cell status and activity depends on the presence of extracellular citrate supplied by cancer-associated cells. (A) In the presence of extracellular citrate cancer cells acquire first an activated EMT-like phenotype, whereas long-term presence of citrate results in the colonizing mesenchymal–epithelial transition–like phenotype. (B) Cancer cells deprived of extracellular citrate release high levels of stroma transforming cytokines and force CASs to release citrate and other necessary elements. Citrate and cytokines supplied by cancer-associated fibroblasts support the acquisition of a metastatic phenotype by cancer cells. Without extracellular citrate the status of cancer cells remains unchanged. The PC-3M cells have red nuclei and the stippling that indicate EMT, whereas the irregular shape and cross lines indicate mesenchymal–epithelial transition and metastatic colonisation.

Similar articles

Cited by

References

    1. An YJ, Cho HR, Kim TM, Keam B, Kim JW, Wen H, Park CK, Lee SH, Im SA, Kim JE, et al. (2015) An NMR metabolomics approach for the diagnosis of leptomeningeal carcinomatosis in lung adenocarcinoma cancer patients. Int J Cancer 136: 162–171. 10.1002/ijc.28949 - DOI - PubMed
    1. Argyle D, Kitamura T (2018) Targeting macrophage-recruiting chemokines as a novel therapeutic strategy to prevent the progression of solid tumors. Front Immunol 9: 2629. 10.3389/fimmu.2018.02629 - DOI - PMC - PubMed
    1. Arnold JN, Magiera L, Kraman M, Fearon DT (2014) Tumoral immune suppression by macrophages expressing fibroblast activation protein-alpha and heme oxygenase-1. Cancer Immunol Res 2: 121–126. 10.1158/2326-6066.cir-13-0150 - DOI - PMC - PubMed
    1. Ashbrook MJ, McDonough KL, Pituch JJ, Christopherson PL, Cornell TT, Selewski DT, Shanley TP, Blatt NB (2015) Citrate modulates lipopolysaccharide-induced monocyte inflammatory responses. Clin Exp Immunol 180: 520–530. 10.1111/cei.12591 - DOI - PMC - PubMed
    1. Azenshtein E, Luboshits G, Shina S, Neumark E, Shahbazian D, Weil M, Wigler N, Keydar I, Ben-Baruch A (2002) The CC chemokine RANTES in breast carcinoma progression: Regulation of expression and potential mechanisms of promalignant activity. Cancer Res 62: 1093–1102. - PubMed

Publication types

MeSH terms

LinkOut - more resources