. 2021 Mar 23;4(6):e202001004.
doi: 10.26508/lsa.202001004. Print 2021 Jun.

CellMixS: quantifying and visualizing batch effects in single-cell RNA-seq data

Affiliations

CellMixS: quantifying and visualizing batch effects in single-cell RNA-seq data

Almut Lütge et al. Life Sci Alliance. .

Abstract

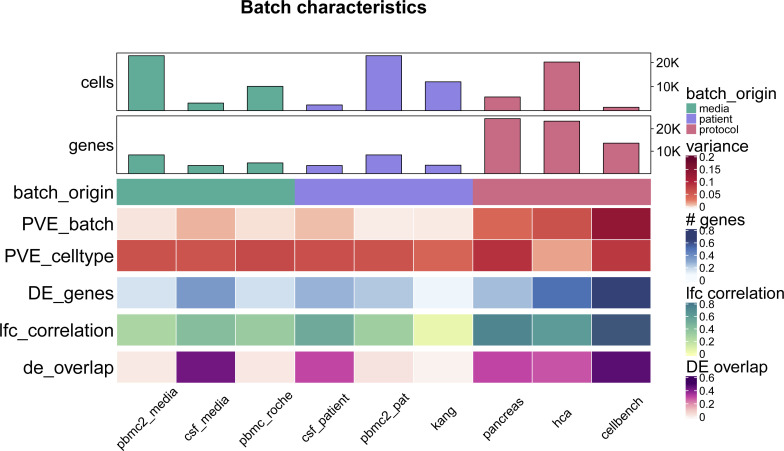
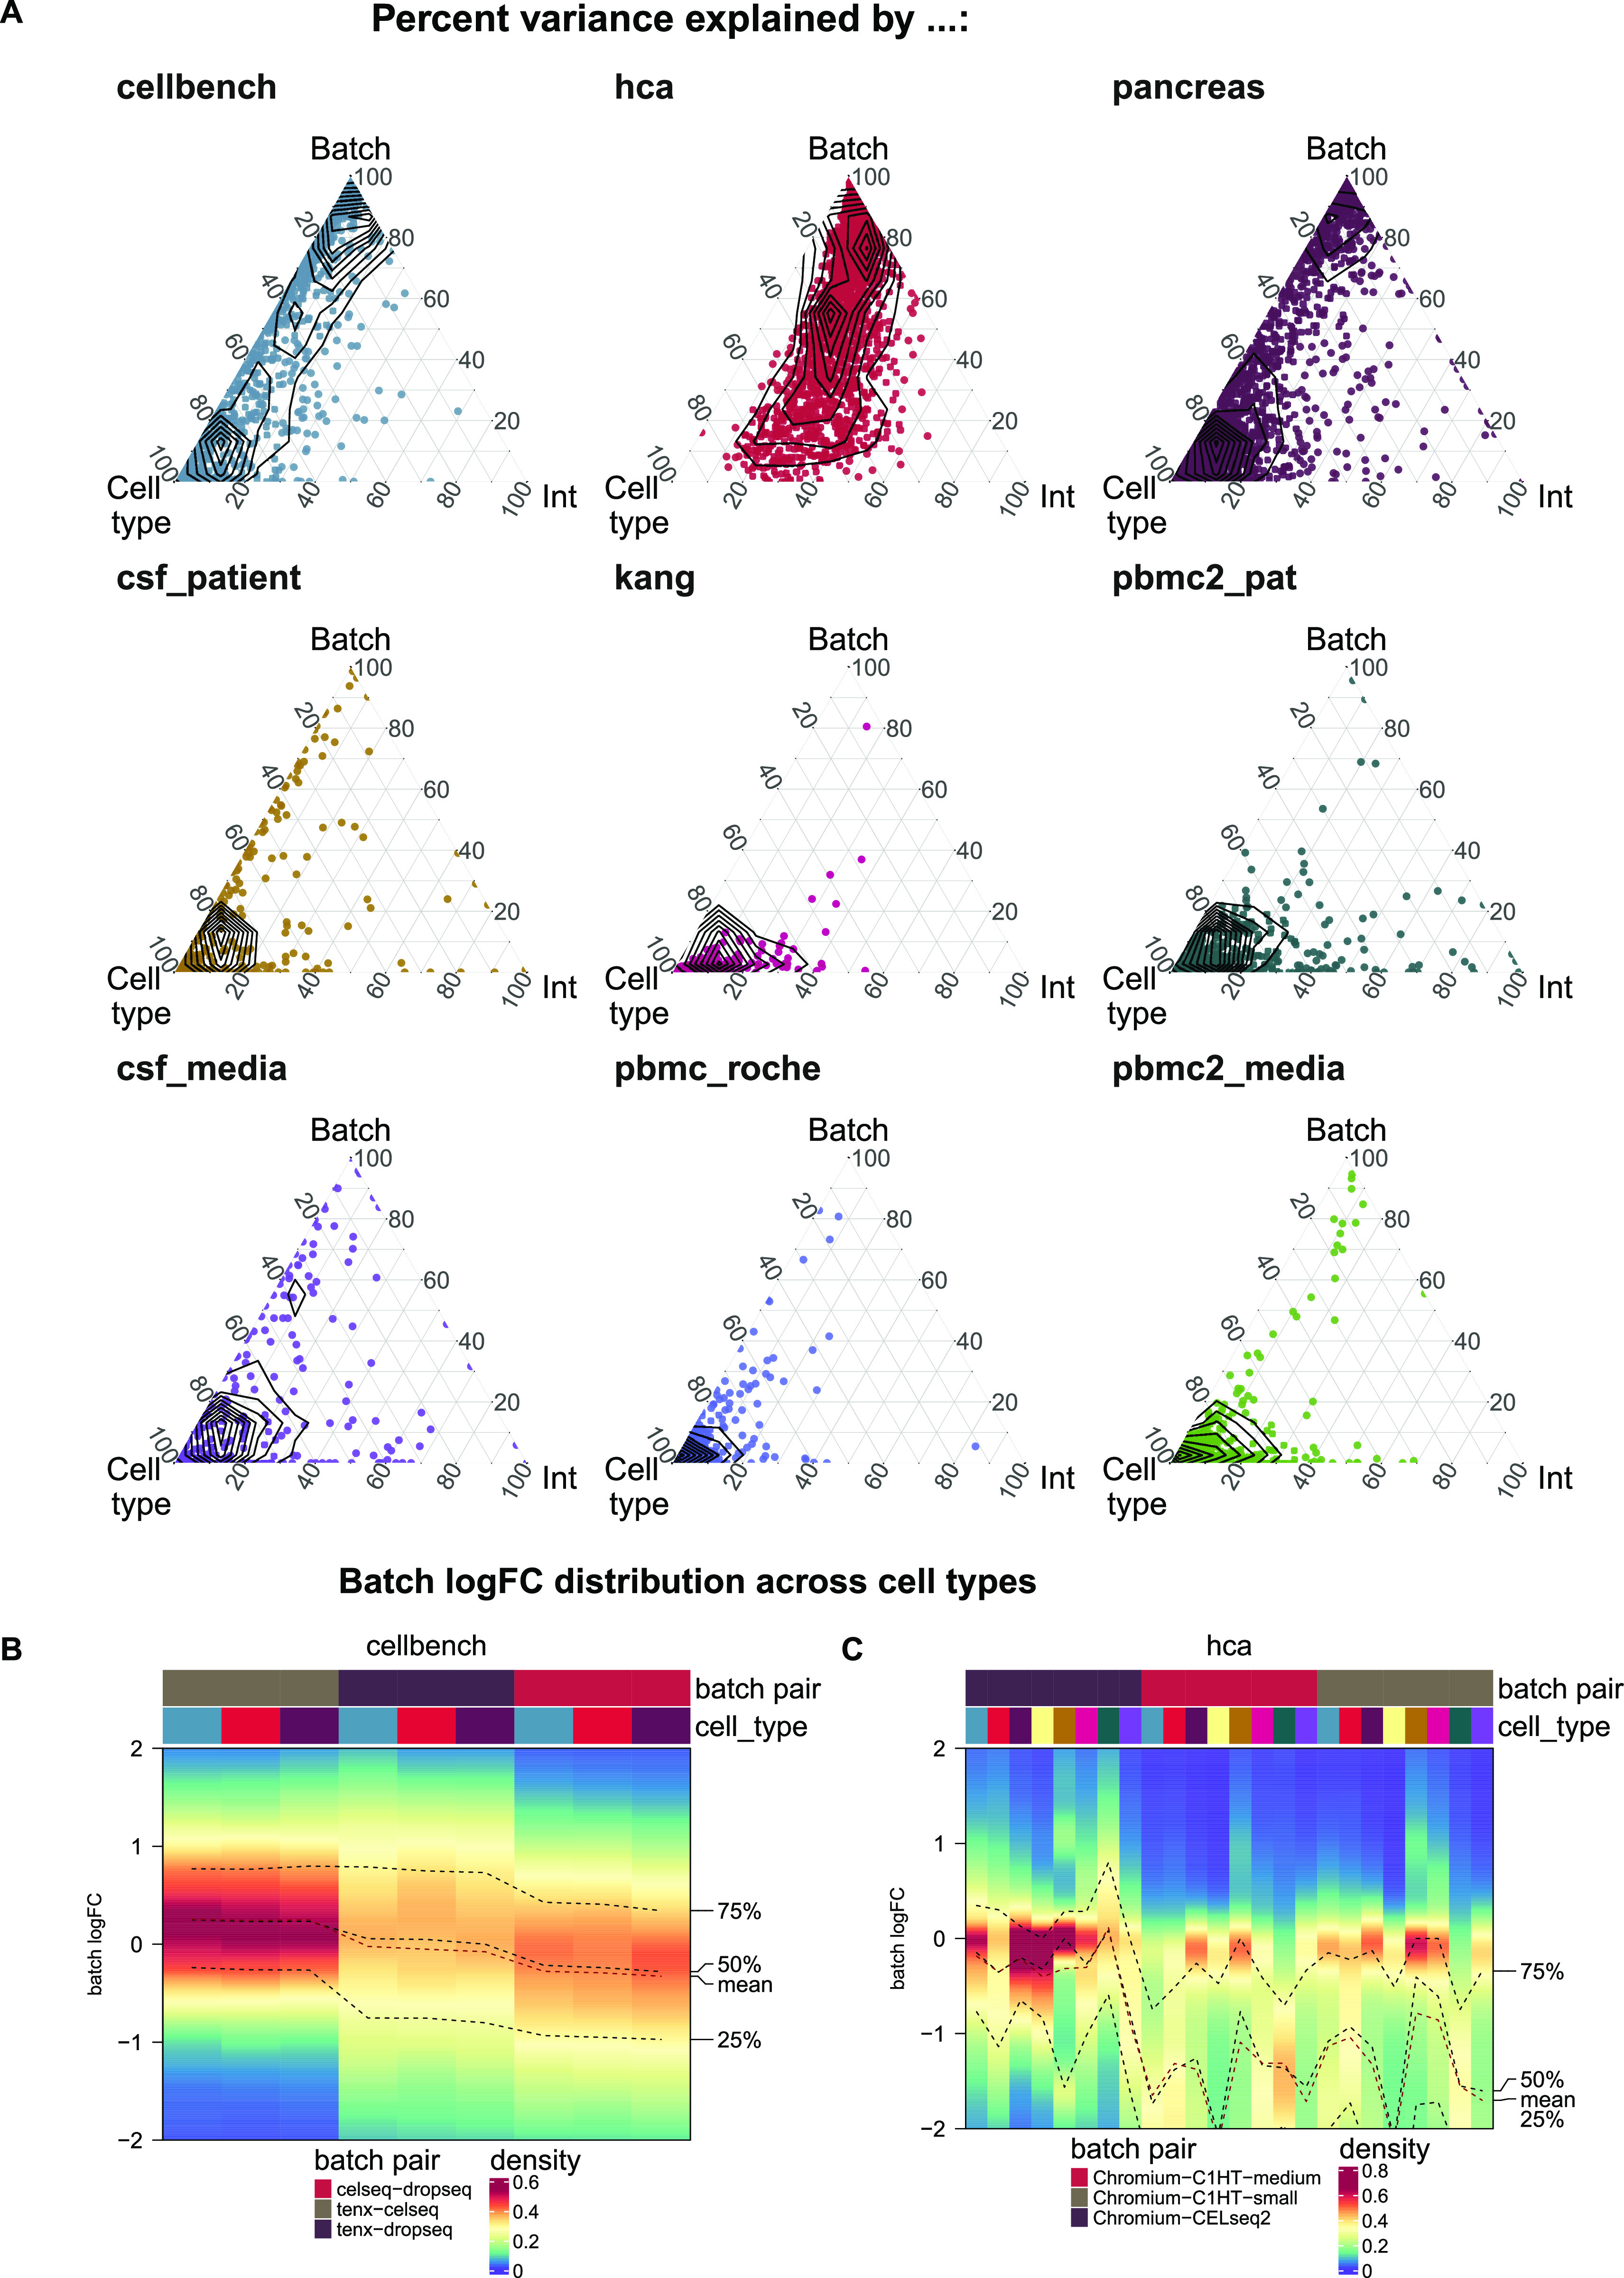
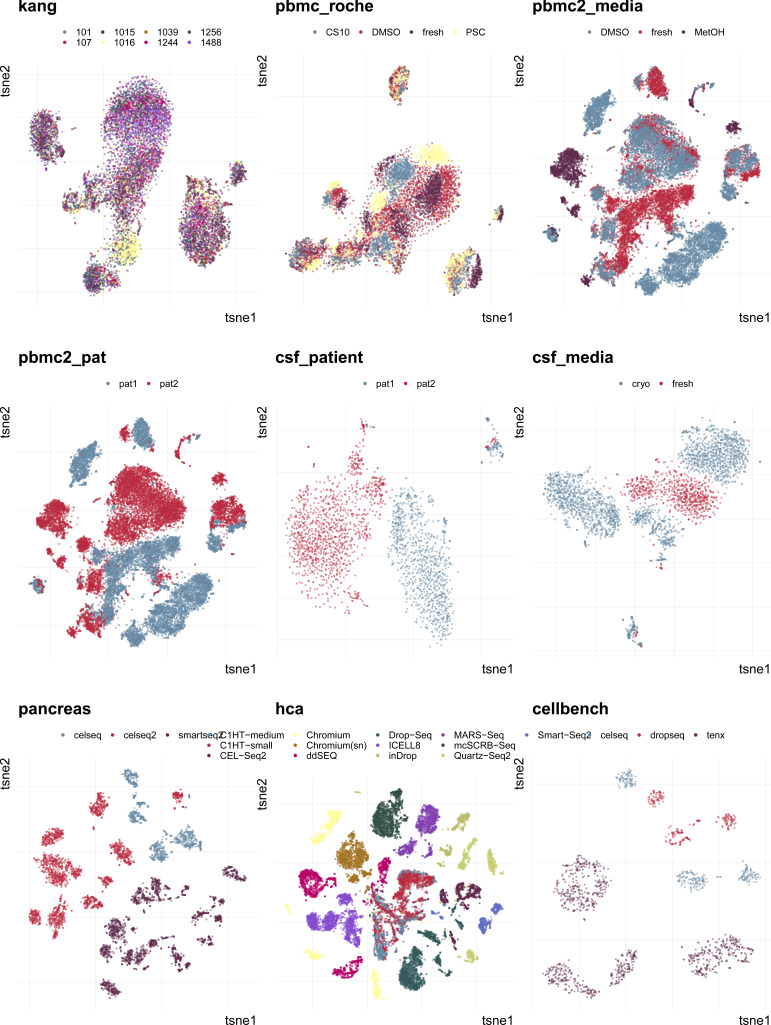
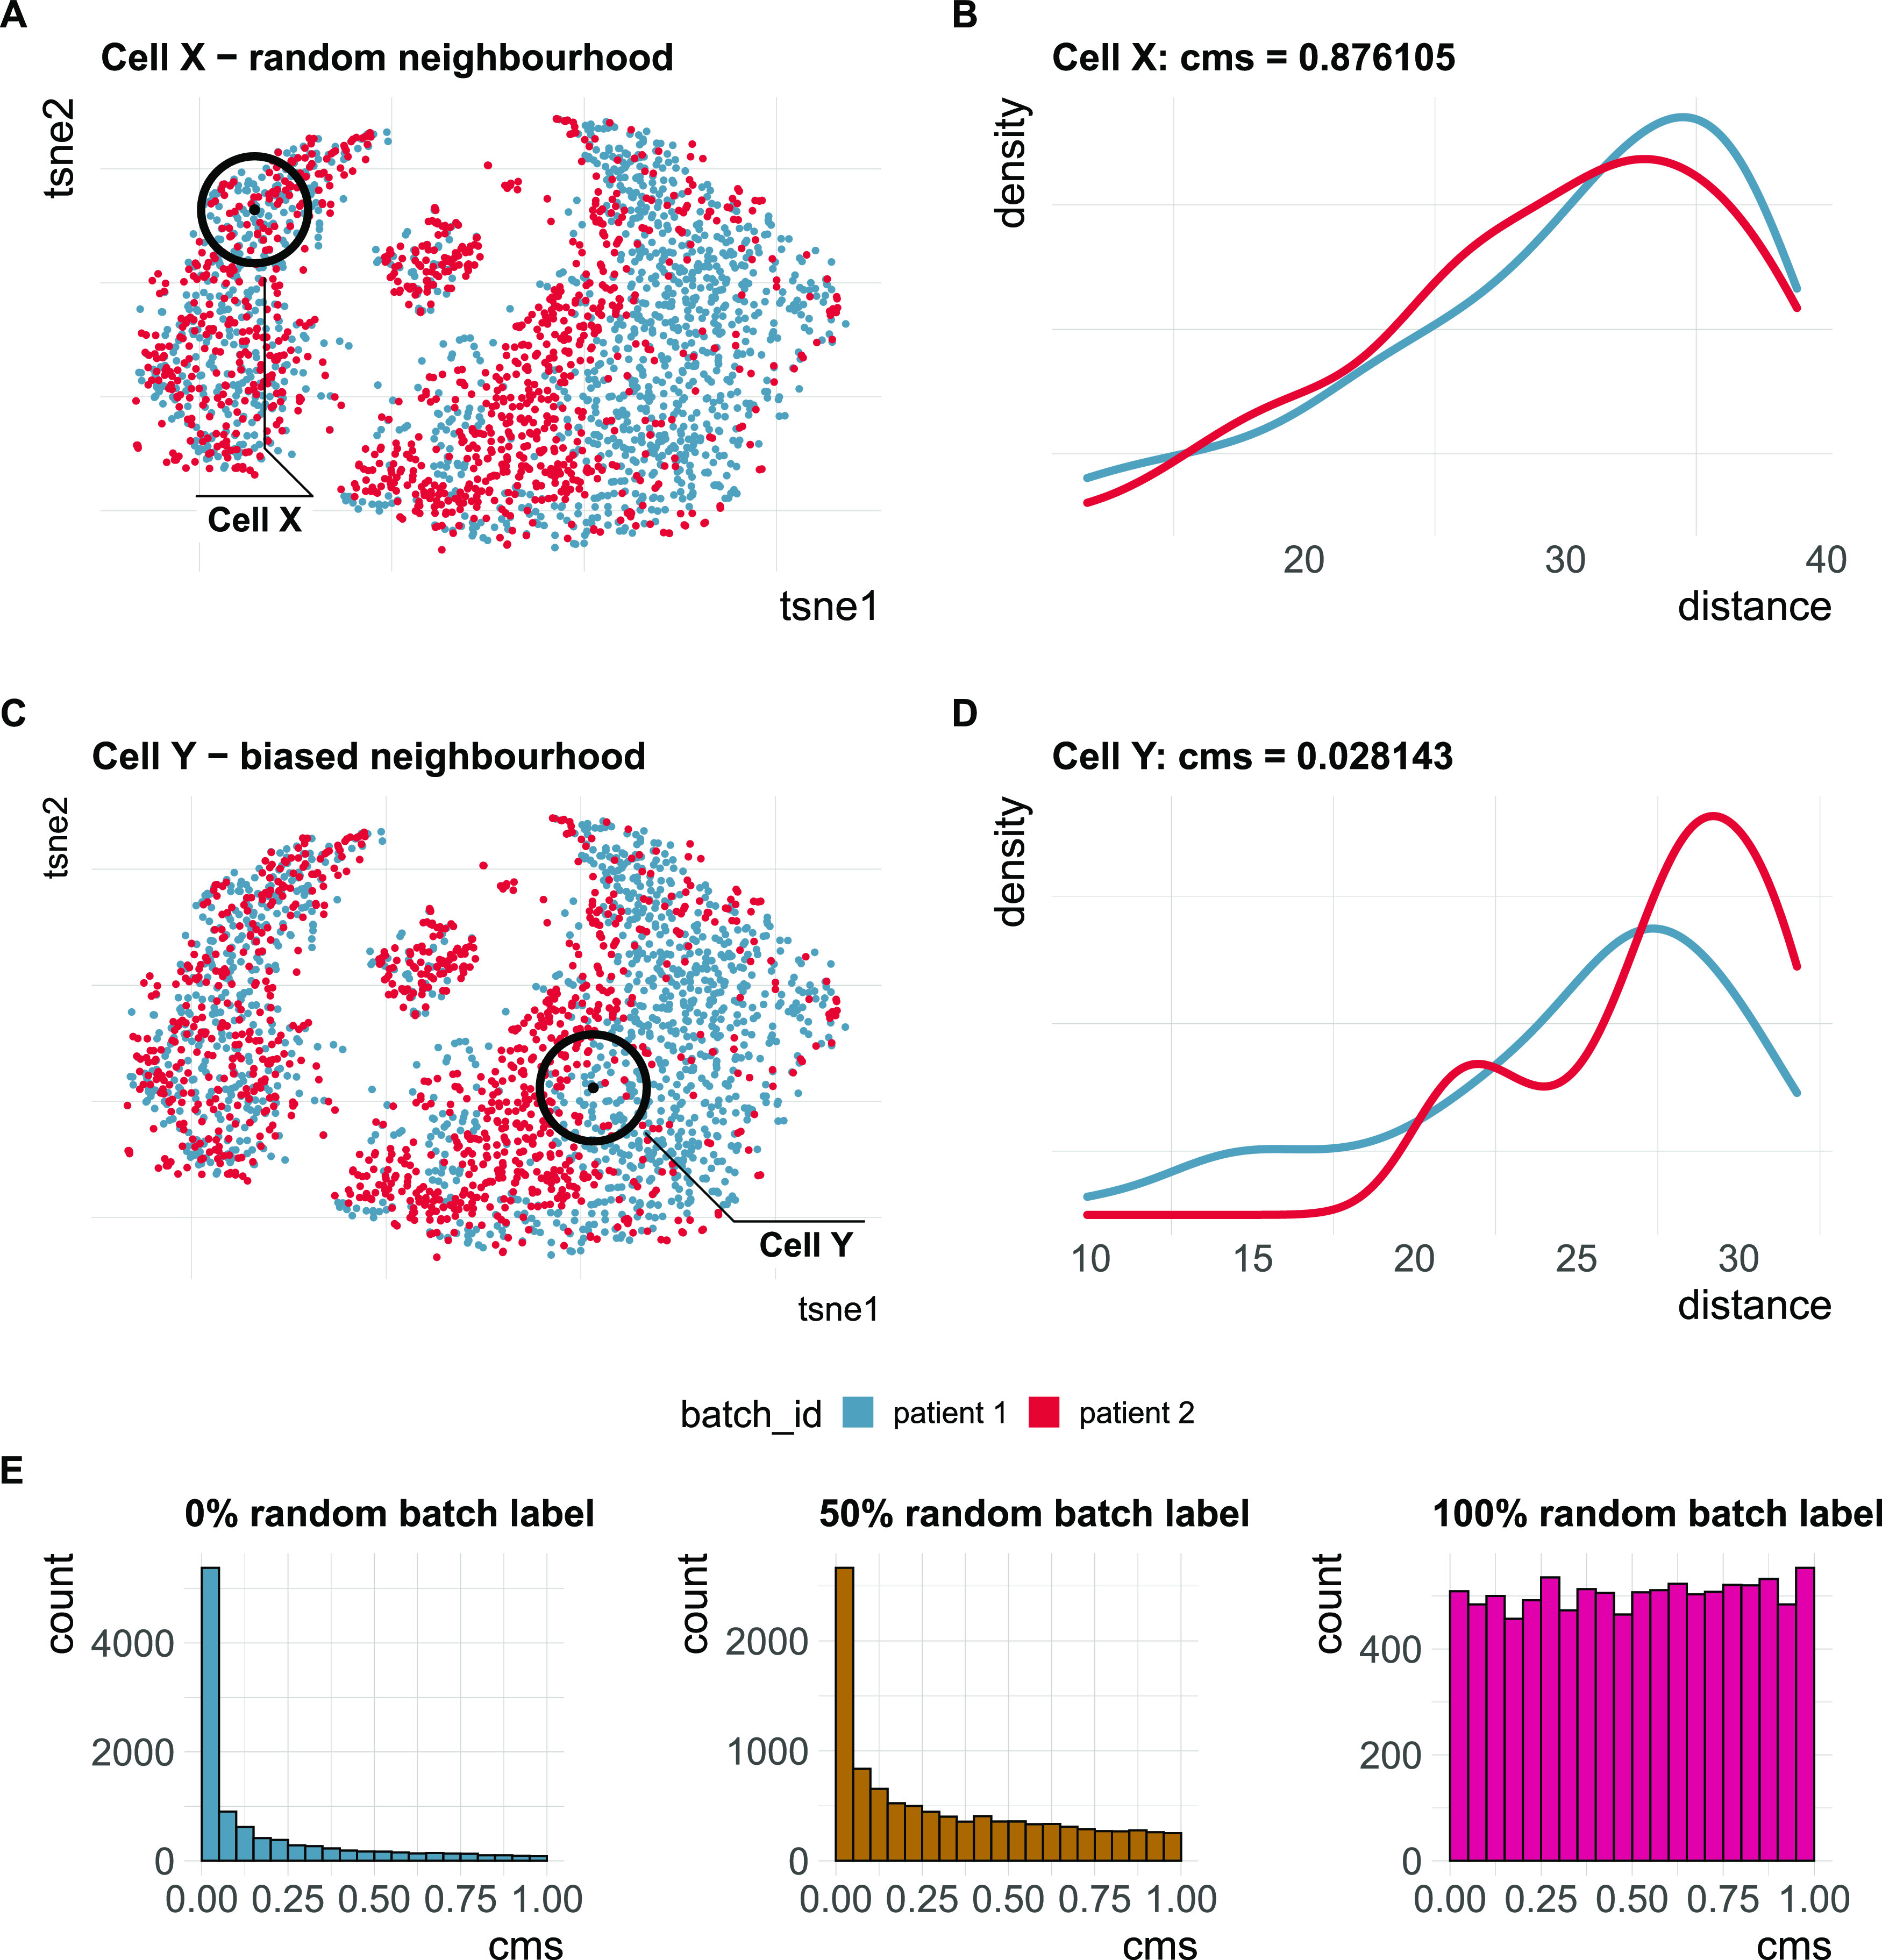
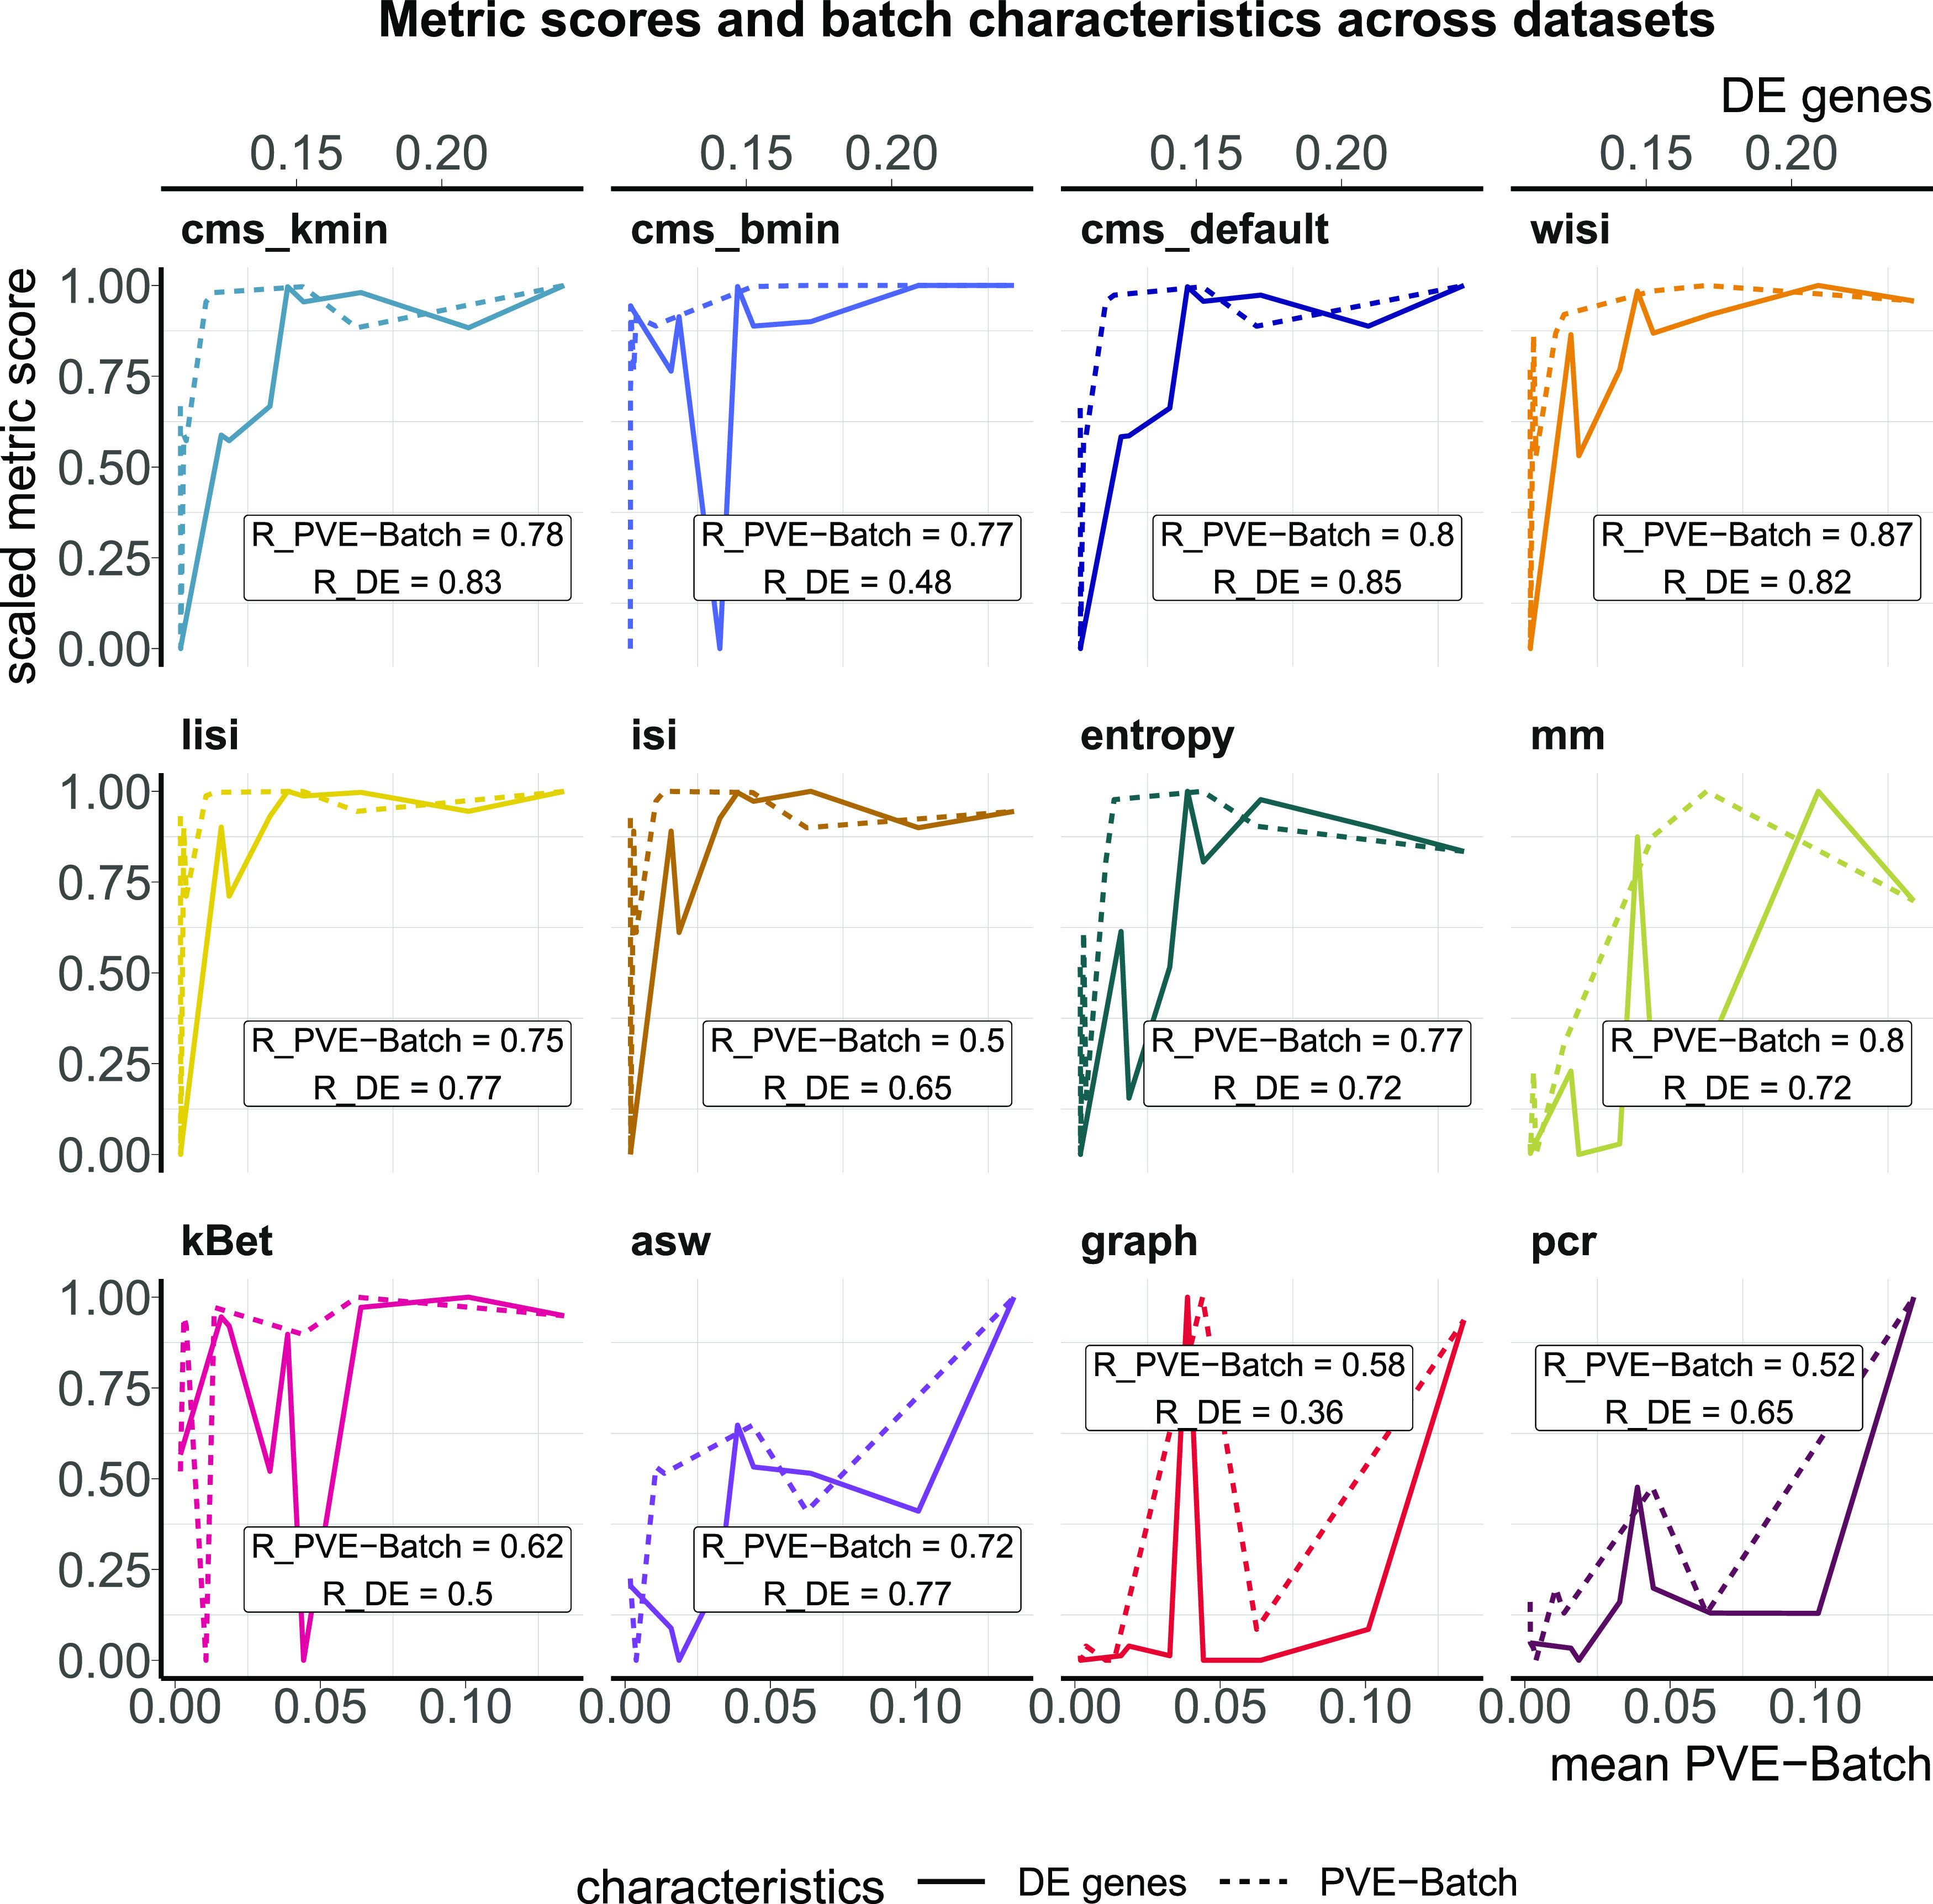
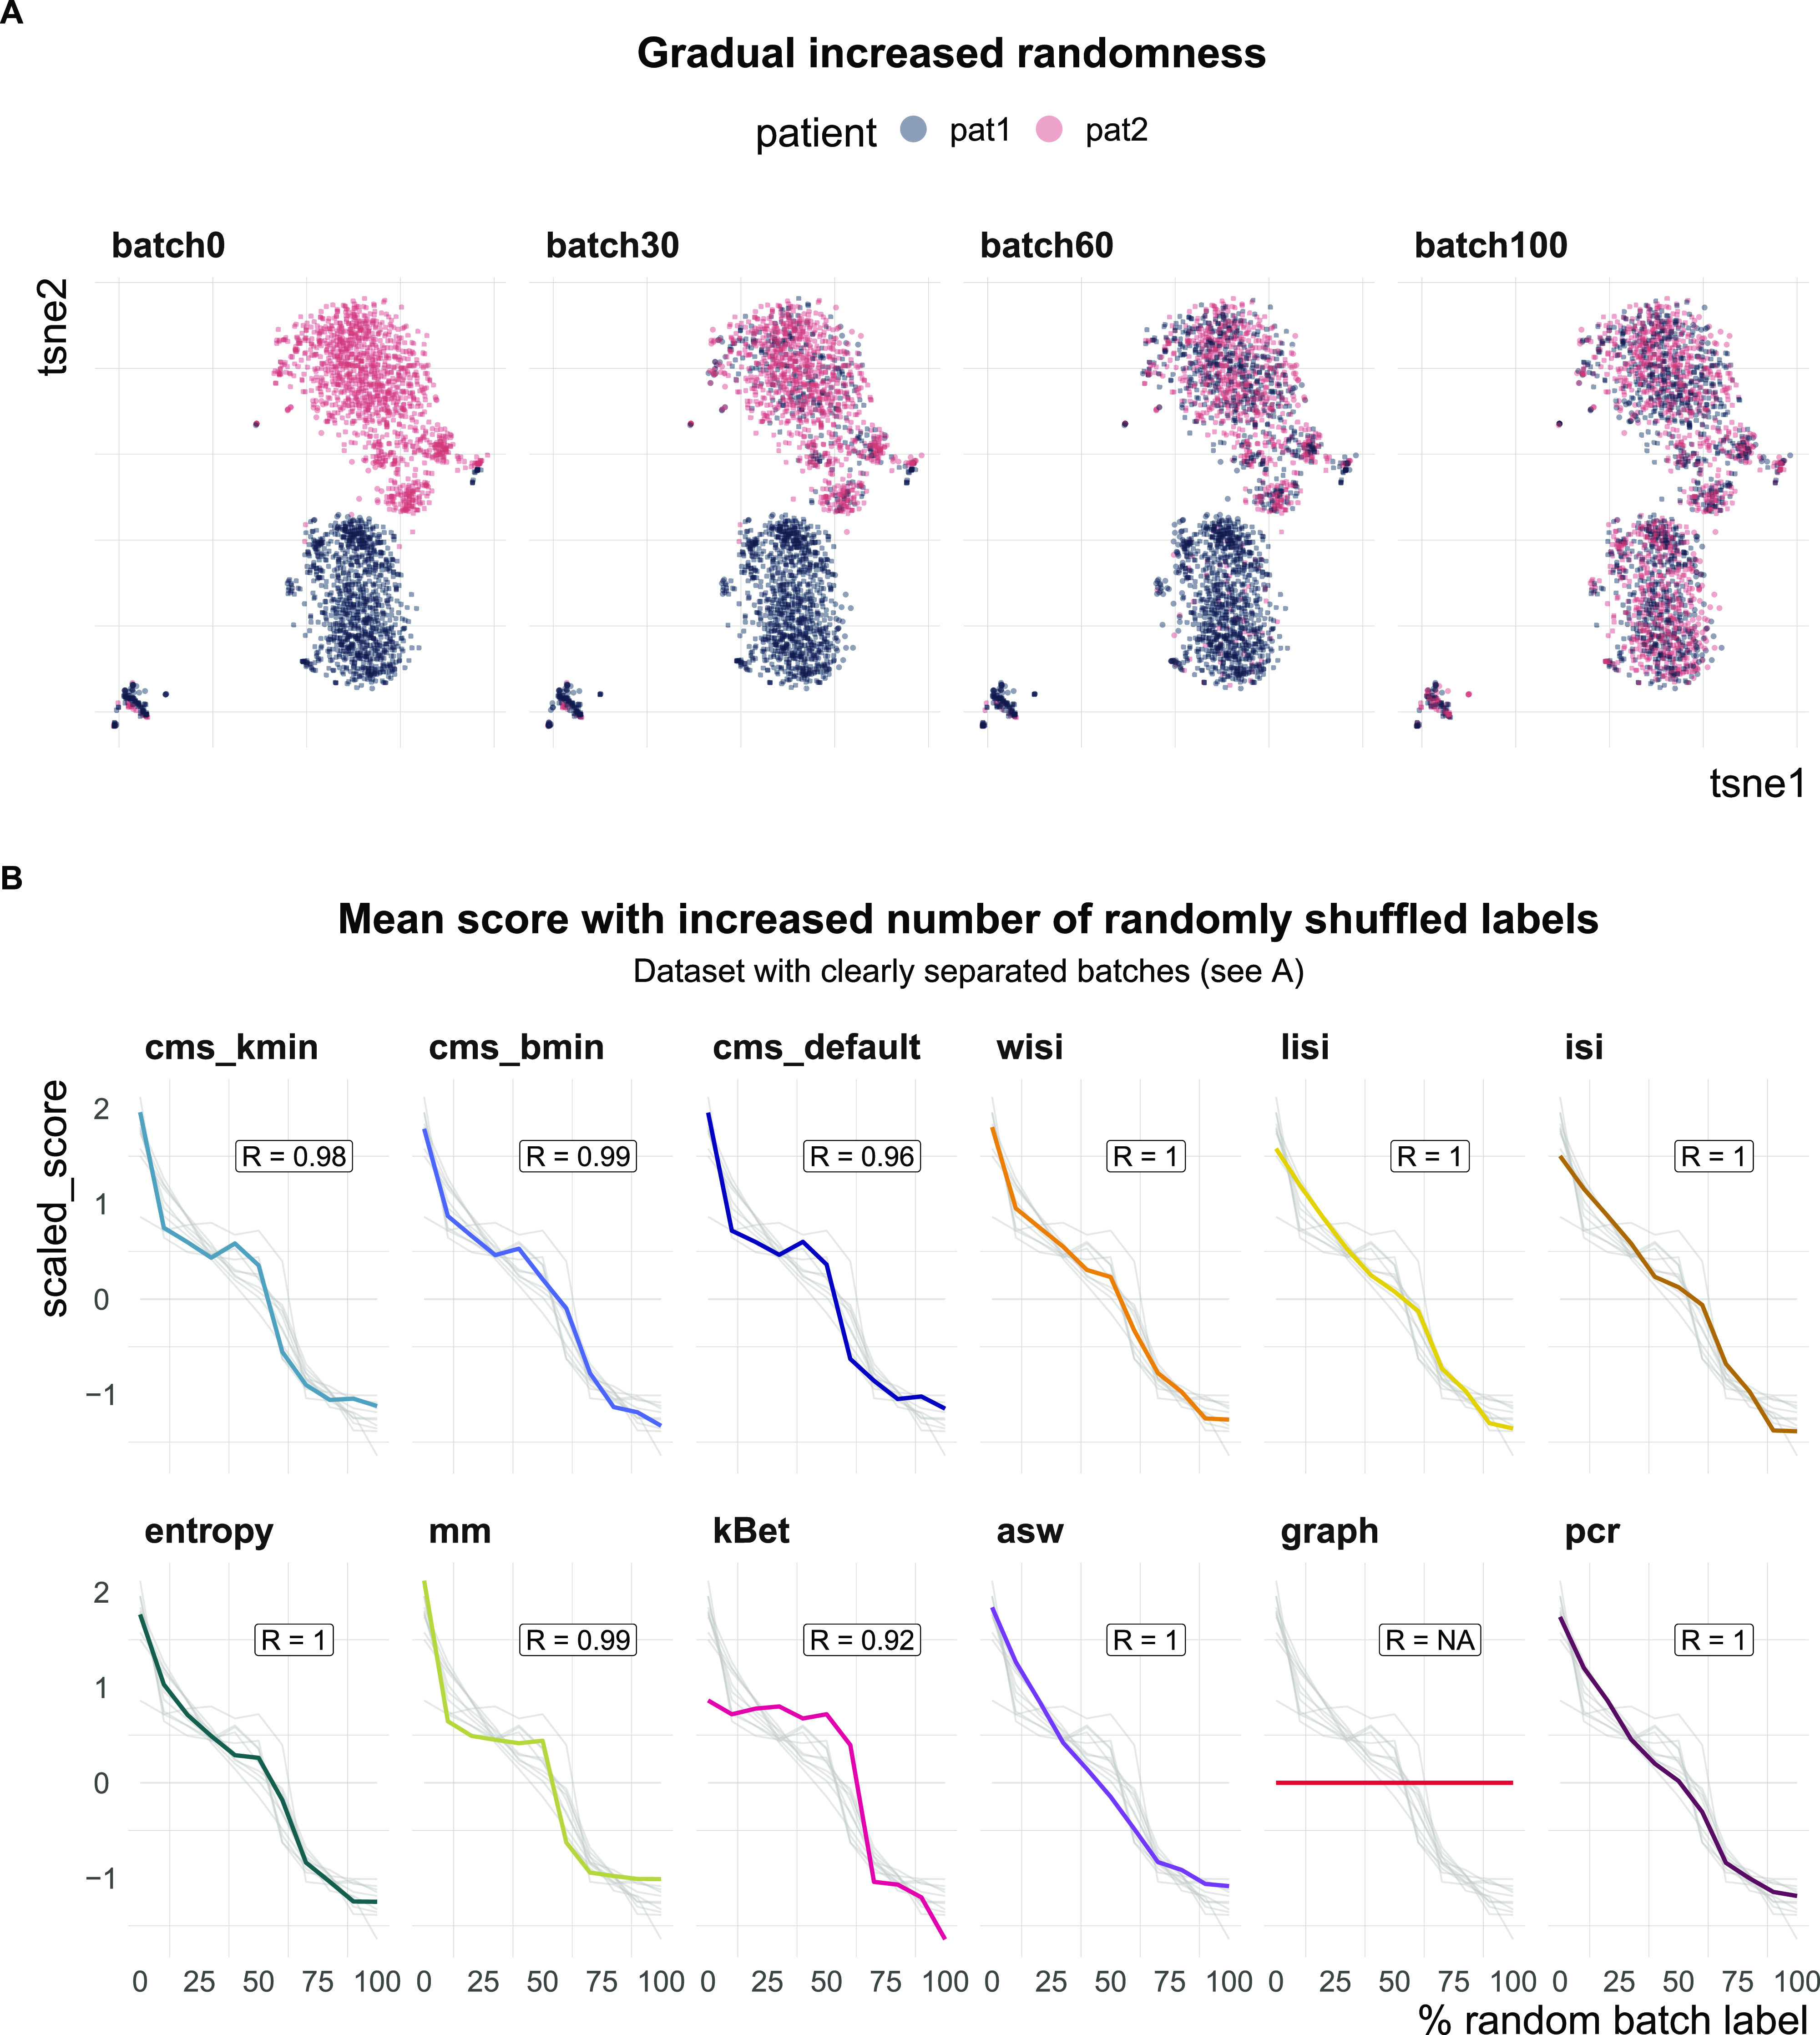
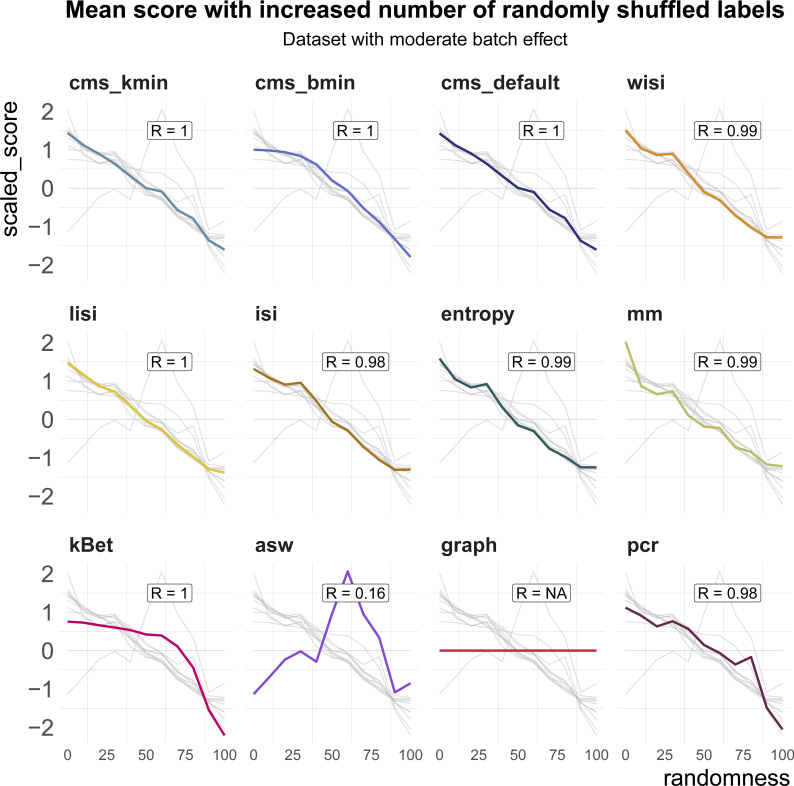
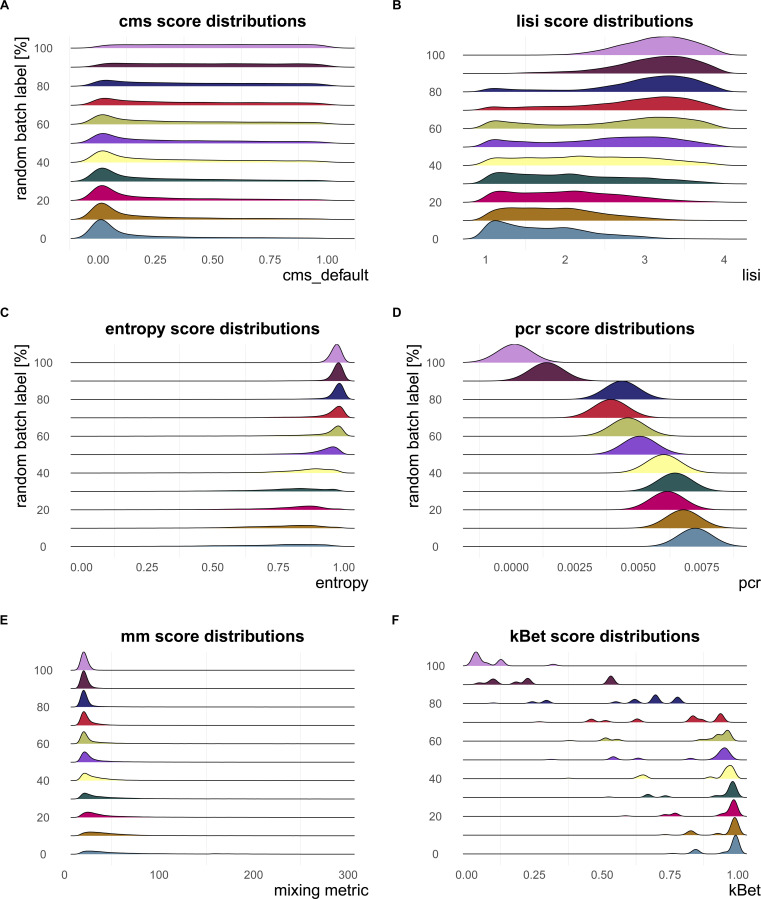
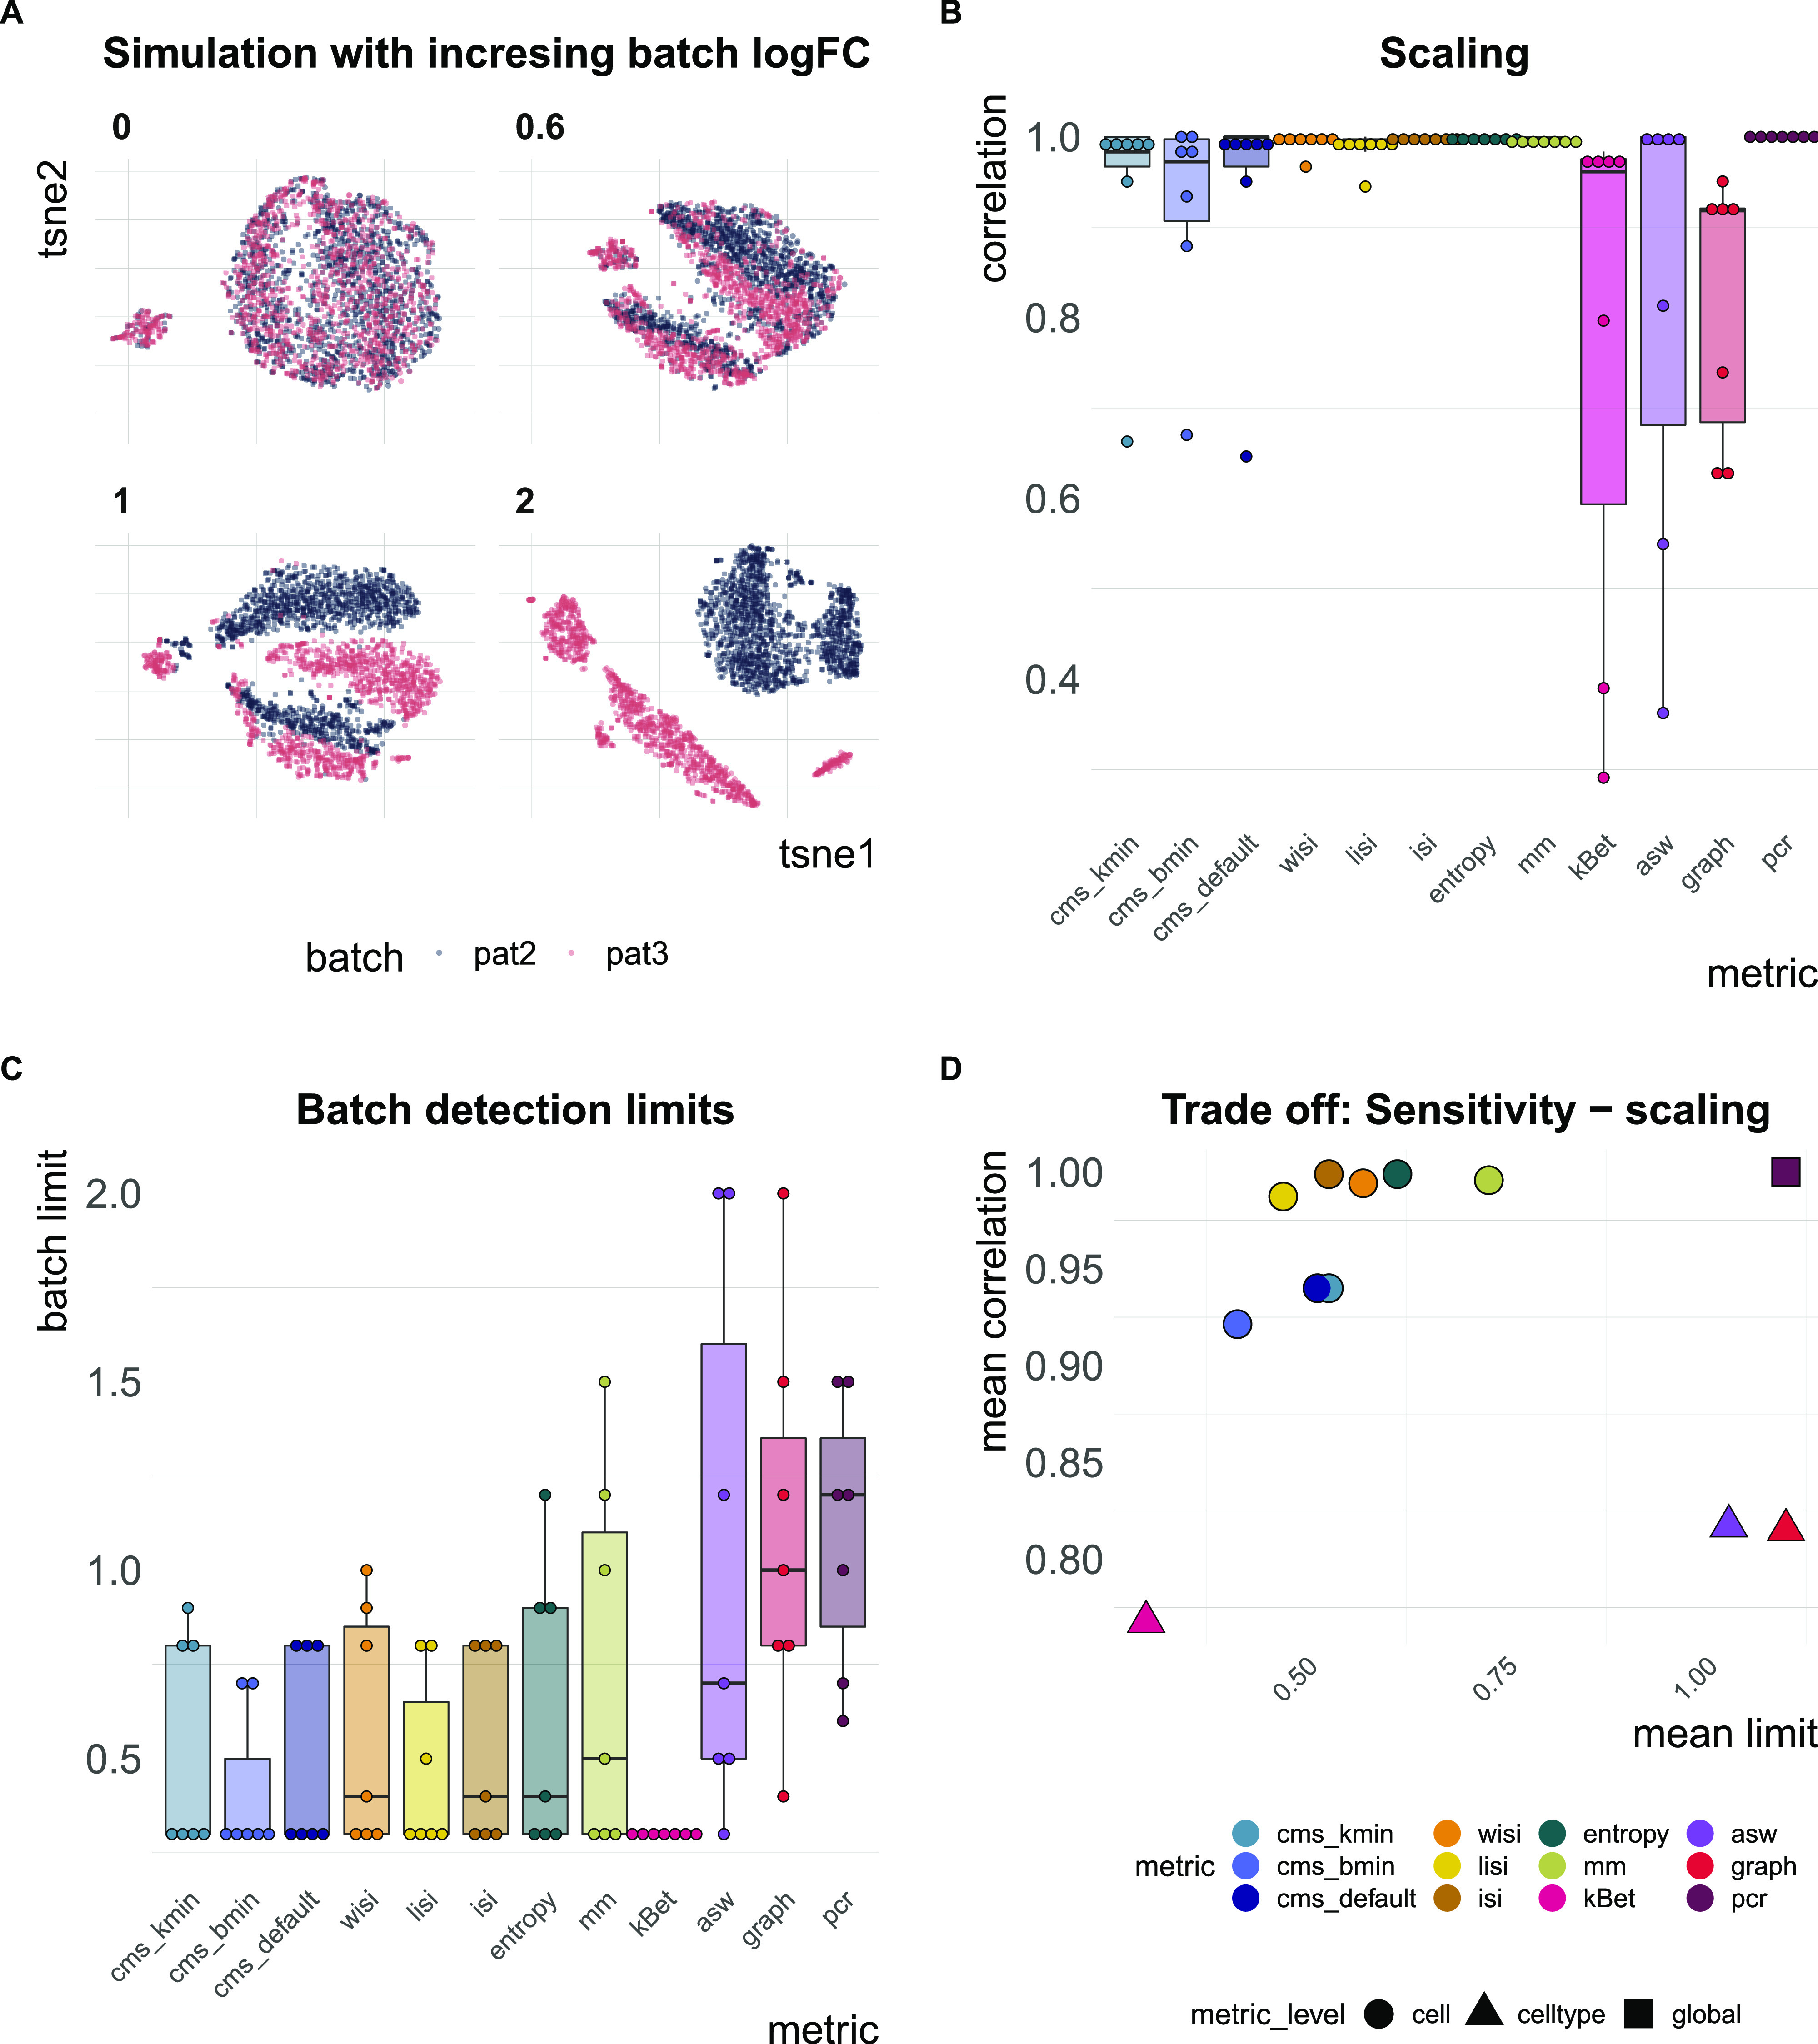
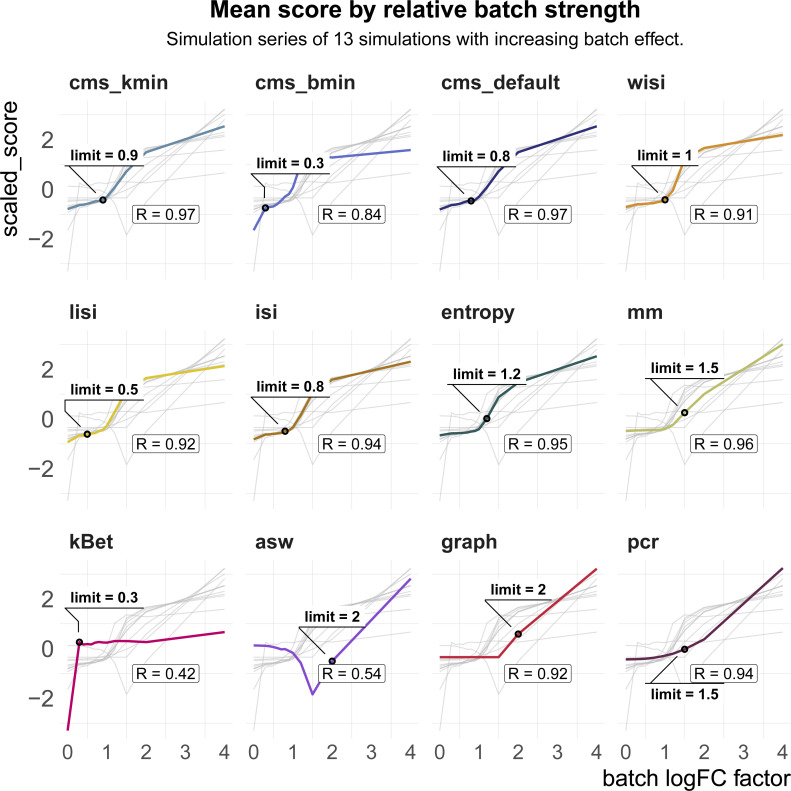
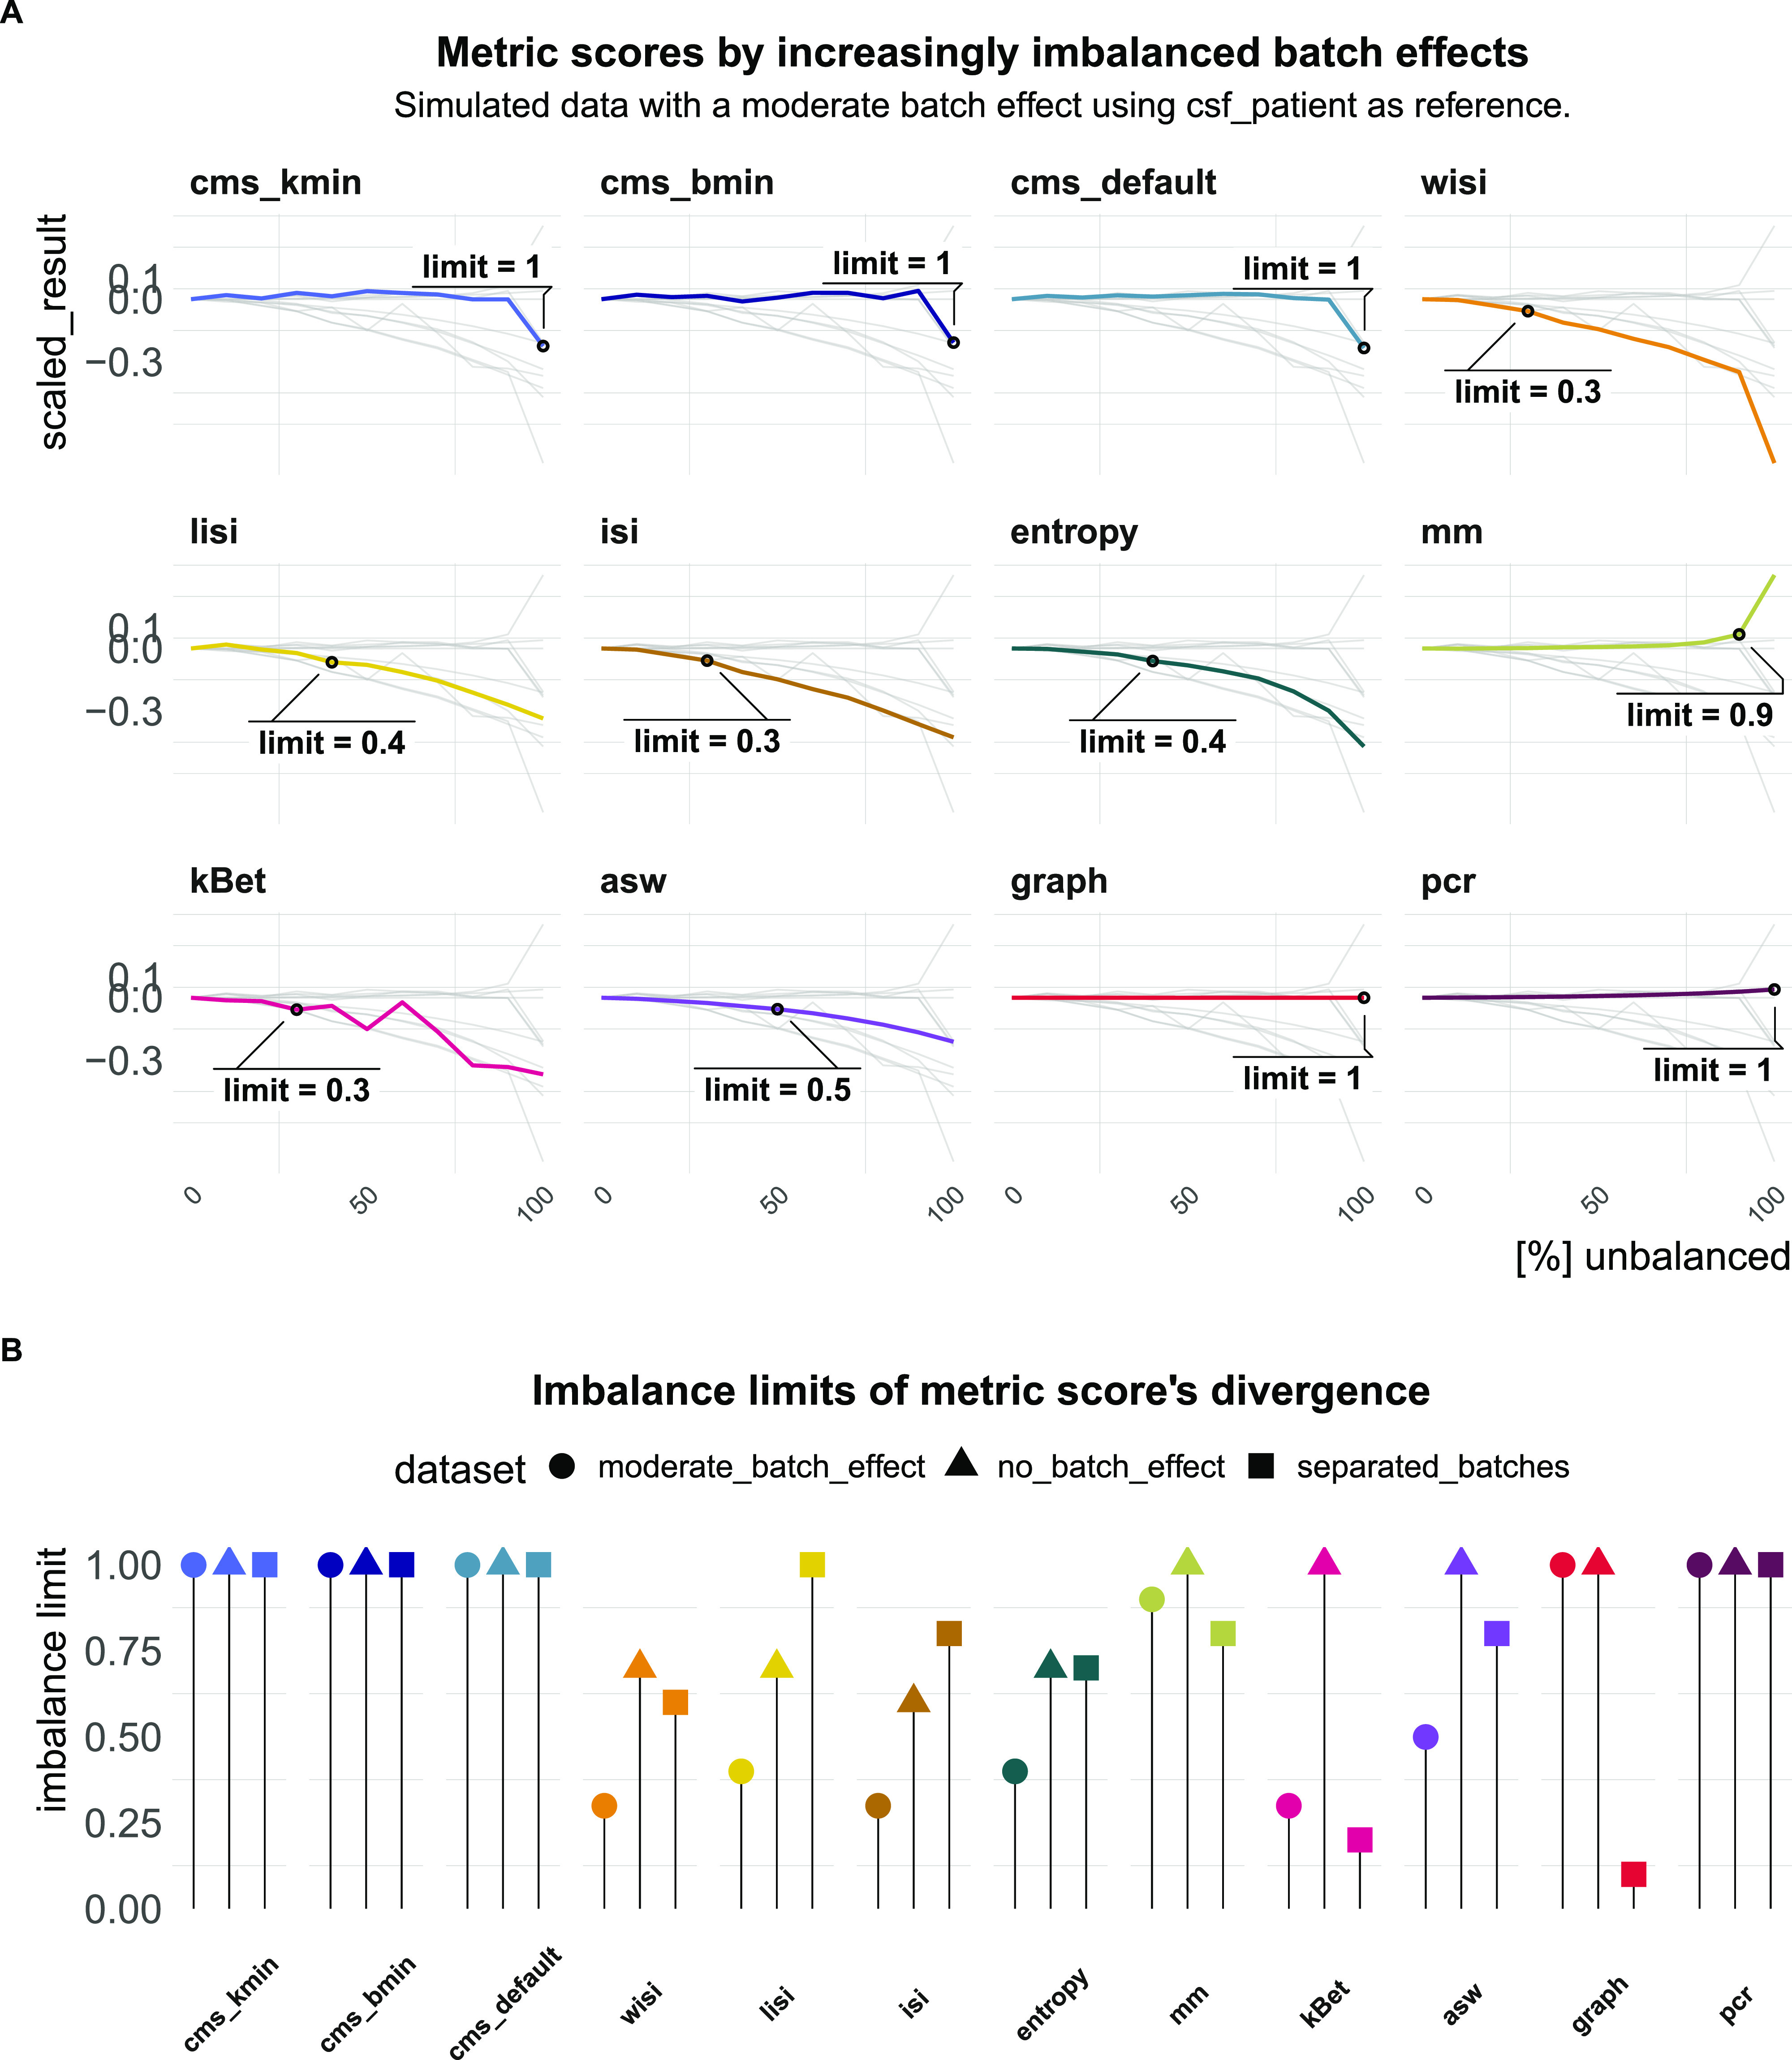
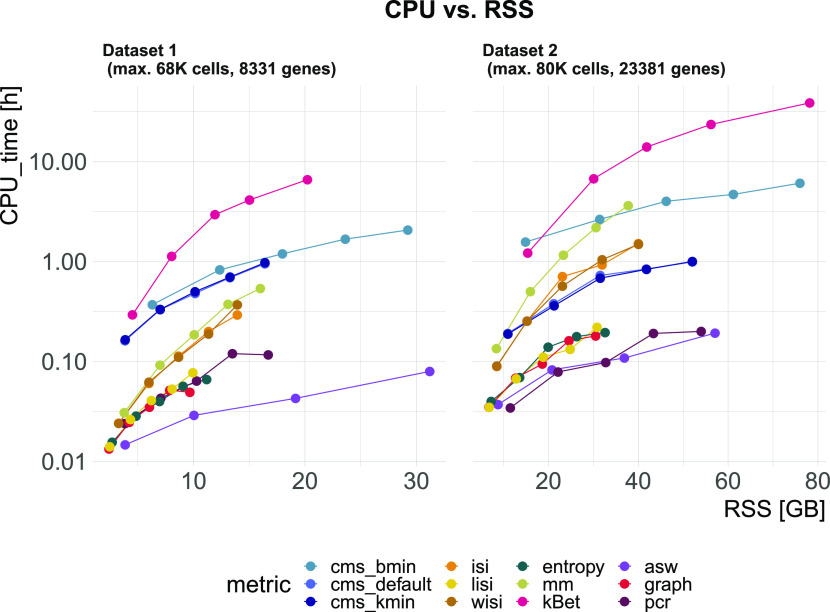
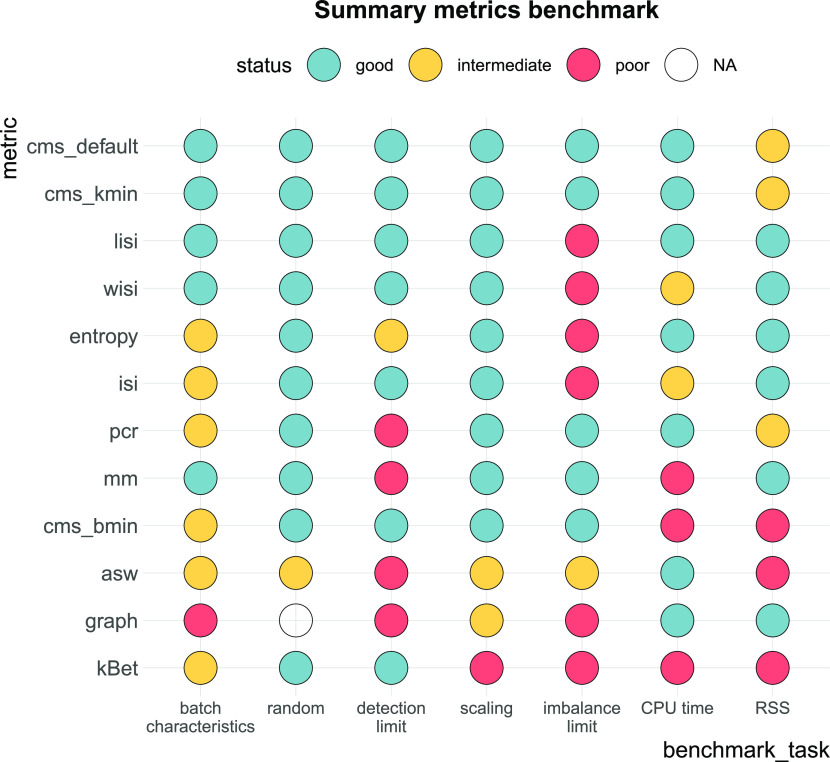
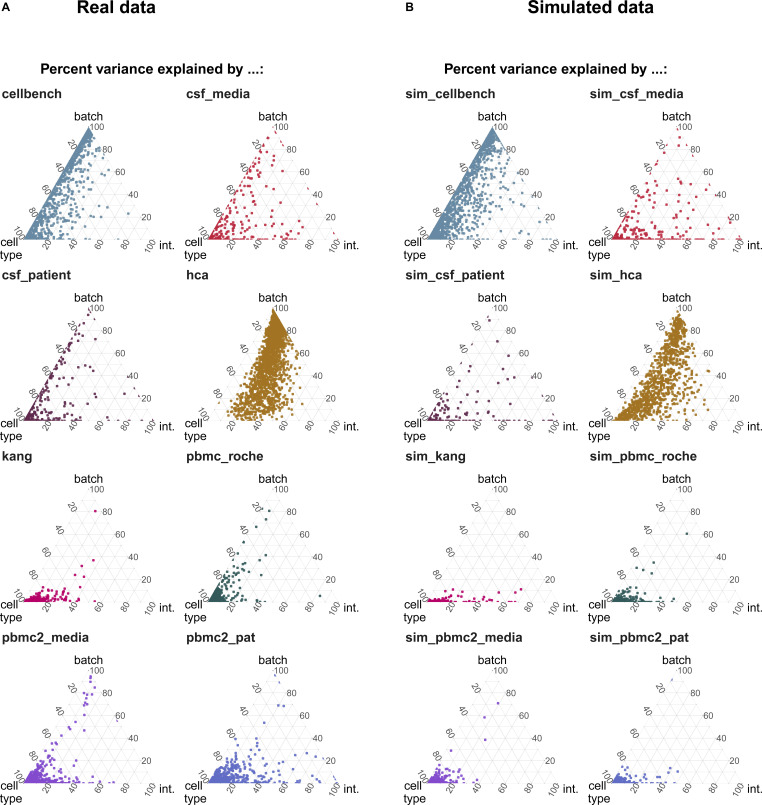
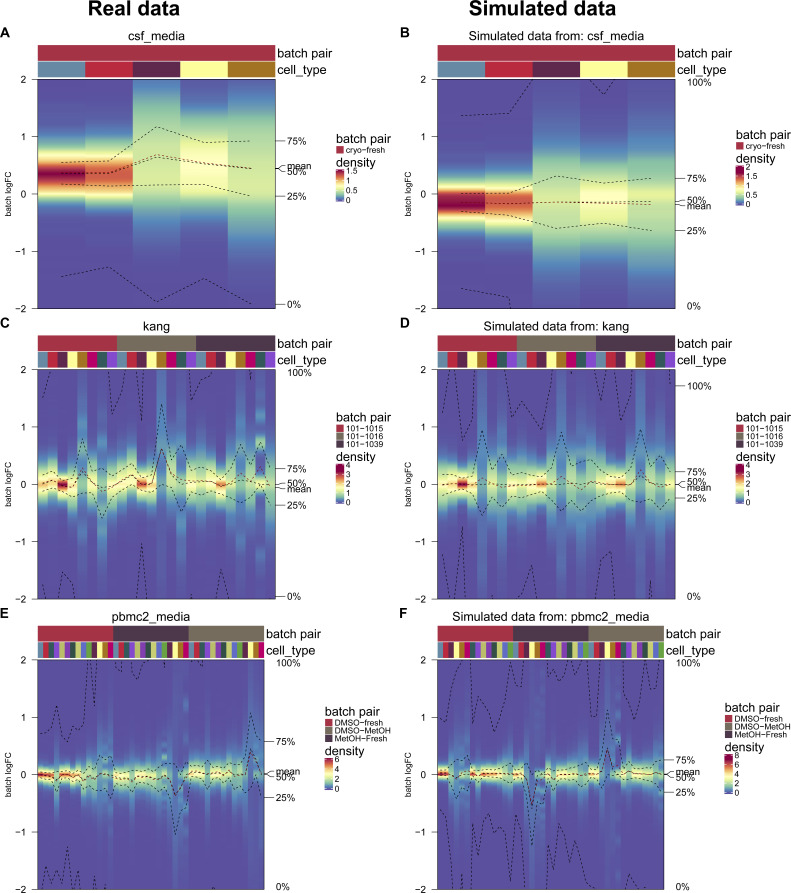
A key challenge in single-cell RNA-sequencing (scRNA-seq) data analysis is batch effects that can obscure the biological signal of interest. Although there are various tools and methods to correct for batch effects, their performance can vary. Therefore, it is important to understand how batch effects manifest to adjust for them. Here, we systematically explore batch effects across various scRNA-seq datasets according to magnitude, cell type specificity, and complexity. We developed a cell-specific mixing score (cms) that quantifies mixing of cells from multiple batches. By considering distance distributions, the score is able to detect local batch bias as well as differentiate between unbalanced batches and systematic differences between cells of the same cell type. We compare metrics in scRNA-seq data using real and synthetic datasets and whereas these metrics target the same question and are used interchangeably, we find differences in scalability, sensitivity, and ability to handle differentially abundant cell types. We find that cell-specific metrics outperform cell type-specific and global metrics and recommend them for both method benchmarks and batch exploration.


Conflict of interest statement

D Malhotra is a full-time employee of Roche; the remaining authors declare that they have no competing interests.

Figures

Figure S1.
Figure S1.. Batch characterization.
Batch characteristics across nine different batches related to differences between patients, media storage, and use of sequencing protocols (batch origin). The following characteristics are shown: mean per cent variance associated with the batch variable across all genes (PVE_batch), mean per cent variance associated with the cell-type variable across all genes (PVE_celltype), mean relative number of differentially expressed genes between batches (DE_genes), mean Pearson correlation of log fold changes of the batch effect between cell types (lfc_correlation), mean overlap of DE genes between different cell-types (de_overlap).
Figure 1.
Figure 1.. Batch characterization.
(A) Gene-wise variance partitioning across datasets. Each dot in each ternary plot represents a gene’s relative amount of variance explained (by batch, cell type or interaction). (B, C) Batch logFC distribution by cell type and batch effect in the cellbench and hca datasets, respectively. Each column represents a density plot of the estimated logFCs for a batch/cell type combination. Dotted lines indicate the mean, 25%, 50% and 75% percentiles.
Figure S2.
Figure S2.. Overview of batch effects and datasets included in this study.
2D tSNE projections of batch effects characterized in this study. Different batches are indicated by colour. Batches form distinct groups in all datasets except for pbmc_roche and kang.
Figure 2.
Figure 2.. Cell-specific mixing score cms.
(A) A two-dimensional (2D) tSNE projection of synthetic single-cell RNA-sequencing data with two batches and a cell type–specific batch effect. Cell X is surrounded by an equally mixed neighbourhood with no batch effect. (B) Batch-specific Euclidean distance distributions for all cells within k nearest neighbours (knn) of cell X in principal component analysis space (PC1-PC10). cms (Anderson–Darling P-value) = 0.88. (C) A 2D tSNE projection of synthetic single-cell RNA-sequencing data with two batches and a cell type–specific batch effect. Cell Y is surrounded by a biased neighbourhood with a batch effect. Distances towards cells from the “red” batch are larger than those towards cells from the “blue” batch. (D) Batch-specific Euclidean distance distributions for all cells within knn of cell Y in principal component analysis space (PC1-PC10). cms = 0.03. (E) Score distribution of cms in a dataset with four batches with 0%, 50% and 100% of batch labels permuted (see benchmark Task 2).
Figure 3.
Figure 3.. Task 1—Reflection of batch characteristics.
Metric scores versus (surrogate) batch strength across the real datasets. Summarized metric scores (y-axis) are compared with the proportion of DE genes (top x-axis, solid line) and the mean PVE-Batch (bottom x-axis, dashed line) per dataset. Datasets with a stronger batch effect (high percentage of DE genes/mean PVE-Batch) are expected to show a higher overall metric score than datasets with mild batch effects (low percentage of DE genes/mean PVE-Batch). Spearman correlation coefficients of metrics against the two batch strength measures are shown (R_PVE-Batch, R_DE) in the text boxes for each metric and evaluated in Task 1. Metric scores were standardized by subtraction of their minimum and division of their range (maximum–minimum) across datasets. Directions were adjusted when necessary, such that all scores increase with batch strength.
Figure 4.
Figure 4.. Task 2—Scaling with batch label permutation.
(A) A 2D tSNE projection of one semi-synthetic dataset. Batch labels were randomly permuted in 0–100% of the cells (batch 0 to batch 100) using steps of 10%. Expression profiles and cell type assignments remained unchanged. (B) Metric scores by increasingly randomized batch label in the dataset. Scores were standardized by subtraction of their mean and division of their SD across permutations. Directions were adjusted when necessary, such that all scores increase with batch strength. Grey lines indicate the scores of the other metrics. Corresponding absolute values of the Spearman correlation coefficients (R) are shown in the text box of each subpanel.
Figure S3.
Figure S3.. Benchmark task2: scaling with randomness.
Metric scores by increasingly randomized batch label in a dataset with a moderate batch effect (pbmc_roche). Scores were standardized by subtraction of their mean and division of their SD across permutations. Directions were adjusted when necessary, such that all scores increase with batch strength. Grey lines indicate the scores of the other metrics. Corresponding absolute values of the Spearman correlation coefficients (R) are shown in the text box of each subpanel.
Figure S4.
Figure S4.. Metric score distributions across data with increasingly randomized batch label.
Negative control—metrics reach their nominal minimum in a dataset with completely random batch label assignments. (A, B, C, D) In particular, at 100% randomly permuted batch labels, (A) cms shows a flat score distribution, (B) lisi approaches the effective number of batches (four in this dataset—pbmc_roche), (C) the mean entropy is about one, and (D) principal component regression equals to 0. (E) The mean mm also gradually decreases to a minimum at 100% randomly batch label permutation. (F) Although kBet scores decrease continuously with increasing percentage of random batch label, there are still some cell types with scores >0 at 100% randomly assigned batch label.
Figure 5.
Figure 5.. Task 3—Scaling and batch limits.
(A) A 2D tSNE projection of simulation series with increasing batch logFC factors (θb from Equation (3); for example, a factor of 0 represents a batch-free dataset). (B) Boxplots of Spearman correlation coefficients of the metric scores and the relative batch strength for all seven simulation series. (C) Boxplots of batch limits, defined as the smallest batch logFC factors such that metrics differ more than 10% from the batch-free score. A small batch limit indicates high sensitivity to detect variation related to the batch variable. (D) Trade-off between batch detection sensitivity (batch limits) and scaling with batch strength. Shapes refer to metric types.
Figure S5.
Figure S5.. Benchmark task3: scaling and detection limits in synthetic data.
z-transformed metric scores (y-axis) across simulation series of the pbmc2_media dataset with increasing batch logFC factor (x-axis). All metrics except average silhouette width increase with increasing batch logFC. This is reflected in the Spearman correlation coefficient (R) between the metric’s scores and the batch logFC factor. The detection limit (limit) refers to the first logFC factor with a score that differs by ≥10% of the metric’s range from the score of the batch-free simulation (batch logFC factor = 0).
Figure 6.
Figure 6.. Task 4—Imbalance limits.
(A) Changes in metric scores (within the same dataset) according to amount of imbalance. Imbalance refers to the increased removal of cells (0–100%) of one batch in one cell type. Scores were centred by the score with equal number of cells from both batches (no removed cells) and scaled by the score’s range. Because gene-wise batch logFCs remain unchanged, metrics that are able to robustly quantify the batch effect, despite differential abundance, should show a stable score around 0. Grey lines indicate the other metrics’ scores. (B) Lollipop plots of imbalance limits across different batch scenarios. Imbalance limits are defined as the proportion of removed cells from one batch and cell type that results in a metric score that differs more than 5% from the score of the balanced batch (no cell removed).
Figure 7.
Figure 7.. Task 5—Computational time and memory.
Metric’s CPU time (logarithmic scale) versus maximum resident set size (RSS). Datasets were down-sampled in steps of 20% starting with 68,000 cells (Dataset 1) and 80,000 cells (Dataset 2). The two datasets also differ by the number of genes: Dataset 1 contains 8,331 genes and Dataset 2 contains 23,381 genes.
Figure 8.
Figure 8.. Benchmark summary.
Metric performance and ranking by benchmark task. Methods are ranked by their overall performance from top to bottom (numerical encoding good = 2, intermediate = 1, poor/NA = 0). Following thresholds for good and intermediate were used: batch characteristics and random: Spearman correlation coefficients ≥0.75, ≥0.5; scaling: Spearman correlation coefficient ≥0.9, ≥0.8; detection limits of ≤0.6, ≤0.7; imbalance limits ≥0.9, ≥0.75; CPU time ≤1, ≤2 h; RSS ≤50 GB, ≤70 GB.
Figure S6.
Figure S6.. Comparison of variance partitions between simulations and their corresponding real data reference.
(A, B) Variance explained by batch, cell type and the interaction of cell type and batch in the real datasets (A) and the corresponding simulated datasets (B). In these simulations, the batch logFC factors are set to one, thus simulations mimic their respective real data reference.
Figure S7.
Figure S7.. Comparison of batch logFC distributions between simulations and their corresponding real data reference.
(A, B, C, D, E, F) Cell type–specific logFC distributions between batches in real datasets (A, C, E) and their corresponding simulated datasets (B, D, F). Batch tuning factors are set to one, such that simulations mimic their respective real data reference.

References

    1. Haghverdi L, Lun ATL, Morgan MD, Marioni JC (2018) Batch effects in single-cell RNA-sequencing data are corrected by matching mutual nearest neighbors. Nat Biotechnol 36: 421–427. 10.1038/nbt.4091 - DOI - PMC - PubMed
    1. Büttner M, Miao Z, Wolf FA, Teichmann SA, Theis FJ (2019) A test metric for assessing single-cell RNA-seq batch correction. Nat Methods 16: 43–49. 10.1038/s41592-018-0254-1 - DOI - PubMed
    1. Korsunsky I, Millard N, Fan J, Slowikowski K, Zhang F, Wei K, Baglaenko Y, Brenner M, Loh P-R, Raychaudhuri S (2019) Fast, sensitive and accurate integration of single-cell data with harmony. Nat Methods 16: 1289–1296. 10.1038/s41592-019-0619-0 - DOI - PMC - PubMed
    1. Luecken MD, Buttner M, Chaichoompu K, Danese A, Interlandi M, Mueller MF, Strobl DC, Zappia L, Dugas M, Colomé-Tatché M, et al. (2020) Benchmarking atlas-level data integration in single-cell genomics. BioRxiv 10.1101/2020.05.22.111161 (Preprint posted May 27, 2020). - DOI - PMC - PubMed
    1. Tran HTN, Ang KS, Chevrier M, Zhang X, Lee NYS, Goh M, Chen J (2020) A benchmark of batch-effect correction methods for single-cell RNA sequencing data. Genome Biol 21: 12. 10.1186/s13059-019-1850-9 - DOI - PMC - PubMed

Publication types