. 2021 Mar 30;118(13):e2001611118.
doi: 10.1073/pnas.2001611118.

Inflammatory signaling sensitizes Piezo1 mechanotransduction in articular chondrocytes as a pathogenic feed-forward mechanism in osteoarthritis

Affiliations

Inflammatory signaling sensitizes Piezo1 mechanotransduction in articular chondrocytes as a pathogenic feed-forward mechanism in osteoarthritis

Whasil Lee et al. Proc Natl Acad Sci U S A. .

Abstract

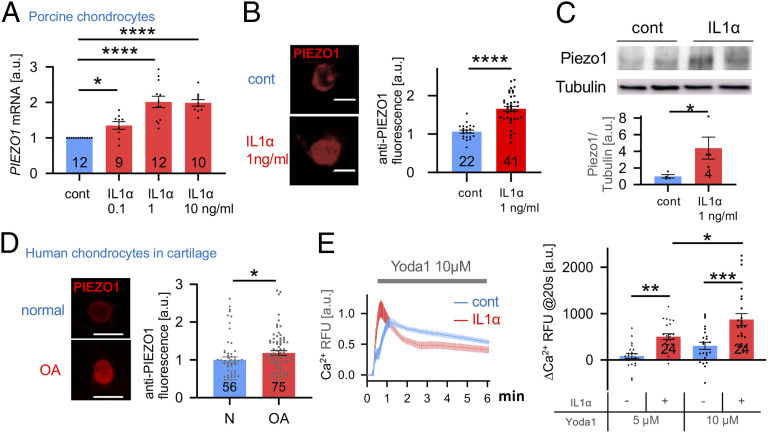
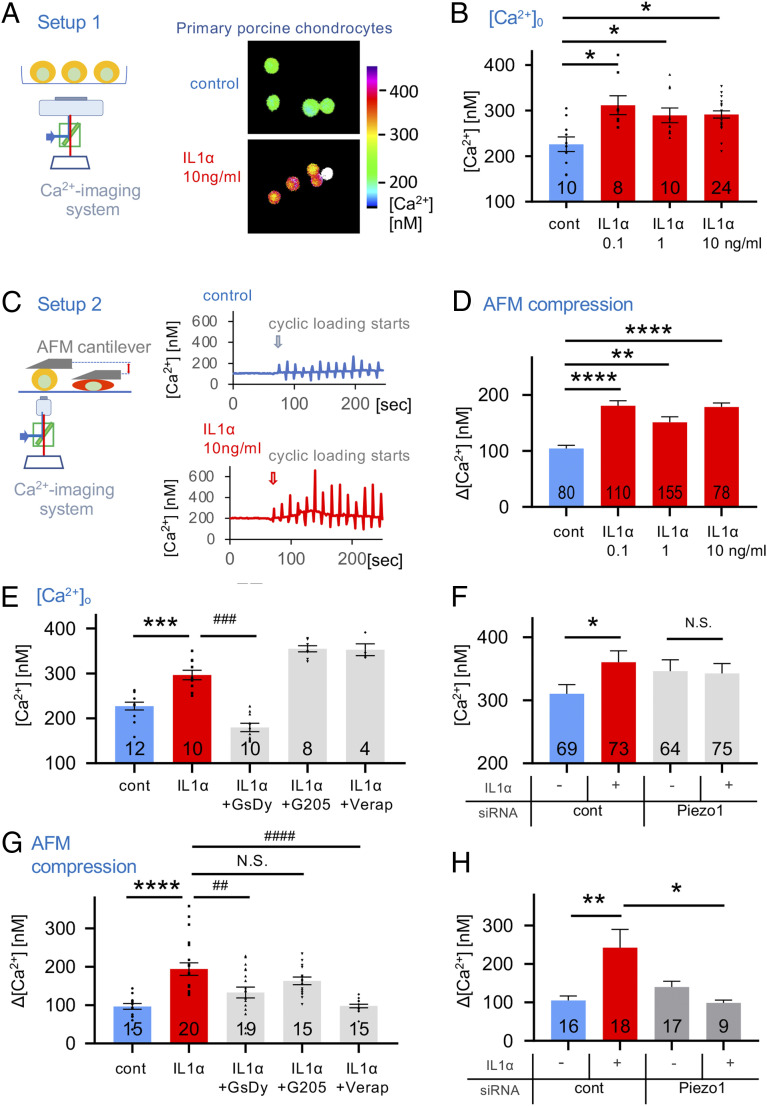
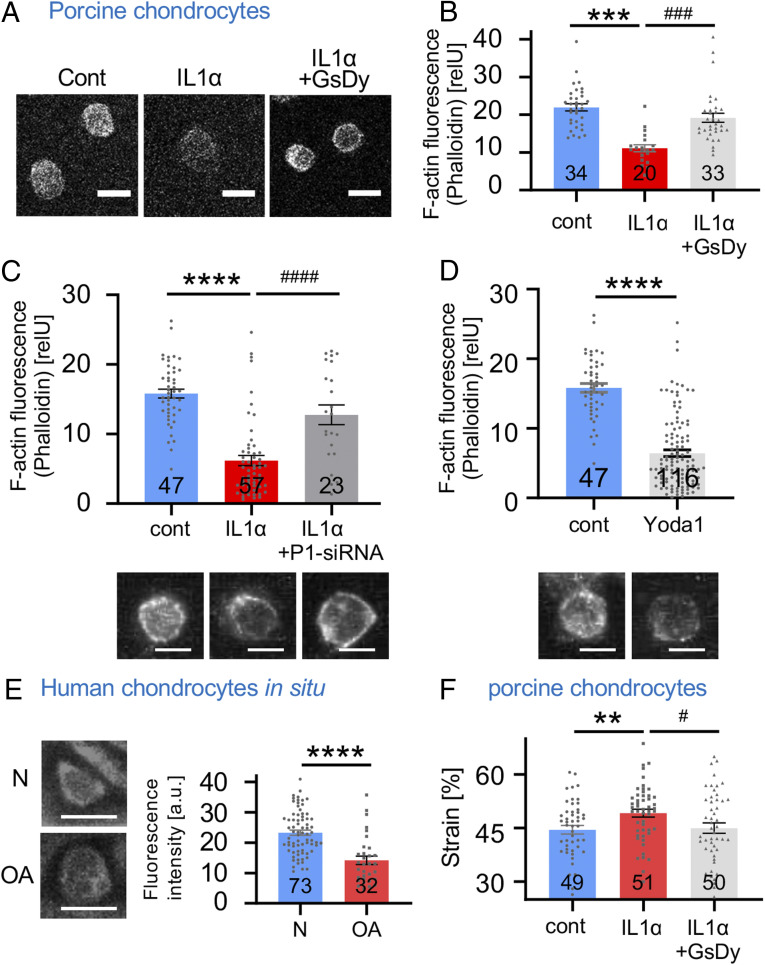
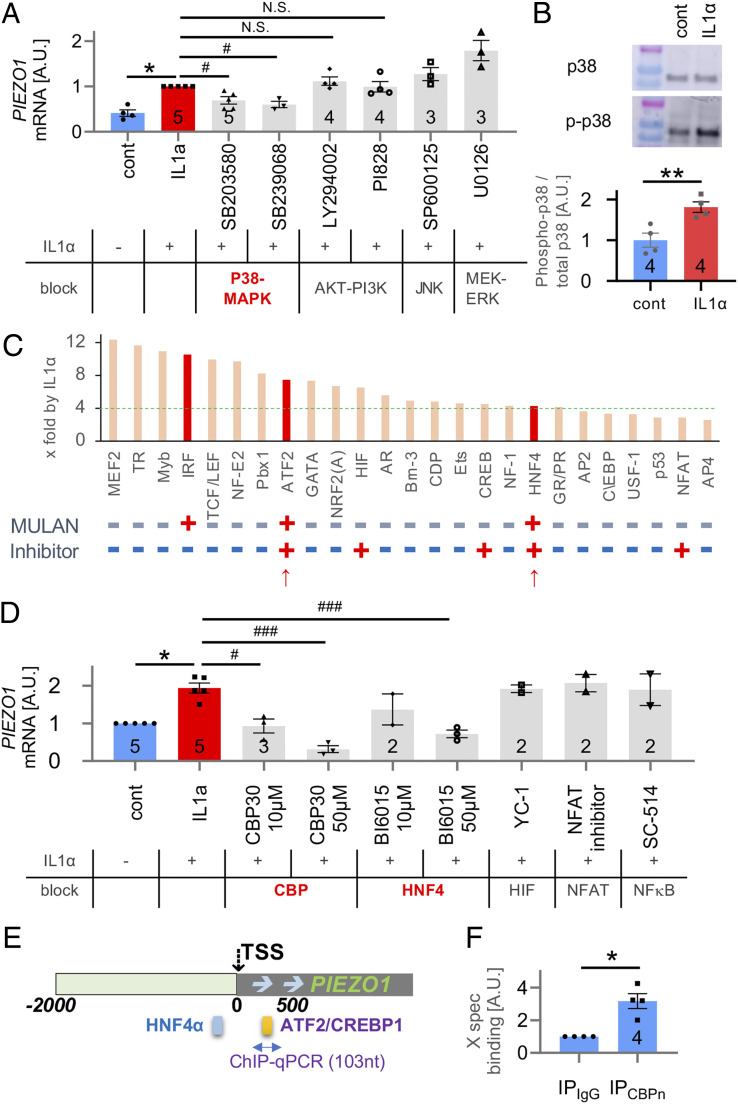
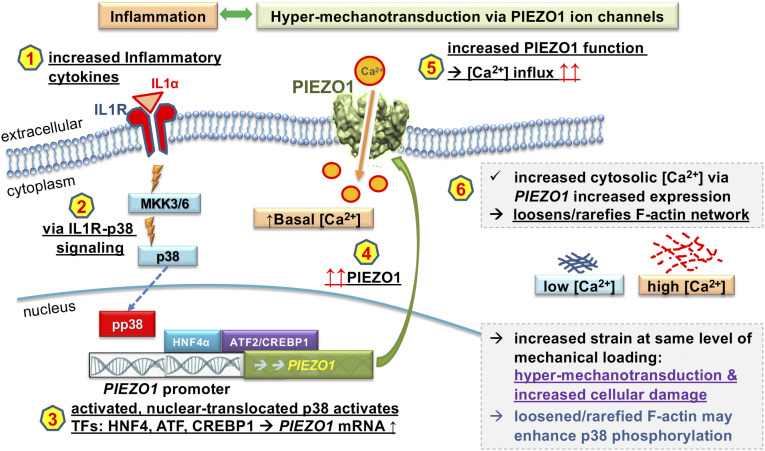
Osteoarthritis (OA) is a painful and debilitating condition of synovial joints without any disease-modifying therapies [A. M. Valdes, T. D. Spector, Nat. Rev. Rheumatol. 7, 23-32 (2011)]. We previously identified mechanosensitive PIEZO channels, PIEZO1 and PIEZO2, both expressed in articular cartilage, to function in chondrocyte mechanotransduction in response to injury [W. Lee et al., Proc. Natl. Acad. Sci. U.S.A. 111, E5114-E5122 (2014); W. Lee, F. Guilak, W. Liedtke, Curr. Top. Membr. 79, 263-273 (2017)]. We therefore asked whether interleukin-1-mediated inflammatory signaling, as occurs in OA, influences Piezo gene expression and channel function, thus indicative of maladaptive reprogramming that can be rationally targeted. Primary porcine chondrocyte culture and human osteoarthritic cartilage tissue were studied. We found that interleukin-1α (IL-1α) up-regulated Piezo1 in porcine chondrocytes. Piezo1 expression was significantly increased in human osteoarthritic cartilage. Increased Piezo1 expression in chondrocytes resulted in a feed-forward pathomechanism whereby increased function of Piezo1 induced excess intracellular Ca2+ at baseline and in response to mechanical deformation. Elevated resting state Ca2+ in turn rarefied the F-actin cytoskeleton and amplified mechanically induced deformation microtrauma. As intracellular substrates of this OA-related inflammatory pathomechanism, in porcine articular chondrocytes exposed to IL-1α, we discovered that enhanced Piezo1 expression depended on p38 MAP-kinase and transcription factors HNF4 and ATF2/CREBP1. CREBP1 directly bound to the proximal PIEZO1 gene promoter. Taken together, these signaling and genetic reprogramming events represent a detrimental Ca2+-driven feed-forward mechanism that can be rationally targeted to stem the progression of OA.

Keywords: PIEZO1; Piezo1 gene regulation; interleukin-1; osteoarthritis.


Conflict of interest statement

The authors declare no competing interest.

Figures

Fig. 1.
Fig. 1.
Increased Piezo1 expression in IL-1α–treated porcine chondrocytes and human osteoarthritic cartilage. (A) PIEZO1 mRNA level in control and IL-1α–treated porcine chondrocytes. IL-1α increases Piezo1 mRNA levels; the number of independent experiments (= primary chondrocytes from separate joints were generated) is indicated in bars; a.u., arbitrary units. (B, Left) Representative confocal micrographs of IL-1α–treated porcine chondrocytes, immunolabeled for PIEZO1. (Right) Significantly increased PIEZO1 protein expression is found in IL-1α–treated porcine chondrocytes versus control. Numbers in bars indicate number of cells quantified; three independent cell isolations are shown. (C) Western blot in control and IL-1α–treated porcine chondrocytes. Note increased PIEZO1 protein expression with IL-1α treatment versus control, β-tubulin not regulated. The upper panels show representative immunoblots (see SI Appendix, Fig. S1 for full blot), and the lower shows bar diagram densitometric quantitation, normalized for β-tubulin; the number of independent experiments is indicated in bars. (D, Left) Representative confocal micrographs of healthy and osteoarthritic human chondrocytes; PIEZO1-specific immunolabeling of chondrocytes in human cartilage tissue (see also SI Appendix, Fig. S2 for antibody validation using PIEZO1−/− cells) (Scale bar, 10 μm). (Right) Relative expression level PIEZO1 in healthy and OA chondrocytes. The numbers in bars indicate the number of cells quantified; five independent human cartilage preparations are shown. (E) IL-1α–treated porcine chondrocytes show different Ca2+ dynamics in response to application of the PIEZO1-selective activating small molecule, Yoda-1 (Left). In this Ca2+ dynamics over time, note accelerated onset and then plateau in the IL-1α–treated cells versus protracted influx in control chondrocytes, indicative of an enhanced PIEZO1-mediated Ca2+ signaling under inflammatory conditions. (Right) Bar diagrams illustrate quantitation of the speed of onset of the Ca2+ transient; note more rapid onset under condition of IL-1α–mediated inflammation. The increased potency of 10 µM Yoda-1 versus 5 µM Yoda-1 is apparent as well; one independent cell isolation with 24 cells per experimental group. Bars represent mean ± SEM; for group comparison: t test for B and C; one-way ANOVA, Tukey’s post hoc test for A; *P < 0.05, **P < 0.01, ***P < 0.001, ****P < 0.0001 significantly different from control. (Scale bars in A and D, 10 µm.)
Fig. 2.
Fig. 2.
Proinflammatory IL-1α signaling alters Ca2+ dynamics in porcine articular chondrocytes. (A, Left) A schematic diagram of the setup; (Right) representative ratiometric Ca2+ images of IL-1α–treated chondrocytes. (B) Resting cytosolic Ca2+ concentrations of primary articular chondrocytes are significantly increased when exposing cells to IL-1α. The numbers in bars indicate independent experiments. (C, Left) A schematic diagram of the setup; AFM probe (flat, tipless) compresses single cells cyclically every 10 s. (Right) Ca2+ concentrations in response to cyclical compression. Loading starts at arrow-marked time point. Representative Ca2+ transients are shown: (Top) control, (Bottom) IL-1α–treated chondrocytes. (D) Mechanical-compression–induced Ca2+ transients are significantly increased when exposing primary chondrocytes to IL-1α. The numbers in bars indicate numbers of transients (increase in [Ca2+]i over resting [Ca2+]i) measured; the number of cells stimulated were 16, 23, 31, and 16 from four independent cell isolations. (E) Resting [Ca2+]i of chondrocytes that were treated with IL-1α (1 ng/mL) and inhibitors of Piezo (GsMTx4 2 µM/dynasore 5 µM), TRPV4 (GSK205 25 µM), and VGCC (verapamil 0.5 µM). Resting [Ca2+]i that is significantly elevated by exposure to IL-1α is significantly reduced below control values when inhibiting Piezo but not decreased by inhibition of TRPV4 or VGCC. The numbers in bars indicate independent experiments, with numbers of cells examined being 855, 457, 385, 387, and 153. (F) Resting [Ca2+]i of chondrocytes subjected to Piezo1 knockdown via specific siRNA. Note again the significant increase of resting [Ca2+]i when treating with IL-1α (1 ng/mL), as in E. This significant increase is absent when inhibiting Piezo1 function by transfection with Piezo1-specific siRNA (see SI Appendix, Fig. S4 for demonstration of effective knockdown of Piezo1); three independent experiments were performed with total numbers of cells indicated in bars. (G) Experimental groups as in E, but mechanical-compression–evoked Ca2+ dynamics were measured as in C and D. Note that significant IL-1α–evoked Ca2+ increase is significantly attenuated when inhibiting Piezo, but, again, there was no decrease when inhibiting TRPV4. Remarkably, there was a complete elimination of the IL-1α–evoked Ca2+ increase when inhibiting VGCC, in striking contrast to effects of VGCC on resting [Ca2+]i (E). The numbers indicate numbers of transients measured; as in D, respective number of cells was 3, 4, 4, 3, and 3. (H) Experimental setup as in G and measurement of mechanical-compression–evoked Ca2+ dynamics. We observed a significant IL-1α–mediated Ca2+ increase, which was completely absent with Piezo1 knockdown (as in F); three independent experiments were performed with the total numbers of cells indicated in bars. Bars represent mean ± SEM; for group comparison, B, D, E, and F: one-way ANOVA, Tukey’s post hoc test; *comparison IL-1α versus control, #comparison IL-1α plus treatments versus IL-1α. */#P < 0.05, **/##P < 0.01, ***/###P < 0.001, ****/####P < 0.0001, significantly different between groups. See SI Appendix, Fig. S2D for subpanels S2D, S2F, and S2H with bar diagrams and all data points.
Fig. 3.
Fig. 3.
Rarefied F-actin cytoskeleton in IL-1α–exposed porcine articular chondrocytes and human OA cartilage. (A) Representative confocal fluorescent micrographs (confocal slice) of porcine articular chondrocytes; cytoskeleton with F-actin is visualized. (B) Quantitation of fluorescence intensity (arbitrary units, a.u.) of F-actin (phalloidin labeling); also see Materials and Methods and SI Appendix, Fig. S1. IL-1α exposure significantly diminished F-actin, and Piezo inhibition with GsMTx4/dynasore completely rescued the rarefication of the F-actin network. The numbers indicate the number of cells analyzed, with three independent isolations of primary chondrocytes for each group. (C) Quantitation of fluorescence intensity of F-actin as in B. IL-1α exposure significantly diminished F-actin, and Piezo1-targeting siRNA significantly attenuated the rarefication of the F-actin network. The numbers indicate the number of cells analyzed, with four independent isolations of primary chondrocytes for each group. Representative confocoal fluorescent micrograph (z-stack) is shown below. (D) Quantitation of fluorescence intensity of F-actin as in B. Short-term treatment with Piezo1-activating compound Yoda-1 (10 µM, 30 min) significantly diminished F-actin. The numbers indicate the number of cells analyzed, with four independent isolations of primary chondrocytes for each group. Representative confocoal fluorescent micrograph (z-stack) is shown below. (E) Representative confocal fluorescent micrographs of human cartilage (confocal slice), healthy (normal) versus osteoarthritic (OA); cytoskeleton with F-actin is visualized. F-actin was significantly decreased in OA. The numbers indicate number of cells analyzed. (F) Strain of control, IL-1α–treated, and IL-1α/GsMTx4/dynasore–treated porcine chondrocytes. IL-1α–treated cells (1 ng/mL) have significantly higher strain than vehicle-treated cells. Note complete restitution to lower strain when inhibiting Piezo with GsMTx4/dynasore in IL-1α–treated chondrocytes. The numbers indicate number of cells analyzed from three independent isolations of primary chondrocytes for each group. The bars represent mean ± SEM; for group comparison, B, C, and E: one-way ANOVA, Tukey’s post hoc test; *comparison IL-1α versus control, #comparison IL-1α plus GsMtx4/Dyn versus IL-1α. */#P < 0.05, **/##P < 0.01, and ***/###P < 0.001, significantly different between groups. Group comparison D: t test; *P < 0.05, ****P < 0.0001, significantly different between groups. (Scale bars in A, C, D, and E, 10 µm.)
Fig. 4.
Fig. 4.
Identification of IL-1α–induced signal transduction that results in increased PIEZO1 gene expression by delimited screening in porcine articular chondrocytes. (A) Inhibitors of p38 MAP-kinase significantly attenuated IL-1α–induced PIEZO1-mRNA increase in primary chondrocytes (IL-1α 1 ng/mL for 3 d, for all panels) but not inhibitors of MAP-kinases, JNK, MEK-ERK, and PI3K. (B) Western blot analysis of p38 phosphorylation indicates a significant increase of phospho-p38; total p38 does not change. (C) Starting with 96 TFs, their activation was assessed in response to IL-1α treatment; increased x-fold over baseline, ranked, and top 25 are shown here. Note the green dotted line at 4×, with 19 of the top 25 TFs ≥4. Below the bar diagram, labeled “MULAN”, note binary score (+/−) indicating whether the respective TF was found to have a predicted binding site in the proximal PIEZO1 promoter (see E, also SI Appendix, Fig. S6) using MULAN TF-binding prediction program. Indicated below, labeled “Inhibitor,” is whether the respective TF can be inhibited with a well-established selective small-molecule inhibitor compound. The two red arrows point toward the two TFs that fulfill all criteria, ATF2 and HNF4. (D) TFs that impact IL-1α–induced PIEZO1-mRNA increase were identified using selective compounds. HNF4 and ATF2/CREBP (the latter having the same DNA binding site as ATF2, known to form TF complexes) were confirmed as relevant; HIF, NFAT, and NFkB were not found to be involved. Inhibitors of ATF2/CREBP1 and HNF4 significantly attenuated PIEZO1-mRNA increase. The dose–response relationship of ATF2/CREBP1 inhibitor CBP30 showed a Pearson correlation coefficient = −0.85, P = 0.0008, indicating a significant correlation. The respective metrics for HNF4 inhibitor BI6015 were Pearson correlation coefficient = −0.86, P = 0.0014, also indicative of a signification correlation. (E) A schematic of predicted binding sites of HNF4 and ATF2/CREBP1 TFs in the proximal PIEZO1 promoter, as revealed by the bioinformatics platform MULAN. Please see also SI Appendix, Fig. S6. (F) Direct CREBP1 binding to the PIEZO1 promoter was assessed by chromatin immunoprecipitation followed by qPCR. Note fivefold increased abundance with IL-1α signaling versus control, indicative of direct CREBP1 binding to the PIEZO1 proximal promoter site indicated in E (yellow bar, between 0 and +500 PIEZO1 promoter). For A, B, D, and F, the numbers in bars indicate number of independent isolations of primary chondrocytes. The bars represent mean ± SEM; for group comparison B and F, t test, *P < 0.05; for group comparisons A and D, one-way ANOVA, Tukey’s post hoc test; *comparison IL-1α versus control, #comparison IL-1α plus treatment versus IL-1α. */#P < 0.05.
Fig. 5.
Fig. 5.
Feed-forward pathogenesis of OA relying on chondrocytic inflammatory signaling, which results in Piezo1 increased function. A schematic of our findings and proposed OA pathogenetic mechanism. Signaling hubs and their consequences, upon activation as we demonstrate, are shown as a sequence 1 to 6. Shown in black letters, 1 to 6 is supported by our findings and known background. We interpret the result as “hypermechanotransduction & increased cellular damage,” in purple and speculate, in blue, that a loosened/rarefied F-actin may enhance p38 phosphorylation by making p38 more available for kinases.

Comment in

References

    1. Zhang Y., Jordan J. M., Epidemiology of osteoarthritis. Clin. Geriatr. Med. 26, 355–369 (2010). - PMC - PubMed
    1. Guilak F., Biomechanical factors in osteoarthritis. Best Pract. Res. Clin. Rheumatol. 25, 815–823 (2011). - PMC - PubMed
    1. Deveza L. A., Loeser R. F., Is osteoarthritis one disease or a collection of many? Rheumatology (Oxford) 57 (suppl. 4), iv34–iv42 (2018). - PMC - PubMed
    1. Van Spil W. E., Kubassova O., Boesen M., Bay-Jensen A. C., Mobasheri A., Osteoarthritis phenotypes and novel therapeutic targets. Biochem. Pharmacol. 165, 41–48 (2019). - PubMed
    1. Karsdal M. A., et al. ., Disease-modifying treatments for osteoarthritis (DMOADs) of the knee and hip: Lessons learned from failures and opportunities for the future. Osteoarthritis Cartilage 24, 2013–2021 (2016). - PubMed

Publication types

MeSH terms