

Erianthridin suppresses non-small-cell lung cancer cell metastasis through inhibition of Akt/mTOR/p70S6K signaling pathway
- PMID: 33758209
- PMCID: PMC7987990
- DOI: 10.1038/s41598-021-85675-8
Erianthridin suppresses non-small-cell lung cancer cell metastasis through inhibition of Akt/mTOR/p70S6K signaling pathway
Abstract
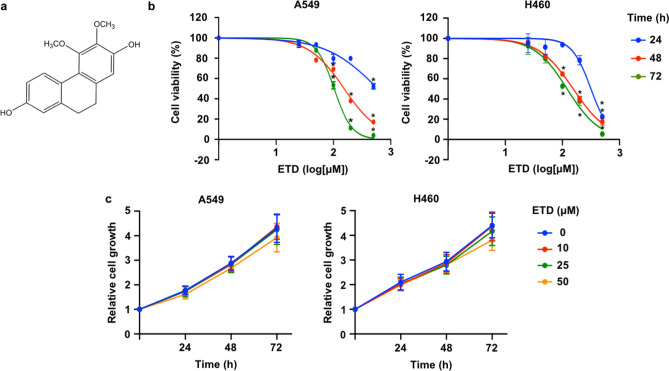
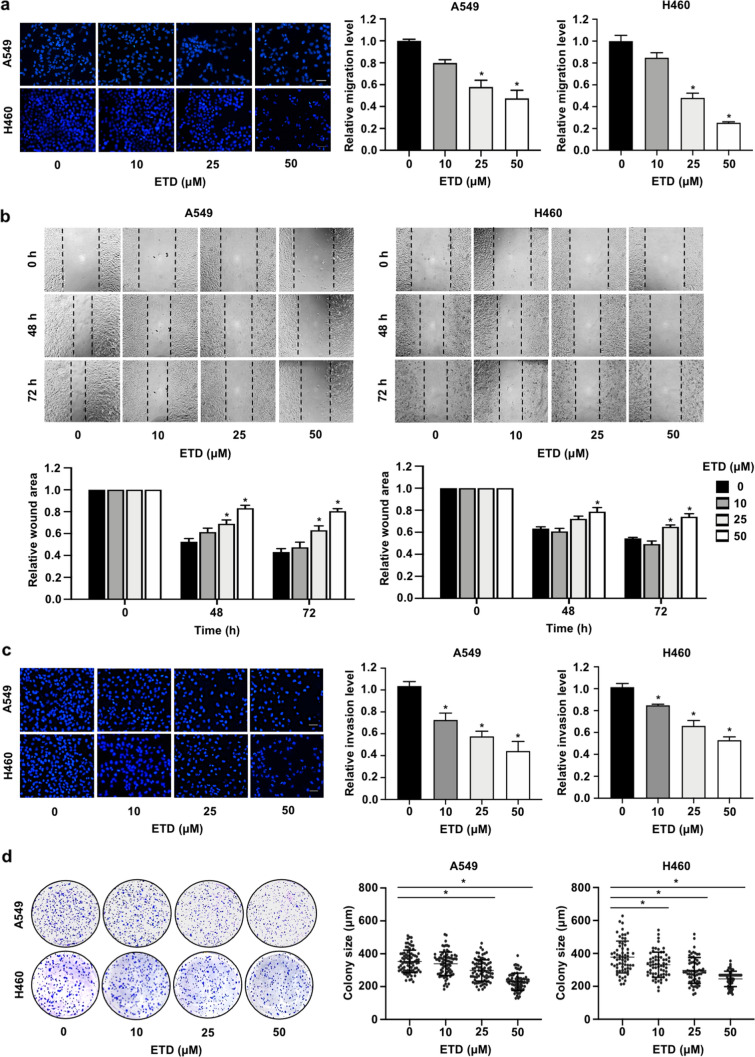
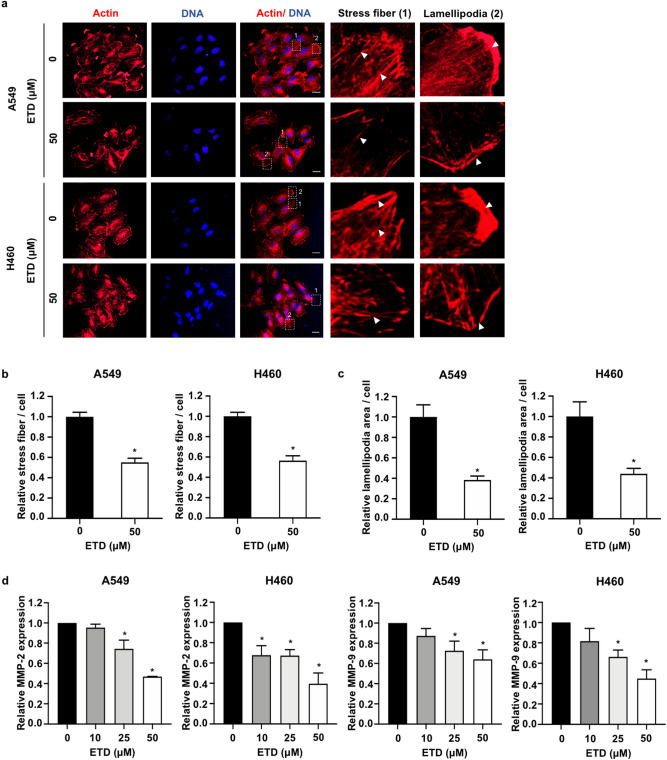
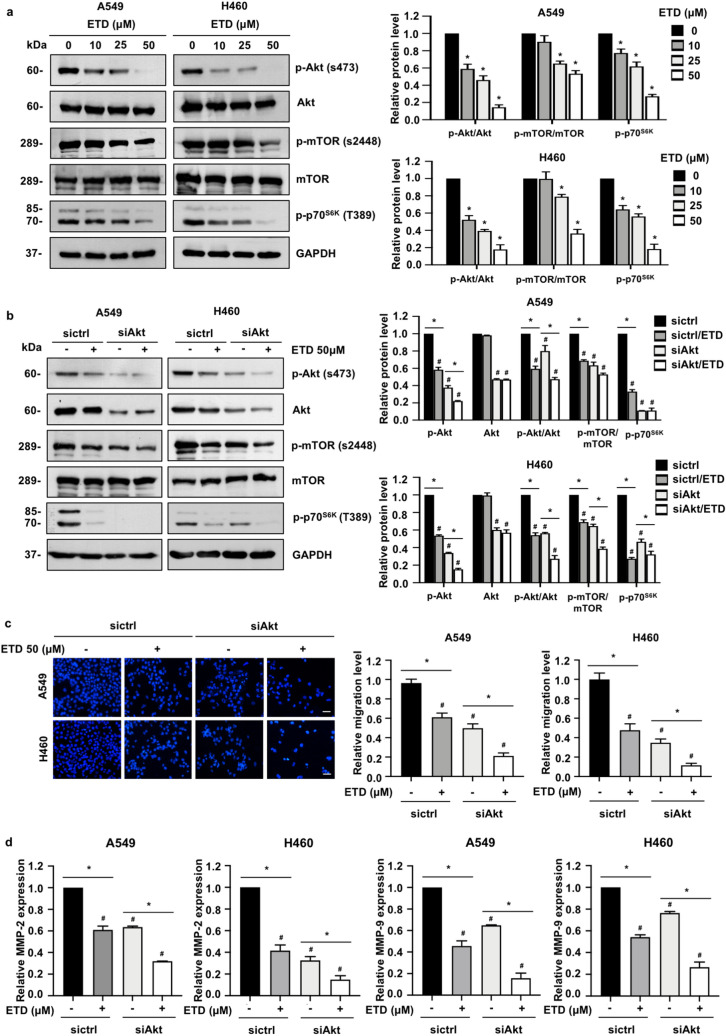
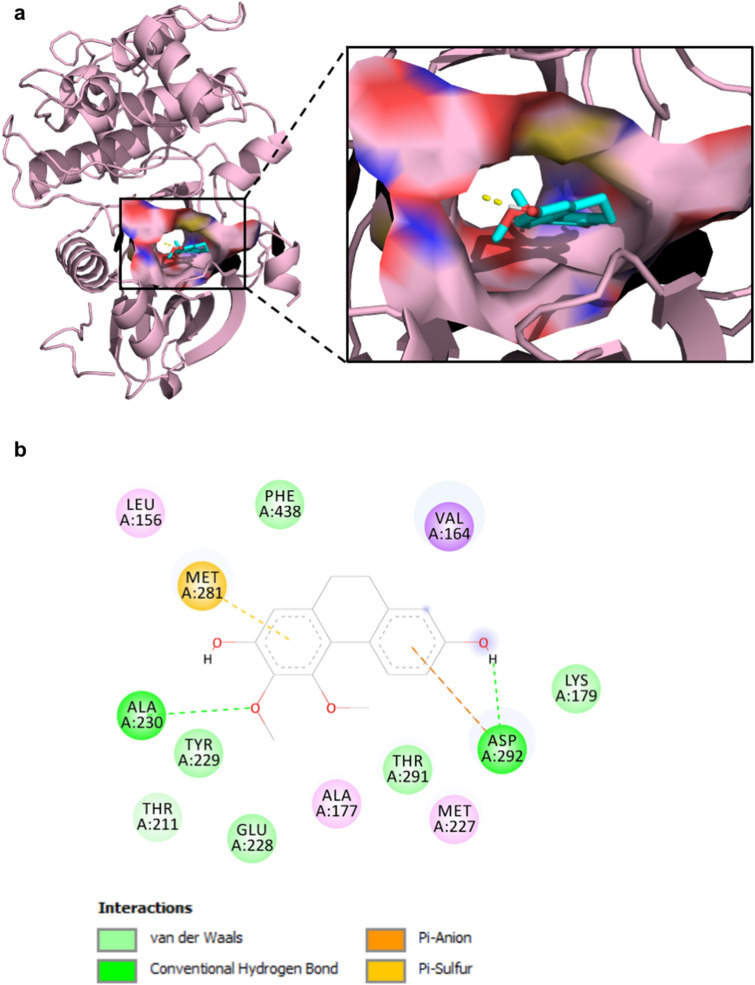
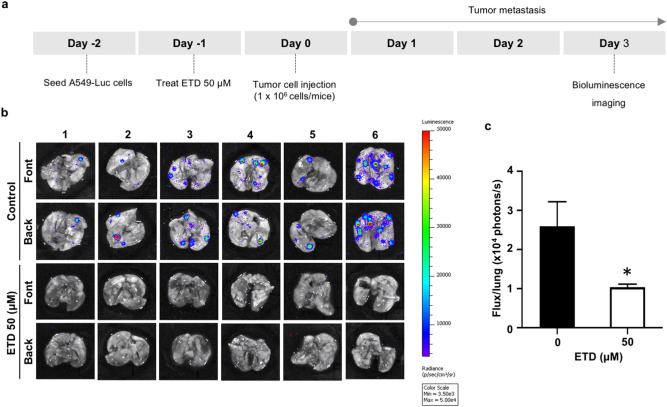
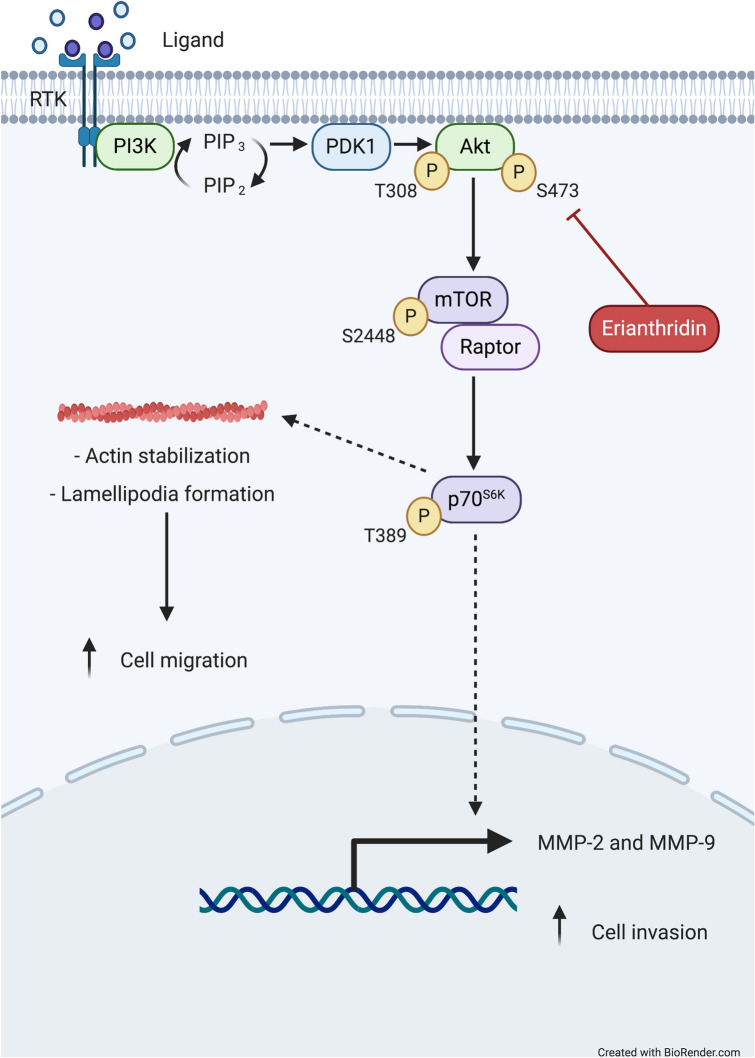
Cancer metastasis is a major cause of the high mortality rate in lung cancer patients. The cytoskeletal rearrangement and degradation of extracellular matrix are required to facilitate cell migration and invasion and the suppression of these behaviors is an intriguing approach to minimize cancer metastasis. Even though Erianthridin (ETD), a phenolic compound isolated from the Thai orchid Dendrobium formosum exhibits various biological activities, the molecular mechanism of ETD for anti-cancer activity is unclear. In this study, we found that noncytotoxic concentrations of ETD (≤ 50 μM) were able to significantly inhibit cell migration and invasion via disruption of actin stress fibers and lamellipodia formation. The expression of matrix metalloproteinase-2 (MMP-2) and MMP-9 was markedly downregulated in a dose-dependent manner after ETD treatment. Mechanistic studies revealed that protein kinase B (Akt) and its downstream effectors mammalian target of rapamycin (mTOR) and p70 S6 kinase (p70S6K) were strongly attenuated. An in silico study further demonstrated that ETD binds to the protein kinase domain of Akt with both hydrogen bonding and van der Waals interactions. In addition, an in vivo tail vein injection metastasis study demonstrated a significant effect of ETD on the suppression of lung cancer cell metastasis. This study provides preclinical information regarding ETD, which exhibits promising antimetastatic activity against non-small-cell lung cancer through Akt/mTOR/p70S6K-induced actin reorganization and MMPs expression.
Conflict of interest statement
The authors declare no competing interests.
Figures
Similar articles
-
Extracellular ATP-induced proliferation of adventitial fibroblasts requires phosphoinositide 3-kinase, Akt, mammalian target of rapamycin, and p70 S6 kinase signaling pathways.J Biol Chem. 2005 Jan 21;280(3):1838-48. doi: 10.1074/jbc.M409466200. Epub 2004 Nov 1. J Biol Chem. 2005. PMID: 15522879
-
p70 S6 kinase in the control of actin cytoskeleton dynamics and directed migration of ovarian cancer cells.Oncogene. 2011 May 26;30(21):2420-32. doi: 10.1038/onc.2010.615. Epub 2011 Jan 24. Oncogene. 2011. PMID: 21258406
-
S6K Promotes Dopaminergic Neuronal Differentiation Through PI3K/Akt/mTOR-Dependent Signaling Pathways in Human Neural Stem Cells.Mol Neurobiol. 2016 Aug;53(6):3771-3782. doi: 10.1007/s12035-015-9325-9. Epub 2015 Jul 5. Mol Neurobiol. 2016. PMID: 26143260
-
Akt-RSK-S6 kinase signaling networks activated by oncogenic receptor tyrosine kinases.Sci Signal. 2010 Aug 24;3(136):ra64. doi: 10.1126/scisignal.2000998. Sci Signal. 2010. PMID: 20736484 Free PMC article.
-
p70 S6 kinase as a therapeutic target in cancers: More than just an mTOR effector.Cancer Lett. 2022 Jun 1;535:215593. doi: 10.1016/j.canlet.2022.215593. Epub 2022 Feb 14. Cancer Lett. 2022. PMID: 35176419 Review.
Cited by
-
Active Compounds with Medicinal Potential Found in Maxillariinae Benth. (Orchidaceae Juss.) Representatives-A Review.Int J Mol Sci. 2023 Jan 1;24(1):739. doi: 10.3390/ijms24010739. Int J Mol Sci. 2023. PMID: 36614181 Free PMC article. Review.
-
Targeting extracellular matrix through phytochemicals: a promising approach of multi-step actions on the treatment and prevention of cancer.Front Pharmacol. 2023 Jul 25;14:1186712. doi: 10.3389/fphar.2023.1186712. eCollection 2023. Front Pharmacol. 2023. PMID: 37560476 Free PMC article. Review.
-
Targeting the PI3K/AKT/mTOR Signaling Pathway in Lung Cancer: An Update Regarding Potential Drugs and Natural Products.Molecules. 2021 Jul 5;26(13):4100. doi: 10.3390/molecules26134100. Molecules. 2021. PMID: 34279440 Free PMC article. Review.
-
Oncogenic Functions of Alternatively Spliced MDM2-ALT2 Isoform in Retroperitoneal Liposarcoma.Int J Mol Sci. 2024 Dec 17;25(24):13516. doi: 10.3390/ijms252413516. Int J Mol Sci. 2024. PMID: 39769278 Free PMC article.
-
Combinatorial effects of cannabinoid receptor 1 and 2 agonists on characteristics and proteomic alteration in MDA-MB-231 breast cancer cells.PLoS One. 2024 Nov 11;19(11):e0312851. doi: 10.1371/journal.pone.0312851. eCollection 2024. PLoS One. 2024. PMID: 39527598 Free PMC article.
References
Publication types
MeSH terms
Substances
LinkOut - more resources
Full Text Sources
Other Literature Sources
Molecular Biology Databases
Miscellaneous
