. 2021 Mar 23;11(1):6617.
doi: 10.1038/s41598-021-84278-7.

PINK1 deficiency impairs adult neurogenesis of dopaminergic neurons

Affiliations

PINK1 deficiency impairs adult neurogenesis of dopaminergic neurons

Sarah J Brown et al. Sci Rep. .

Abstract

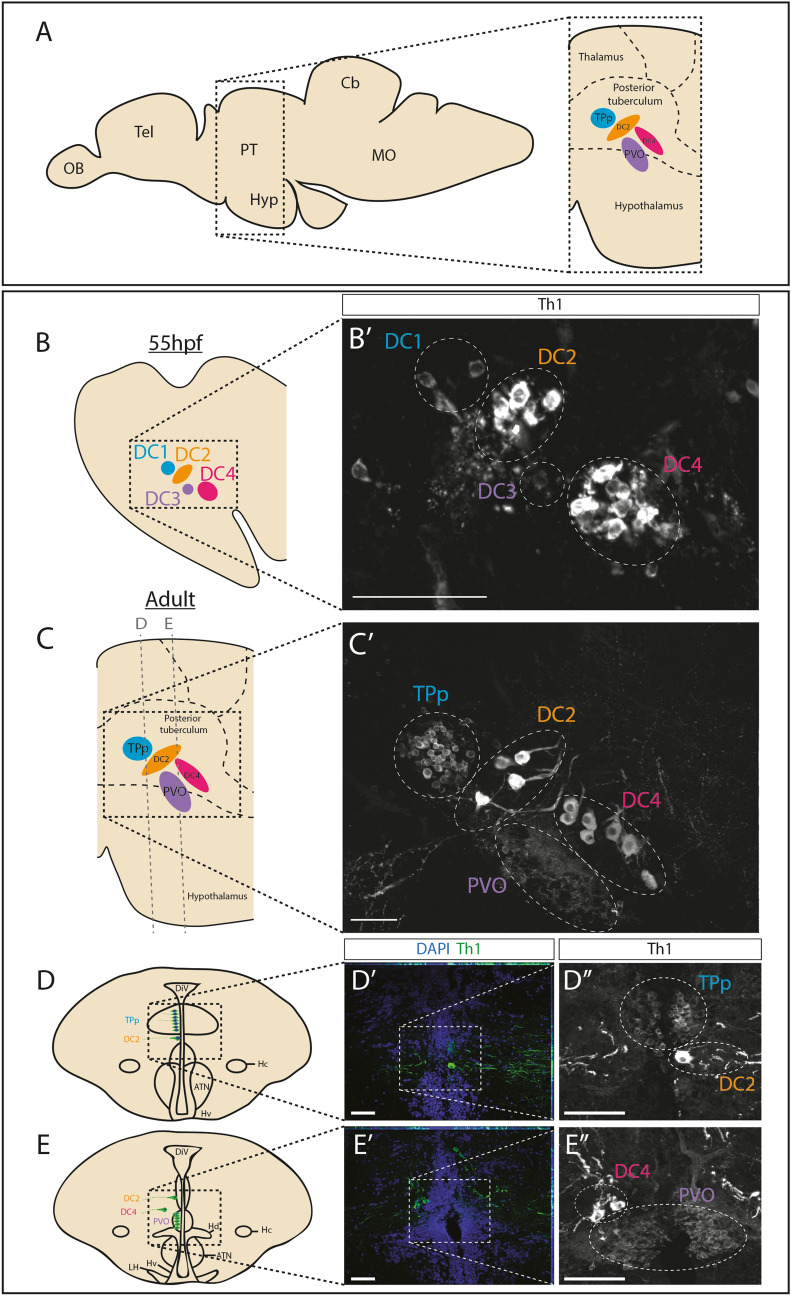
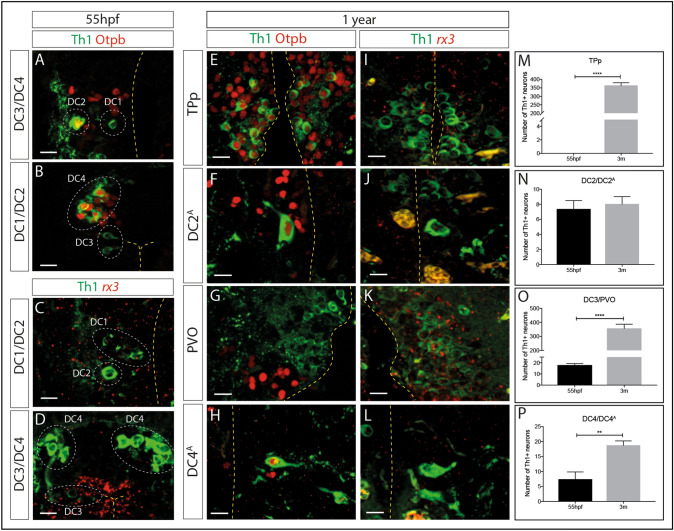
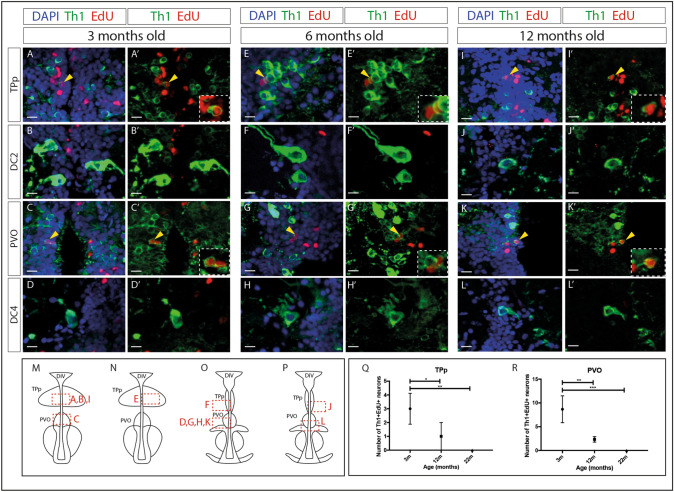
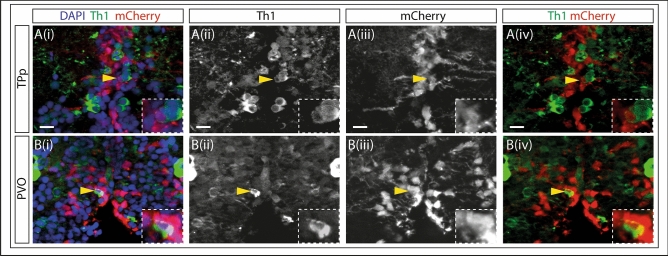
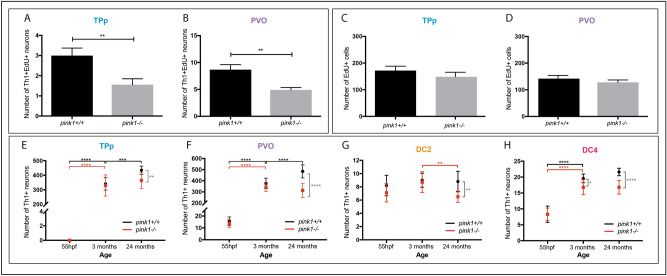
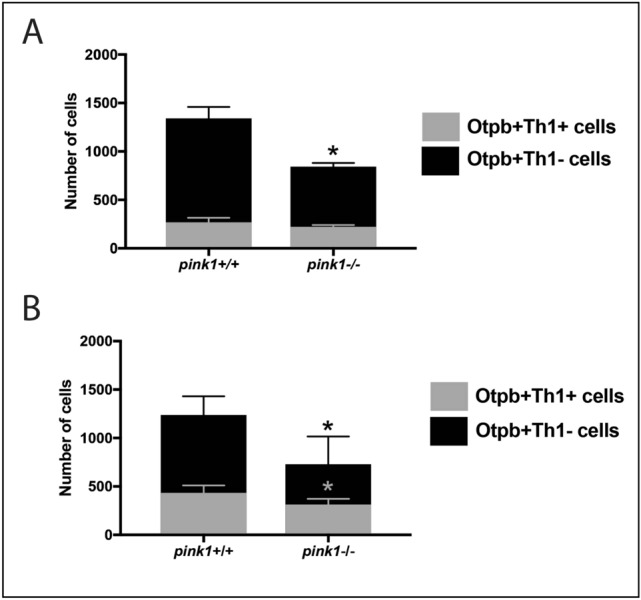
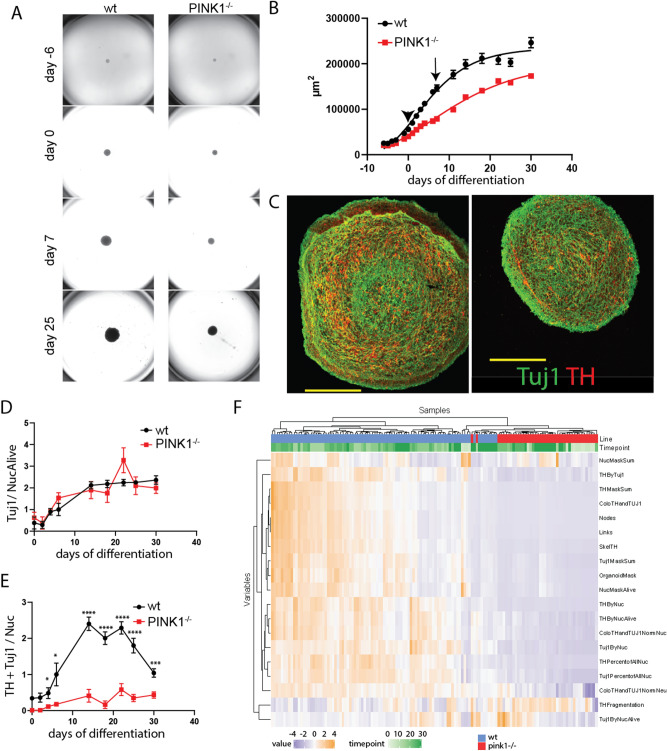
Recent evidence suggests neurogenesis is on-going throughout life but the relevance of these findings for neurodegenerative disorders such as Parkinson's disease (PD) is poorly understood. Biallelic PINK1 mutations cause early onset, Mendelian inherited PD. We studied the effect of PINK1 deficiency on adult neurogenesis of dopaminergic (DA) neurons in two complementary model systems. Zebrafish are a widely-used model to study neurogenesis in development and through adulthood. Using EdU analyses and lineage-tracing studies, we first demonstrate that a subset of ascending DA neurons and adjacent local-projecting DA neurons are each generated into adulthood in wild type zebrafish at a rate that decreases with age. Pink1-deficiency impedes DA neurogenesis in these populations, most significantly in early adult life. Pink1 already exerts an early effect on Th1+ progenitor cells rather than on differentiated DA neurons only. In addition, we investigate the effect of PINK1 deficiency in a human isogenic organoid model. Global neuronal differentiation in PINK1-deficient organoids and isogenic controls is similar, but PINK1-deficient organoids display impeded DA neurogenesis. The observation of impaired adult dopaminergic neurogenesis in Pink1 deficiency in two complementing model systems may have significant consequences for future therapeutic approaches in human PD patients with biallelic PINK1 mutations.


Conflict of interest statement

JJ and JCS are co-founders and shareholders of the biotech company OrganoTherapeutics. No other conflicts of interest.

Figures

Figure 1
Figure 1
DA populations in the embryonic and adult zebrafish posterior tuberculum (PT). (A) Schematic side view of an adult zebrafish brain. The boxed region indicates location of the PT and highlights the DA populations examined in this study (right) (TPp in blue, DC2 in orange, PVO in purple, DC4 in magenta). (B–C′) DA neurons can be assigned to particular populations on the basis of size and position: DC1/TPp, DC2, DC3/PVO and DC4. (B) Schematic showing DC1 (blue), DC2 (orange), DC3 (purple) and DC4 (magenta) DA populations of the embryonic PT. (B′) Immunohistochemical analysis for Th1 in a representative sagittal section taken through a wild type 55hpf zebrafish brain. DA populations are circled with a dotted line and labelled with colour coding outlined in (B). (C) Schematic showing the TPp (blue), DC2 (orange), PVO (purple) and DC4 (magenta) DA populations of the adult PT. Lines indicate planes of sections shown in (DE″). (C′) Immunohistochemical analysis for Th1 in a representative sagittal section taken through a wild type 12 month brain. DA populations are circled with a dotted line and labelled with colour coding outlined in (A,C). DC2-derived neurites can be detected ventral to DAPI-stained DC2 nuclei. (D–E″) DA populations in the adult zebrafish brain in transverse sections allow robust quantification of adult populations. Schematics of transverse sections taken through an adult zebrafish brain showing DA neurons (green) in the TPp and DC2 populations (D) or in PVO and DC4 populations (E). Immunohistochemical analyses for Th1 (green) with DAPI counter-staining (blue) shows the TPp and DC2 populations (D′) and the PVO, DC2 and DC4 populations (E′). (D″,E″) Magnified image of boxed regions in schematics (D′,E′) shown without DAPI. DA populations are circled with a dotted line and labeled with colour coding outlined in (A,C). Yellow dashed line indicates ventricle. Scale bars: 50 μm. Schematics in (D,E) are based on anatomical drawings by Rink and Wullimann.
Figure 2
Figure 2
Expression of Otp and rx3 in the embryonic and adult zebrafish posterior tuberculum (PT). (A-L) Immunohistochemical analysis for Th1 (green) and Otp (red) in representative transverse sections of 55hpf (A,B) or 12 month old (EH) wild type zebrafish, or immunohistochemical analysis for Th1 (green) and rx3 (red) in transverse sections of 55hpf (C,D) or 12-month old (IL) wild type zebrafish. Otp+Th1+ DA neurons are detected in DC2 (B) and DC4 (D) populations in the 55hpf embryo, whereas DA neurons in DC1 (A) and DC3 (C) populations are not Otp+. In the 12 month old zebrafish, Otp+Th1+ DA neurons are detected in the TPp (E), DC2A (F) and DC4A (H) populations but DA neurons in the PVO are not Otp+ (G). rx3+ is highly expressed in DC3 (D) neurons but barely detected in DC1, DC2 (C) or DC4 (D) neurons in the 55hpf embryo. In 12 month old zebrafish, rx3 is detected in PVO DA neurons (K) but barely detected in TPp (I), DC2A (J) or DC4A (L) DA neurons. Yellow dashed line marks the ventricle. Scale bars: 10 μm. (M–P) Quantitative analyses across entire populations show that the number of Th1+ DA neurons significantly increases between 55hpf and 3 months of age in the TPp (M) (t-test; p =  < 0.0001, n = 3 fish each) (as described in the text, we propose TPp DA neurons are not equivalent to DC1 DA neurons, therefore at 55hpf we started the TPp DA quantification at zero), the PVO (N) (t-test; p =  < 0.0001, n = 3 fish each) and the DC4 population (P) (t-test; p = 0.0026, n = 3 fish each). The number of DA neurons in the DC2 population does not significantly increase between 55hpf and 3 months (N) (t-test; p = 0.4918, n = 3 fish each).
Figure 3
Figure 3
DA neurons are generated in the PT in adulthood, but generation decreases with age. (A–L′) Immunohistochemical analysis for Th1 (green), ClickIT™ labeling for EdU (red) and counterstained with DAPI (blue) (A,B,C,D,E,F,G,H,I,J,K,L) or shown without DAPI (A′,B′,C′,D′,E′,F′,G′,H′,I′,J′,K′,L′) in representative transverse sections of 3 month (AD′)(n = 9 fish), 6 month (EH′)(n = 2 fish) or 12 month (IL′)(n = 3 fish) wild type zebrafish brains. Th1+EdU+ cells are detected in the TPp in 3 month (A,A′), 6 month (E,E′) and 12 month (I,I′) old brains, and in the PVO of 3 month (C,C′), 6 month (G,G′) and 12 month (K,K′) old brains. No EdU labelling was detected in DC2 neurons (B,B′,F,F′,J,J′) or DC4 neurons (D,D′,H,H′,L,L′). Yellow arrowheads point to double-positive cells and insets show magnified image of double-labeled cells. Yellow dashed line indicates ventricle. Scale bars: 10 μm. (M–P) Schematics indicating the position of images (AL′) within the PT, red boxes indicate position of the corresponding image in relation to the ventricle. Images in (AL′) are representative of sections across the entire A–P extent of each population; those chosen best highlight the distinct morphology of each neuronal population. (Q) Quantitative analyses through the entire population shows that the number of Th1+EdU+ cells in the TPp is decreased in 12 month fish (n = 3 fish) compared to 3 month fish (n = 9 fish) (two-way ANOVA, p = 0.0277), and further decreased in 22 month fish (n = 3 fish) compared to 3 month fish (two-way ANOVA, p = 0.0019). (R) The number of Th1+EdU+ cells in the PVO is decreased in 12 month fish (n = 3 fish) compared to 3 month fish (n = 9 fish) (two-way ANOVA, p = 0.0039), and further decreased in 22 month fish (n = 3 fish) compared to 3 month fish (two-way ANOVA, p = 0.0003). Schematic in (MP) is based on anatomical drawings by Rink and Wullimann.
Figure 4
Figure 4
DA neurons in the adult PVO are generated from Her4-expressing progenitors. (A–B) Fluorescent MIP of the PT of double transgenic (Tg(her4:ERT2CreERT2); Tg(ubi:loxGFPloxmCherry)) 3 month zebrafish injected with tamoxifen. Cell nuclei are labelled with DAPI (blue), DA neurons with Th1 (green) and Her4 progenitors with mCherry (red) throughout. Th1 is shown as a single channel in (ii), mCherry is shown in (iii). Th1 (green) and mCherry (red) are shown together in (iv). Boxed regions show magnified image of the double labelled cell. (Ai–iv) TPp: mCherry and Th1 mark adjacent cells but are not co-localised (yellow arrows). (Bi–iv) PVO: Double staining shows co-localisation of mCherry and Th1. The presence of mCherry + Th1 + cells in the PVO suggests that newly generated DA neurons are derived from Her4 progenitors in this neuronal subpopulation. Yellow dashed line indicates ventricle.
Figure 5
Figure 5
Adult generation of DA neurons is impeded in pink1-/- zebrafish. (A,B) Quantification of the number of newly generated Th1+EdU+ DA neurons in pink1+/+ and pink1-/- zebrafish shows a significant reduction in the TPp (A) (t-test, p = 0.0078, n = 9 for each) and in the PVO (B) (t-test, p = 0.0017, n = 9 fish for each) of 3 month pink1-/- zebrafish compared to pink1 + / + siblings. (C,D) No difference in the total number of EdU+ cells in the TPp (C) (t-test, p = 0.3431, n = 9 fish for each) and in the PVO (D) (t-test, p = 0.3640, n = 9 fish for each) in 3 month pink1-/- zebrafish compared to pink1+/+ siblings. (E) Quantification of DA neurons in the TPp shows an increase in the number of DA neurons in pink1+/+ zebrafish (black line) between 55hpf and 3 months (two-way ANOVA, p =  < 0.001, n = 10 fish for each) and between 3- and 24 months (two-way ANOVA, p = 0.0001, n = 10 fish for each). In pink1-/- zebrafish, the number of DA neurons increases between 55hpf and 3 months (two-way ANOVA, p =  < 0.001, n = 10 fish for each), but not between 3- and 24 months (two-way ANOVA, p = 0.4587, n = 10 fish for each). pink1-/- zebrafish (red line) have significantly fewer DA neurons in the TPp at 24 months (two-way ANOVA, p = 0.0065, n = 10 fish for each) but not at 55hpf (two-way ANOVA, p =  > 0.9999, n = 10 fish for each) or at 3 months (two-way ANOVA, p = 0.9917, n = 10 fish for each). (F) Quantification of DA neurons in the PVO shows in pink1+/+ zebrafish (black line), the number of DA neurons significantly increases between 55hpf and 3 months (two-way ANOVA, p =  < 0.0001, n = 10 fish for each) and between 3 and 24 months (two-way ANOVA, p =  < 0.0001, n = 10 fish for each). In pink1-/- zebrafish (red line), the number of DA neurons significantly increases between 55hpf and 3 months (two-way ANOVA, p =  < 0.0001, n = 10 fish for each) but not between 3 and 24 months. pink1-/- zebrafish have significantly fewer DA neurons than pink1+/+ zebrafish in the PVO at 24 months of age (two-way ANOVA, p =  < 0.0001, n = 10 fish for each) fish fish fish fish fish fish fish fish fish fish fish eachfish eachfish eachfish each(G) Quantification of DA neurons in the DC2 population shows pink1+/+ zebrafish (black line), the number of DA neurons does not significantly increase between 55hpf and 3 months, or between 3 and 24 months. In pink1-/- zebrafish (red line), the number of DA neurons does not significantly increase between 55hpf and 3 months, but significantly decreases between 3 and 24 months (two-way ANOVA, p = 0.0077, n = 10 fish for each). pink1-/- zebrafish have significantly fewer DA neurons than pink1 + / + zebrafish in the TPp at 2-years of age (two-way ANOVA, p = 0.0065, n = 10 fish for each). (H) Quantification of DA neurons in the DC4 population shows in pink1+/+ zebrafish (black line), the number of DA neurons significantly increases between 55hpf and 3 months (two-way ANOVA, p =  < 0.0001, n = 10 fish for each) but not between 3 and 24 months. In pink1-/- zebrafish (red line), the number of DA neurons significantly increases between 55hpf and 3 months (two-way ANOVA, p =  < 0.0001, n = 10 fish for each) but not between 3 and 24 months. pink1-/- zebrafish have significantly fewer DA neurons than pink1+/+ zebrafish in the PVO at 3 months (two-way ANOVA, p = 0.0308, n = 10 fish for each) and even more so at 24 months of age (two-way ANOVA, p =  < 0.0001, n = 10 fish for each).
Figure 6
Figure 6
Reduced population of Otp+ progenitors in the TPp of pink1-/- zebrafish at 3 months and 24 months of age. (A) Quantification of the number of Otp+Th1- progenitors and the number of Otp+Th1+ DA neurons in the TPp at 3 months shows a significant reduction in the number of Otp+Th1- progenitors in the pink1-/- zebrafish compared to pink1+/+ zebrafish (t-test, p = 0.0292, n = 2 fish for each), but no significant difference in the number of Otp+Th1+ DA neurons. (B) Quantification of the number of Otp+Th1- progenitors and the number of Otp+Th1+ DA neurons in the TPp at 24 months shows a significant reduction in the number of Otp+Th1- progenitors in the pink1-/- zebrafish compared to pink1+/+ zebrafish (t-test, p = 0.0259, n = 4 fish for each), and in the number of Otp+Th1+ DA neurons (t-test, p = 0.0453, n = 4 fish for each).
Figure 7
Figure 7
Impaired dopaminergic differentiation in human pink1-/- midbrain-specific organoids. (A) Representative bright field images of midbrain-specific organoids at different time points of differentiation. (B) Quantification of the size of the organoids by measuring their area in the images shown in (A). Arrow head indicates start of differentiation and arrow indicates start of maturation. Data points represent mean ± SEM. N = 3 independent generations of organoids, each starting with 48 organoids/line. (C) Representative images of day 30 midbrain-specific organoids sections (wt left, pink1-/- right) stained for Tuj1 (green) and TH (red). (D) Quantification of neuronal content of organoid sections measured as sum of Tuj1 positive pixels (neuronal marker) normalized by Hoechst positive pixels (nucleus marker) at day 0, 2, 4, 6, 14, 18, 22, 25, and 30 of differentiation. (E) Quantification of dopaminergic neuronal content measured as sum of Tuj1/TH double positive pixels normalized by Hoechst positive pixels. Data points represent mean ± SEM. P values are calculated by two-tailed Mann–Whitney-test. N = 3 independent generations of organoids, *p < 0.05, ***p < 0.001 ****p < 0.0001. (F) Heatmap displaying the features extracted from the image analysis and cluster analysis.

References

    1. Valente EM, Abou-Sleiman PM, Caputo V, Muqit MMK, Harvey K, Gispert S, Ali Z, Del Turco D, Bentivoglio AR, Healy DG, et al. Hereditary early-onset Parkinson’s disease caused by mutations in PINK1. Science. 2004;304:1158–1160. doi: 10.1126/science.1096284. - DOI - PubMed
    1. Gandhi S, Muqit MMK, Stanyer L, Healy DG, Abou-Sleiman PM, Hargreaves I, Heales S, Ganguly M, Parsons L, Lees AJ, et al. PINK1 protein in normal human brain and Parkinson’s disease. Brain. 2006;129:1720–1731. doi: 10.1093/brain/awl114. - DOI - PubMed
    1. Hoepken H-H, Gispert S, Morales B, Wingerter O, Del Turco D, Mülsch A, Nussbaum RL, Müller K, Dröse S, Brandt U, et al. Mitochondrial dysfunction, peroxidation damage and changes in glutathione metabolism in PARK6. Neurobiol. Dis. 2007;25:401–411. doi: 10.1016/j.nbd.2006.10.007. - DOI - PubMed
    1. Deas E, Plun-Favreau H, Gandhi S, Desmond H, Kjaer S, Loh SHY, Renton AEM, Harvey RJ, Whitworth AJ, Martins LM, et al. PINK1 cleavage at position A103 by the mitochondrial protease PARL. Hum. Mol. Genet. 2011;20:867–879. doi: 10.1093/hmg/ddq526. - DOI - PMC - PubMed
    1. Okatsu K, Oka T, Iguchi M, Imamura K, Kosako H, Tani N, Kimura M, Go E, Koyano F, Funayama M, et al. PINK1 autophosphorylation upon membrane potential dissipation is essential for Parkin recruitment to damaged mitochondria. Nat. Commun. 2012;3:1016. doi: 10.1038/ncomms2016. - DOI - PMC - PubMed

Publication types