. 2021 Mar 23;11(1):6638.
doi: 10.1038/s41598-021-85875-2.

Multiwave pandemic dynamics explained: how to tame the next wave of infectious diseases

Affiliations

Multiwave pandemic dynamics explained: how to tame the next wave of infectious diseases

Giacomo Cacciapaglia et al. Sci Rep. .

Abstract

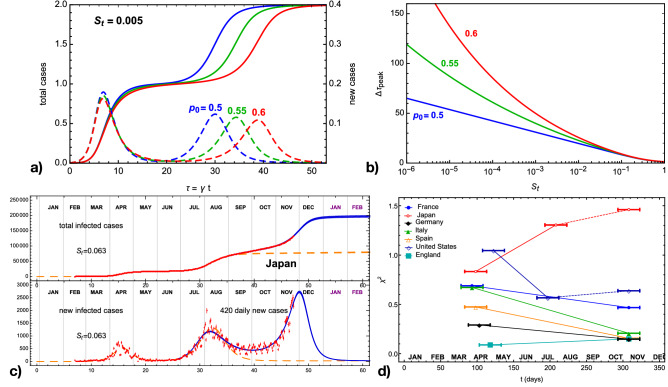
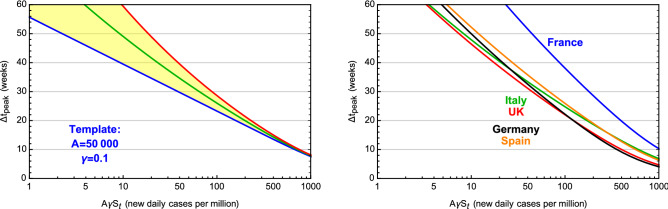
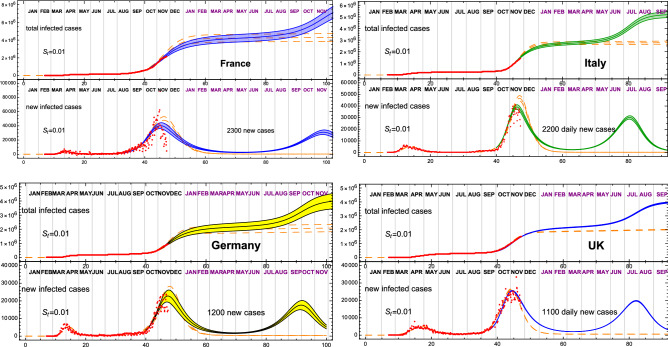
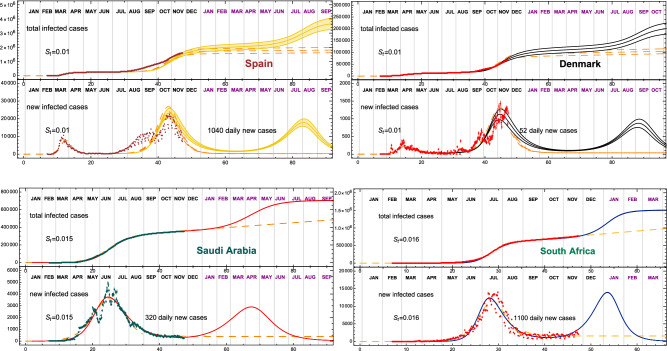
Pandemics, like the 1918 Spanish Influenza and COVID-19, spread through regions of the World in subsequent waves. Here we propose a consistent picture of the wave pattern based on the epidemic Renormalisation Group (eRG) framework, which is guided by the global symmetries of the system under time rescaling. We show that the rate of spreading of the disease can be interpreted as a time-dilation symmetry, while the final stage of an epidemic episode corresponds to reaching a time scale-invariant state. We find that the endemic period between two waves is a sign of instability in the system, associated to near-breaking of the time scale-invariance. This phenomenon can be described in terms of an eRG model featuring complex fixed points. Our results demonstrate that the key to control the arrival of the next wave of a pandemic is in the strolling period in between waves, i.e. when the number of infections grows linearly. Thus, limiting the virus diffusion in this period is the most effective way to prevent or delay the arrival of the next wave. In this work we establish a new guiding principle for the formulation of mid-term governmental strategies to curb pandemics and avoid recurrent waves of infections, deleterious in terms of human life loss and economic damage.


Conflict of interest statement

The authors declare no competing interests. All data used in this work are obtained from open-source repositories: Ourworldindata.org, Worldometer.info, Citypopulation.de, Data.gouv.fr, Toyokeizai.net.

Figures

Figure 1
Figure 1
Illustration and validation of the CeRG multiwave model. The panel (a) shows sample solutions of the CeRG multiwave equation for w=1, with δ1=0, so that the epidemic episode is extinguished after two waves. The total number of cases, normalised to the first peak, is shown in solid, while the normalised new cases are shown in dashed. In the panel (b) we show the dependence of the delay between the two peaks of new infections, Δτpeak measured in the local time, as a function of St. The CeRG parameters are fixed to the following values, unless specified: p0=0.5,p1=0.65,ζ1=0.5. Panel (c) shows the CeRG model applied to the second and third wave in Japan (blue) as compared to the data (red) and the eRG fits of the two waves (orange). In panel (d) we show the value of the geographical uniformity indicator as defined in the text for a sample of countries, showing that the virus is more equally spread in the various regions during the second wave, in most cases.
Figure 2
Figure 2
Strolling control to delay the next wave. Delay of the next peak (in real time weeks) as a function of the strolling severity, expressed in terms of the daily number of new infected cases per million inhabitants (AγSt). In the right panel, we show the results for the CeRG model applied to France, Italy, the UK, Germany and Spain. In the left panel we show the result for a template country with A=50,000 and γ=0.1. The band is given by varying p0 between 0.5 and 0.6.
Figure 3
Figure 3
Strolling as a precursor of a COVID-19 third wave. Most European countries are still undergoing a second wave of COVID-19. In this figure we show how a strolling period, consistent on a fixed number of new infections per day (indicated in each panel) could lead to a third wave, as indicated by the solid band. The prediction corresponds to St=0.01, and is compared to the data (adjourned to November 23) and the eRG fit from Table 1 (dashed orange). The plot includes France, Italy, Germany and the UK.
Figure 4
Figure 4
Strolling as a precursor of a new COVID-19 wave. The top panels shows Spain and Denmark, while the remaining European countries included in this study are shown in the Supplementary Information. In the bottom panels we show two sample countries from other regions of the World. In both cases, currently the epidemic is in the strolling regime after the first wave, indicating an imminent restart of the epidemic. In cases with an ongoing strolling, St is fitted to reproduce the data.

References

    1. Taubenberger JK, Morens DM. 1918 influenza: The mother of all pandemics. Rev. Biomed. 2006;17(1):69–79. doi: 10.32776/revbiomed.v17i1.440. - DOI - PMC - PubMed
    1. Kermack WO, McKendrick A, Walker GT. A contribution to the mathematical theory of epidemics. Proc. R. Soc. A. 1927;115:700–721. doi: 10.1098/rspa.1927.0118. - DOI
    1. Wang Z, Andrews MA, Wu Z-X, Wang L, Bauch CT. Coupled disease-behavior dynamics on complex networks: A review. Phys. Life Rev. 2015;15:1–29. doi: 10.1016/j.plrev.2015.07.006. - DOI - PMC - PubMed
    1. Perc M, et al. Statistical physics of human cooperation. Phys. Rep. 2017;687:1–51. doi: 10.1016/j.physrep.2017.05.004. - DOI
    1. Zhan X-X, et al. Coupling dynamics of epidemic spreading and information diffusion on complex networks. Appl. Math. Comput. 2018;332:437–448. doi: 10.1016/j.amc.2018.03.050. - DOI - PMC - PubMed

Publication types