. 2021 Mar;3(3):366-377.
doi: 10.1038/s42255-021-00361-3. Epub 2021 Mar 22.

Serine biosynthesis defect due to haploinsufficiency of PHGDH causes retinal disease

Affiliations

Serine biosynthesis defect due to haploinsufficiency of PHGDH causes retinal disease

Kevin Eade et al. Nat Metab. 2021 Mar.

Abstract

Macular telangiectasia type 2 (MacTel) is a progressive, late-onset retinal degenerative disease linked to decreased serum levels of serine that elevate circulating levels of a toxic ceramide species, deoxysphingolipids (deoxySLs); however, causal genetic variants that reduce serine levels in patients have not been identified. Here we identify rare, functional variants in the gene encoding the rate-limiting serine biosynthetic enzyme, phosphoglycerate dehydrogenase (PHGDH), as the single locus accounting for a significant fraction of MacTel. Under a dominant collapsing analysis model of a genome-wide enrichment analysis of rare variants predicted to impact protein function in 793 MacTel cases and 17,610 matched controls, the PHGDH gene achieves genome-wide significance (P = 1.2 × 10⁻¹³) with variants explaining ~3.2% of affected individuals. We further show that the resulting functional defects in PHGDH cause decreased serine biosynthesis and accumulation of deoxySLs in retinal pigmented epithelial cells. PHGDH is a significant locus for MacTel that explains the typical disease phenotype and suggests a number of potential treatment options.


Conflict of interest statement

Declaration of competing interests: All authors declare no competing interests.

Figures

Extended Data Fig. 1
Extended Data Fig. 1. Pedigrees segregating possibly pathogenic PHGDH variants
Three variants, given for each group, were analyzed for segregation with the disease in 5 families. The specific number, age, and result of genetic analysis is given for all family members who were available for clinical and genetic analyses. Filled, black symbols represent affected individuals, white symbols define unaffected family members and grey symbols depict family members with ambiguous diagnoses (maybe or maybe not affected). Ages of family members at the time of recruitment, when clinical diagnosis was determined, are given below each symbol. Wt, wild type allele; mut, the allele with the specific PHGDH variant.
Extended Data Fig. 2
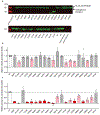
Extended Data Fig. 2. Example of western blots
a) Example western blots of overexpressed variants. Arrows indicated overexpressed protein (upper band, shifted from the FLAG-HA tag) and endogenous PHGDH protein (lower band). b) Relative expression of each PHGDH variant calculated from three independent experiments and normalized to corresponding WT expression in each blot. c) PHGDH enzymatic activity after correcting for endogenous activity and without normalizing for overexpressed variant protein abundance. Data for variants that retain less than 25% activity or expression are shown in red, between 25-75% activity or expression are shown in pink, and more than 75% activity or expression are shown in grey. Data are shown as the mean +/− SEM, n ≥ 3 independent experiments.
Extended Data Fig. 3
Extended Data Fig. 3. Relative gene expression
a) qPCR showing relative gene expression of enzymes from serine biosynthesis pathway. b) Schematic of the serine biosynthesis pathway from glucose showing metabolites (black) and enzymes/regulators (red). Data shown as the mean of three independently derived clones of wildtype (WT) and PHGDH p.Gly228TrpHET iPSC-RPE assayed in triplicate. Error bars +/− SEM. *p<0.05, **p<0.01 with unpaired two tailed t-test. c) Western blot of PHGDH and beta-actin loading control in WT and Gly228TrpHET iPSC-RPE clones. d) Relative protein levels of PHGDH normalized to beta-actin. Data shown as mean of 3 clones. Error bars +/− SEM. Unpaired two tailed t-test shows no difference.
Extended Data Fig. 4
Extended Data Fig. 4. Metabolite tracing
a) Schematic illustrating key metabolites in central carbon metabolism. b) % labeling of central carbon metabolites from [U-13C] glucose in cell pellet of iPSC-RPE. Points are the mean of three separately run wildtype iPSC-RPE samples. Error bars are +/− SEM. c) Schematic showing basal and apical secretion of metabolites from iPSC-RPE in transwells. d) Apical (blue) and basal (red) media measurements of serine from iPSC-RPE. e) Mean intracellular abundance of serine and glycine in wildtype iPSC-RPE. n=3 independent clones of wildtype iPSC-RPE. Error bars are +/− SEM.
Extended Data Fig. 5
Extended Data Fig. 5. Isotopologue distribution
a) Isotopologue Distribution of U-13C from glucose in serine and glycine. b) Relative abundance of 13C isotope in fully labeled serine (M3) and glycine (M2) from [U-13C6] glucose in cell culture media (secreted) between WT and PHGDH p.Gly228TrpHET iPSC-RPE over a period of 24 hours. (a,b) Data shown as the mean of nine WT and eight PHGDH p.Gly228Trp replicates from three independently derived clones. Error bars +/− SEM. *p>0.05, **p>0.01 with unpaired two-tailed T-test. (a) serine: M0 p=0.02, M2 p=0.04, M3 p=0.03; glycine: M0 p=0.0002, M1 p=0.052, M2 p=0.002. (b) serine p=0.03.
Extended Data Fig. 6
Extended Data Fig. 6. deoxySA/SA ratios
a) DeoxySA/SA ratios following 2, 4, and 8 days of culturing control iPSC-RPE in serine and glycine free media. Each time point run in triplicate. Error bars SEM. (b) Relative intracellular deoxySA/SA ratios in WT and PHGDH p.Gly228Trp iPSC-RPE following 2 days in serine and glycine free media. Data represented as mean of nine WT and eight PHGDH p.Gly228Trp replicates from three independently derived clones. (c) Relative intracellular deoxySA/SA ratios in control patient and HSAN1 patient iPSC-RPE following 2 days in serine and glycine free media. Data represented as the mean of five independently derived iPSC-RPE clones from two control patients and six independently derived iPSC-RPE clones from two HSAN1 patietns. Error bars SEM. **p<0.01 unpaired two-tailed T-test. (b) p=0.0002. (c) p=0.0015.
Figure 1.
Figure 1.. Collapsing analysis identifies PHGDH as a MacTel gene
(a) Quantile-quantile (QQ) plot for exome-wide gene-based collapsing analysis under the dominant genetic model with MAF<0001 and REVEL>0.5 filters. The y-axis represents the −log10 of the observed two-sided Fisher’s exact test (FET) p-values (sorted). The x-axis represents the −log10 of the permutation-based expected FET p-values (sorted). The red dots represent the data points, while the blue line is the diagonal with slope 1. The green and yellow lines represent permutation-based 95% confidence intervals. Data points falling outside the 97.5th percentile bound are labeled with corresponding gene symbols. PHGDH reached study (genome)-wide significance, SMIM8 association was borderline. (b) The top 10 genes from collapsing analyses under the same model are shown, including the exact numbers of all qualifying cases and controls and statistical calculations of association (OR and FET P).
Figure 2.
Figure 2.. PHGDH variants identified in MacTel patients disrupted enzyme function
(a) Schematic of human PHGDH domain structure indicating identified MacTel variants (red), known PHGDH-deficiency/NLS1 variants (black) –,,,– and variants found in both groups (purple). (b) Relative activity of PHGDH variants compared to wild type (WT) PHGDH. Assayed activity was corrected for endogenous PHGDH by subtracting the activity of the empty vector and then normalized to the protein expression of the exogenous variant. Data for variants that retain less than 25% activity are shown in red, between 25-75% activity are shown in pink, and more than 75% activity are shown in grey. Data are shown as the mean +/− SEM, n = 3 independent experiments. A schematic of the PHGDH enzymatic reaction is shown as an inset at the top of the graph. (c) Structural representation of the location of MacTel variants on the available partial PHGDH structure. Chain A is shown in white and chain B is shown in dark grey, with substrates and variants only shown on chain A. The substrates NADH and 3PG are shown in dark blue and cyan. MacTel variants are shown in red or grey according to their activity in panel b. (d) Zoomed in and rotated view of the PHGDH active site with chain B omitted for clarity.
Figure 3.
Figure 3.. PHGDH p.Gly228Trp variant decreases serine synthesis in RPE.
(a) Schematic illustrating [U-13C6] glucose tracing through central carbon metabolism, and the serine biosynthesis pathway in RPE. (b) Relative abundance of 13C isotope in fully labeled serine (M3) and glycine (M2) from [U-13C6] glucose in cell pellet (intracellular) between WT and PHGDH p.Gly228TrpHET iPSC-RPE (serine p=0.00035, glycine p=0.0013). (c) Relative intracellular metabolite abundance of total serine and glycine between WT and PHGDH p.Gly228Trp iPSC-RPE (serine p=0.0013). (d) Relative secretion flux of serine and glycine into media from RPE (serine p=0.0080). e) Intracellular percent labeling (% enrichment) of central carbon metabolites from [U-13C6] glucose of control and Gly228TrpHET iPSC-RPE. (f) Relative intracellular metabolite abundance of central carbon metabolites between WT and PHGDH p.Gly228Trp iPSC-RPE. (g) The rate of glucose uptake and lactate secretion in iPSC-RPE culture media during glucose tracing. (b-g) Data shown as the mean of at least 8 replicates from three independently derived WT or PHGDH p.Gly228Trp iPSC-RPE clones. Error bars +/− SEM. **p<0.01 ***p<0.001 unpaired two-tailed T-test. (h-k) Bioenergetic analysis of WT and PHGDH p.Gly228Trp iPSC-RPE in the absence of serine and glycine measuring glycolysis (h,i) and mitochondrial respiration (j,k). (h) ECAR measurement trace. (i) Basal ECAR represents the time point prior to oligo treatment, and maximal ECAR represents the third time point following Olig treatment. (j) OCR measurement trace. (k) Basal and maximal measurements are normalized to OCR output following R/A treatment. Basal OCR represents the time point prior to Olig treatment maximal OCR represents time point following FCCP treatment. Data shown as the mean of three independently derived clones of WT and PHGDH p.Gly228Trp iPSC-RPE. Each clone is the average of 12 independent measurements normalized to cell abundance +/− SEM.
Figure 4.
Figure 4.. HSAN1/MacTel linked SPTLC1 p.Cys133Tyr and PHGDH p.Gly228Trp variants elevate deoxySA in RPE.
(a) Schematic illustrating the synthesis of sphingolipids and deoxysphingolipids from serine and alanine. SPT condenses palmitoyl-CoA (Palm-CoA) with either serine or alanine to generate the canonical or deoxy forms of sphinganine (SA), dihydroceramide (DHCer), and ceramide (Cer). (b) Relative sphinganine (SA, blue), and deoxysphinganine (deoxySA, red) abundance in control iPSC-RPE following removal of serine and glycine from culture media. Each time point represents the mean of triplicate WT samples. Error bars +/− SEM. (c) Relative SA and deoxySA abundance in iPSC-RPE following 2 days in serine and glycine free media between WT and PHGDH p.Gly228Trp iPSC-RPE. Data shown as the mean of at least 8 replicates from three independently derived clones of WT and PHGDH p.Gly228Trp iPSC-RPE. Error bars +/− SEM. deoxySA p=0.014 unpaired two-tailed T-test.*p<0.05. (d) Relative SA and deoxySA abundance in iPSC-RPE derived from 2 control patients and two HSAN1 patients with SPTLC1 p.Cys133Tyr following 2 days in serine and glycine free media. Data represents at least 5 replicates from clones derived from two control patients and two HSAN1 patients. Error bars +/−SEM. deoxySA p=0.0025 unpaired two-tailed T-test. **p<0.01

Similar articles

Cited by

  • Dynamic lipid turnover in photoreceptors and retinal pigment epithelium throughout life.
    Lewandowski D, Sander CL, Tworak A, Gao F, Xu Q, Skowronska-Krawczyk D. Lewandowski D, et al. Prog Retin Eye Res. 2022 Jul;89:101037. doi: 10.1016/j.preteyeres.2021.101037. Epub 2021 Dec 29. Prog Retin Eye Res. 2022. PMID: 34971765 Free PMC article. Review.
  • High-throughput ultrastructural analysis of macular telangiectasia type 2.
    Zucker CL, Bernstein PS, Schalek RL, Lichtman JW, Dowling JE. Zucker CL, et al. Front Ophthalmol (Lausanne). 2024 Jul 30;4:1428777. doi: 10.3389/fopht.2024.1428777. eCollection 2024. Front Ophthalmol (Lausanne). 2024. PMID: 39140090 Free PMC article.
  • Cell-specific cis-regulatory elements and mechanisms of non-coding genetic disease in human retina and retinal organoids.
    Thomas ED, Timms AE, Giles S, Harkins-Perry S, Lyu P, Hoang T, Qian J, Jackson VE, Bahlo M, Blackshaw S, Friedlander M, Eade K, Cherry TJ. Thomas ED, et al. Dev Cell. 2022 Mar 28;57(6):820-836.e6. doi: 10.1016/j.devcel.2022.02.018. Epub 2022 Mar 17. Dev Cell. 2022. PMID: 35303433 Free PMC article.
  • Exome analysis links kidney malformations to developmental disorders and reveals causal genes.
    Milo Rasouly H, Krishna Murthy SB, Vena N, Povysil G, Beenken A, Verbitsky M, Shril S, Lekkerkerker I, Yang S, Khan A, Fasel D, Wongboonsin J, Martino J, Ke J, Elefant N, Tomar N, Harnof O, Kisselev S, Bheda S, Reytan-Miron S, Lim TY, Jamry-Dziurla A, Lugani F, Zhang JY, Marasa M, Kolupaeva V, Groopman EE, Jin G, Ghavami I, Stevens KO, Coughlin AC, Kil BH, Chatterjee D, Bradbury D, Zheng J, Mehl K, Morban M, Reingold R, Piva S, Mu X, Mittrori A, Szmigielska A, Gliwińska A, Ranghino A, Bomback AS, Badenski A, Latos-Bielenska A, Capone V, Materna-Kiryluk A, Amoroso A, Izzi C, La Scola C, Cohen DJ, Santoro D, Drozdz D, Fiaccadori E, Lin F, Scolari F, Tondolo F, La Manna G, Appel GB, Ghiggeri GM, Zaza G, Montini G, Masnata G, Krzemien G, Pisani I, Radhakrishnan J, Zachwieja K, Gesualdo L, Biancone L, Meneghesso D, Mizerska-Wasiak M, Tkaczyk M, Zaniew M, Borszewska-Kornacka MK, Szczepanska M, Saraga M, Rao MK, Bodria M, Miklaszewska M, Uy NS, Baraldi O, Bjanid O, Esposito P, Zamboli P, Marzuillo P, Canetta PA, Sikora P, Westland R, Crew RJ, Alam S, Guarino S, Negrisolo S, Hays T, Mane S, Grandinetti V, Tasic V, Lozanovski VJ, Caliskan Y, Goldstein D, Lifton RP, Ionita-Laza I, Kiryluk K… See abstract for full author list ➔ Milo Rasouly H, et al. Nat Commun. 2025 Aug 7;16(1):7290. doi: 10.1038/s41467-025-62319-3. Nat Commun. 2025. PMID: 40774958 Free PMC article.
  • Animal Models of Retinopathy of Prematurity: Advances and Metabolic Regulators.
    Maurya M, Liu CH, Bora K, Kushwah N, Pavlovich MC, Wang Z, Chen J. Maurya M, et al. Biomedicines. 2024 Aug 23;12(9):1937. doi: 10.3390/biomedicines12091937. Biomedicines. 2024. PMID: 39335451 Free PMC article. Review.

References

    1. Aung KZ, Wickremasinghe SS, Makeyeva G, Robman L & Guymer RH The prevalence estimates of macular telangiectasia type 2: the Melbourne Collaborative Cohort Study. Retina 30, 473–8 (2010). - PubMed
    1. Klein R et al. The prevalence of macular telangiectasia type 2 in the Beaver Dam eye study. Am J Ophthalmol 150, 55–62 e2 (2010). - PMC - PubMed
    1. Ronquillo CC, Wegner K, Calvo CM & Bernstein PS Genetic Penetrance of Macular Telangiectasia Type 2. JAMA Ophthalmol (2018). - PMC - PubMed
    1. Parmalee NL et al. Identification of a potential susceptibility locus for macular telangiectasia type 2. PLoS One 7, e24268 (2012). - PMC - PubMed
    1. Scerri TS et al. Genome-wide analyses identify common variants associated with macular telangiectasia type 2. Nat Genet 49, 559–567 (2017). - PubMed

Publication types