. 2018:214:13.
doi: 10.1007/s11214-017-0449-2. Epub 2017 Dec 6.

The Ionospheric Connection Explorer Mission: Mission Goals and Design

Affiliations

The Ionospheric Connection Explorer Mission: Mission Goals and Design

T J Immel et al. Space Sci Rev. 2018.

Abstract

The Ionospheric Connection Explorer, or ICON, is a new NASA Explorer mission that will explore the boundary between Earth and space to understand the physical connection between our world and our space environment. This connection is made in the ionosphere, which has long been known to exhibit variability associated with the sun and solar wind. However, it has been recognized in the 21st century that equally significant changes in ionospheric conditions are apparently associated with energy and momentum propagating upward from our own atmosphere. ICON's goal is to weigh the competing impacts of these two drivers as they influence our space environment. Here we describe the specific science objectives that address this goal, as well as the means by which they will be achieved. The instruments selected, the overall performance requirements of the science payload and the operational requirements are also described. ICON's development began in 2013 and the mission is on track for launch in 2017. ICON is developed and managed by the Space Sciences Laboratory at the University of California, Berkeley, with key contributions from several partner institutions.


Figures

Fig. 1
Fig. 1
Variations in vertical plasma drifts measured at the magnetic equator from the Jicamarca Radio Observatory during periods of low solar activity. After Alken et al. [2009].
Fig. 2
Fig. 2
The unique observational strategy of ICON is illustrated in a pass of the spacecraft where its combined measurements give a complete characterization of the dynamical coupling between the daytime ionosphere and thermosphere. The three locations of the illustrated spacecraft indicate steps in the orbit over a total of ~7 minutes. The image of the daytime ionosphere is obtained in the region where the line-of-sight wind speed observations cross.
Fig. 3
Fig. 3
Longitudinal variations in the nighttime FUV brightness of the equatorial ionospheric anomaly compared to the amplitude of predicted temperature variations driven by non-migrating diurnal tides at the equator. The FUV emissions originate from the F-layer of the ionosphere above 300 km (from IMAGE FUV (black) and TIMED GUVI (red)), while the temperature amplitudes from the Global Scale Wave Model are shown at 115 km (blue). After Immel et al., 2006.
Fig. 4
Fig. 4
Vectors show the difference in wind direction at 400 km altitude between a quiet and active run of a global I-T model from Maruyama et al. [2005], where colors indicate changes in total electron content. Post-sunset zonal winds are highly reduced from their normal eastward flow. Is this due to ion drag from the lowered F-layer or to disturbance winds from high latitudes?
Fig. 5
Fig. 5
Spectral analysis of vertical drifts measured by C/NOFS-CINDI close to local noon, magnetic equator. Power spectrum for 1 month of data is shown. Almost all the power in the spectrum is for variations with horizontal scale sizes over 800 km (sampling frequency < 0.01 Hz), thus ICON is designed to observe the variability of the drivers chiefly of this scale and larger. Given orbital velocity, 1 Hz ~ 8 km.
Fig. 6
Fig. 6
a,b,c Observing System Simulation Experiment of HME fitting routine to retrieve tidal components of the temperature field at the local time of noon. The temperature at the noon meridian at 100 km altitude predicted by the TIMEGCM for a 24-hour period is shown in Figure 6a. Temperatures reconstructed from an HME fit to the TIMEGCM wind and temperature fields using global sampling in the 90-105 km altitude range are shown in Figure 6b. Temperatures from the HME fit constrained only by data in the −12 to +42 degree latitude range (simulating ICON’s orbit and views) are shown in Fig. 6c.
Fig. 7
Fig. 7
Mean vertical drift as a function of local time under quiet (case 0) and disturbed (case 2) electric field inputs prescribed by the Rice Convection Model [Toffoletto et al., 2003], after Huba et al. [2005]. The pre-noon maximum in upward drift corresponds to a peak in plasma production, while the 18 MLT peak is the pre-reversal enhancement.
Fig. 8
Fig. 8
The ICON MIGHTI Instrument
Fig. 9
Fig. 9
ICON Ion Velocity Meter (IVM)
Fig. 10
Fig. 10
ICON Far-Ultraviolet Imager (FUV)
Fig. 11
Fig. 11
The ICON EUV Instrument
Fig. 12
Fig. 12
The science data products for the ICON mission.
Fig. 13
Fig. 13
The ICON ICP, with four main boards in aluminum housings on a flexure mount, provide all necessary functionality for the 4 ICON science instruments, and a single point interface to the spacecraft. Unit is shown without a large flight radiator that attaches by the set of bolts to the LVPS.
Fig. 14
Fig. 14
a, b A model of the ICON science payload, viewed from a point above its Earth-facing side (Fig. 14a), and also from the side that will face the spacecraft (Fig. 14b). Each instrument and components are noted. The two star trackers (CHUs) are found on either side of the EUV instrument, also visible in Figure 15.
Fig. 15
Fig. 15
The angular boresights and extent of fields of views (FOV) of each of the instruments as designed. Final values are determined prior to launch and validated during in-flight 30-day checkout. IVM values are keepout zones. In these graphics, abbreviations MA,B are MIGHTI-A and MIGHTI-B and S/C is Spacecraft, which defines the observatory coordinate system. Table shows final instrument fields-of-view
Fig. 16
Fig. 16
The ICON observatory with solar array deployed
Fig. 17
Fig. 17
The ICON observatory accompanied by Orbital ATK I&T leads in Chandler, Arizona in May, 2017.
Fig. 18
Fig. 18
Geometry of the ICON observations required for Science Objective 1. ICON is shown near the magnetic equator. At position T=0, FUV and EUV instruments view the limb thermosphere/ionosphere (fields of views shown in light blue) while the IVM measures the in situ ion drift, representative of the electric field present on the field line (red arrows). MIGHTI (fields of view shown in light red) measure the relevant wind vector components (yellow) at positions T-3.5 min and T+3.5 min. The tangent point locations where MIGHTI samples the wind field vary with altitude following closely the Earth’s dipole magnetic field line that is intersecting the spacecraft at the T=0 position.
Fig. 19
Fig. 19
Cartoon of the conjugate observations. At pre-scheduled times when the geometry is correct, ICON initiates four timed yaw maneuvers (approximately −90°, +90°, +90° and −90°, exact angle depends on declination and initial orientation of the observatory) to make wind observations at two magnetically conjugate points.
Fig. 20
Fig. 20
Map of regions of potential Conjugate Operations. Regions in light blue show where Conjugate Operations may be centered in order to match northern and southern footpoint observations that are also magnetically conjugate. The combined offset of the wind measurements from the conjugate points is never 0 km but often less than 500 km, the width of two MIGHTI wind samples on the limb. Locations over the Pacific show regions where operations are possible in the descending node of the orbit. Locations over the Atlantic offer opportunities in the ascending node.

References

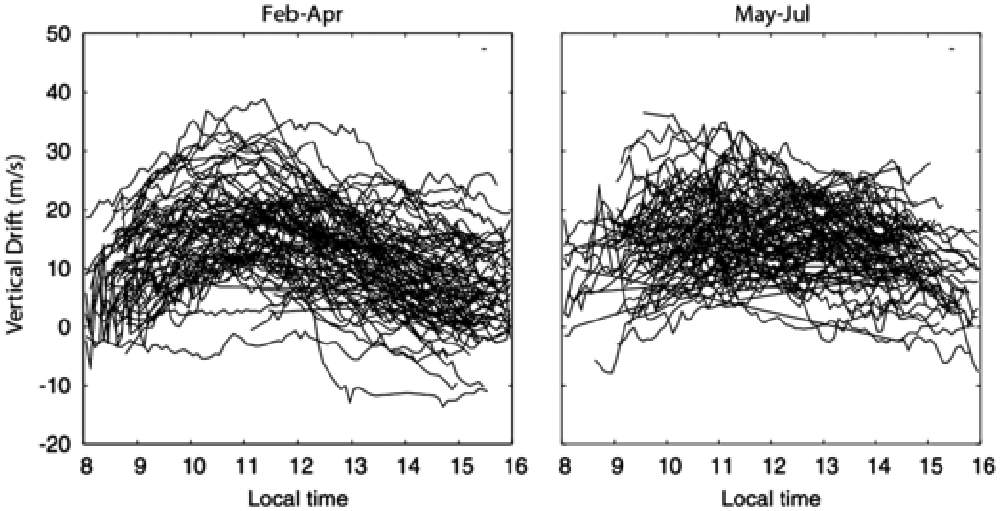
    1. Aiken P, A quiet time empirical model of equatorial vertical plasma drift in the Peruvian sector based on 150 km echoes. J. Geophys. Res 114, 02308 (2009). doi:10.1029/2008JA013751 - DOI
    1. Blanc M, Richmond AD, The ionospheric disturbance dynamo. J. Geophys. Res 85, 1669–1688 (1980)
    1. Bougher SW, Cravens TE, Grebowsky J, Luhmann J, The Aeronomy of Mars: Characterization by MAVEN of the Upper Atmosphere Reservoir That Regulates Volatile Escape. Space Sci. Rev 195, 423–456 (2015). doi:10.1007/s11214-014-0053-7 - DOI
    1. Bowyer S, Edelstein J, Lampton M, Very high sensitivity extreme ultraviolet spectrometer for diffuse radiation. Astrophys. J 485(2), 523 (1997).
    1. Burt J, Smith B, The Deep Space Climate Observatory: The DSCOVR Mission, in Aerospace Conference, 2012 IEEE (IEEE Publications, New York, New York, 2012), pp. 1–13