

Observations of greenhouse gases as climate indicators
- PMID: 33758443
- PMCID: PMC7940260
- DOI: 10.1007/s10584-021-03001-7
Observations of greenhouse gases as climate indicators
Abstract
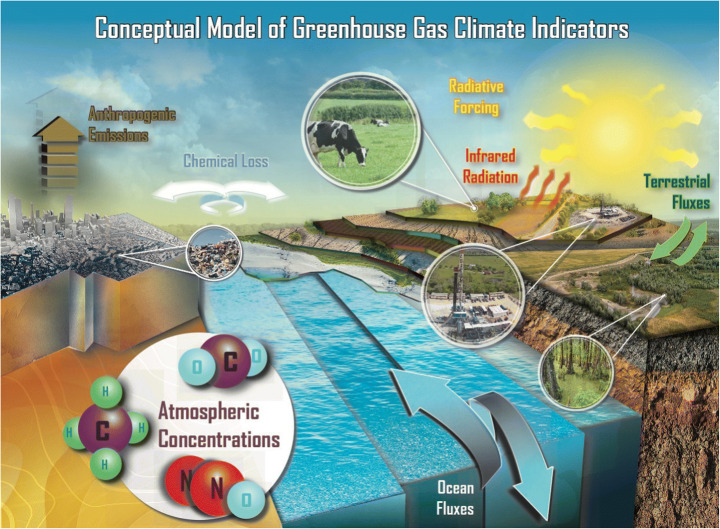
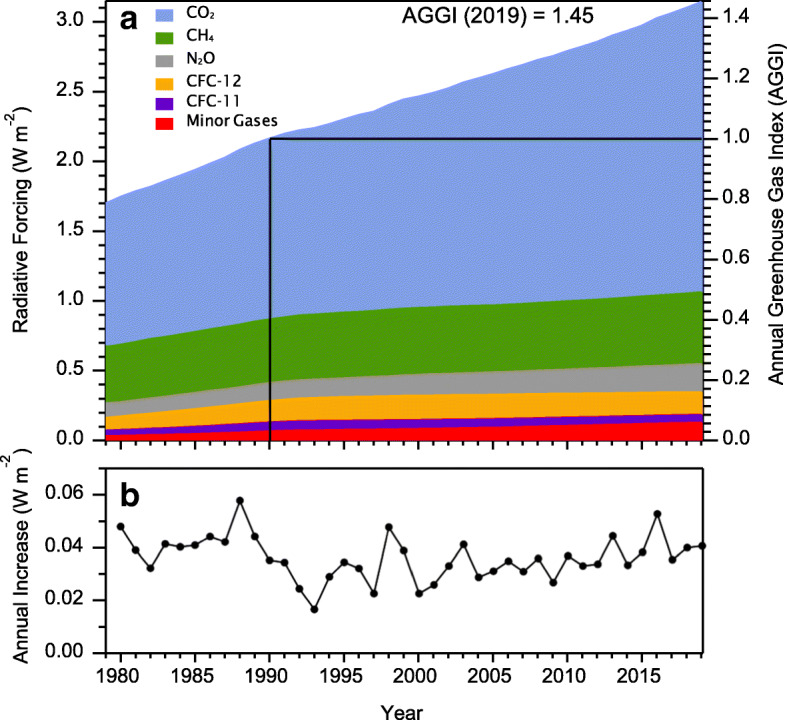
Humans have significantly altered the energy balance of the Earth's climate system mainly not only by extracting and burning fossil fuels but also by altering the biosphere and using halocarbons. The 3rd US National Climate Assessment pointed to a need for a system of indicators of climate and global change based on long-term data that could be used to support assessments and this led to the development of the National Climate Indicators System (NCIS). Here we identify a representative set of key atmospheric indicators of changes in atmospheric radiative forcing due to greenhouse gases (GHGs), and we evaluate atmospheric composition measurements, including non-CO2 GHGs for use as climate change indicators in support of the US National Climate Assessment. GHG abundances and their changes over time can provide valuable information on the success of climate mitigation policies, as well as insights into possible carbon-climate feedback processes that may ultimately affect the success of those policies. To ensure that reliable information for assessing GHG emission changes can be provided on policy-relevant scales, expanded observational efforts are needed. Furthermore, the ability to detect trends resulting from changing emissions requires a commitment to supporting long-term observations. Long-term measurements of greenhouse gases, aerosols, and clouds and related climate indicators used with a dimming/brightening index could provide a foundation for quantifying forcing and its attribution and reducing error in existing indicators that do not account for complicated cloud processes.
Keywords: Anthropogenic emissions; Atmospheric composition; Greenhouse gases; Radiative forcing.
© This is a U.S. government work and not under copyright protection in the U.S.; foreign copyright protection may apply 2021.
Conflict of interest statement
Conflict of interestThe authors declare no competing interests.
Figures

References
-
- Allen MR, Frame DJ, Huntingford C, Jones CD, Lowe JA, Meinshausen M, Meinshausen N (2009) Warming caused by cumulative carbon emissions towards the trillionth tonne. Nature, 458(7242):1163–6. 10.1038/nature08019.PMID:19407800 - PubMed
-
- Allen M. R. et al. (2018) Framing and context. in “Global warming of 1.5 °C. An IPCC Special Report on the impacts of global warming of 1.5 °C above pre-industrial levels and related global greenhouse gas emission pathways, in the context of strengthening the global response to the threat of climate change, sustainable development, and efforts to eradicate poverty.” (IPCC).
-
- Birdsey R, Gurwick NP, Gurney KR, Shrestha G, Mayes MA, Najjar RG, Reed SC, Romero-Lankao P. Appendix D. Carbon measurement approaches and accounting frameworks. In: Cavallaro N, Shrestha G, Birdsey R, Mayes MA, Najjar RG, Reed SC, Romero-Lankao P, Zhu Z, editors. Second State of the Carbon Cycle Report (SOCCR2): a sustained assessment report. Washington, DC: U.S. Global Change Research Program; 2018. pp. 834–838.
Grants and funding
LinkOut - more resources
Full Text Sources
Other Literature Sources