. 2021;106(2):1169-1185.
doi: 10.1007/s11071-021-06371-w. Epub 2021 Mar 18.

Mechanisms of recurrent outbreak of COVID-19: a model-based study

Affiliations

Mechanisms of recurrent outbreak of COVID-19: a model-based study

Chuanliang Han et al. Nonlinear Dyn. 2021.

Abstract

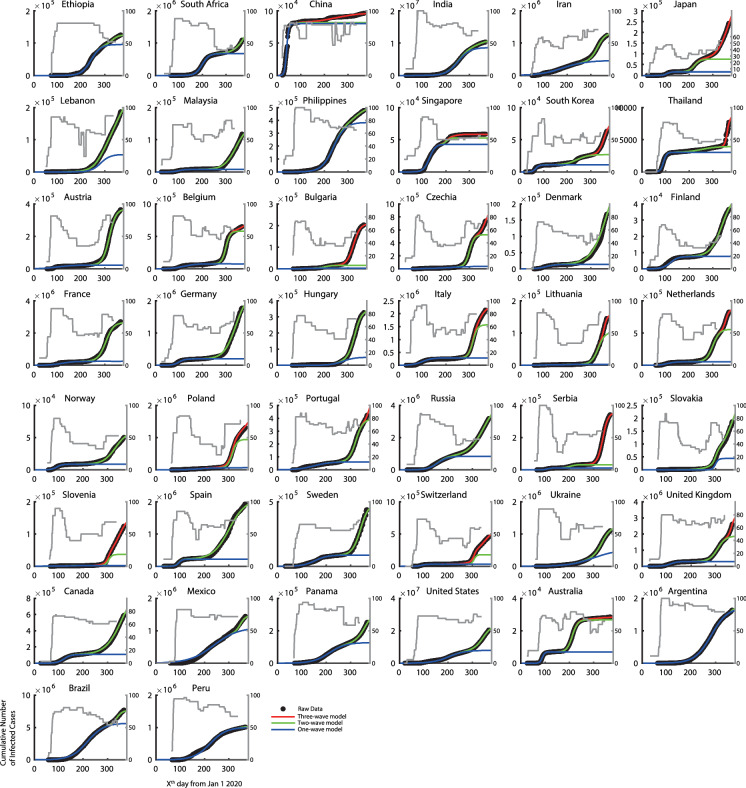
Recurrent outbreaks of the coronavirus disease 2019 (COVID-19) have occurred in many countries around the world. We developed a twofold framework in this study, which is composed by one novel descriptive model to depict the recurrent global outbreaks of COVID-19 and one dynamic model to understand the intrinsic mechanisms of recurrent outbreaks. We used publicly available data of cumulative infected cases from 1 January 2020 to 2 January 2021 in 30 provinces in China and 43 other countries around the world for model validation and further analyses. These time series data could be well fitted by the new descriptive model. Through this quantitative approach, we discovered two main mechanisms that strongly correlate with the extent of the recurrent outbreak: the sudden increase in cases imported from overseas and the relaxation of local government epidemic prevention policies. The compartmental dynamical model (Susceptible, Exposed, Infectious, Dead and Recovered (SEIDR) Model) could reproduce the obvious recurrent outbreak of the epidemics and showed that both imported infected cases and the relaxation of government policies have a causal effect on the emergence of a new wave of outbreak, along with variations in the temperature index. Meanwhile, recurrent outbreaks affect consumer confidence and have a significant influence on GDP. These results support the necessity of policies such as travel bans, testing of people upon entry, and consistency of government prevention and control policies in avoiding future waves of epidemics and protecting economy.

Keywords: COVID-19; Government policy; Logistic model; Recurrent outbreak; SEIDR model.


Conflict of interest statement

Conflict of interestThe authors declare no competing interest.

Figures

Fig. 1
Fig. 1
Relationship between the recurrent outbreaks of COVID-19 and imported infected cases. The top panel of a shows the epidemic in Anhui province with a low ratio of imported cases, which could be explained by one-wave model. The bottom panel a shows the epidemic in Fujian province with a high ratio of imported cases, which could be explained by a three-wave model. The horizontal axis in this panel denotes the xth day after 1 January 2020. The vertical axis in this panel is the cumulative number of infected cases (black dots). The blue line is the fitting curve by the one-wave sigmoid model; the green line is the fitting curve by the two-wave sigmoid model; the red line is the fitting curve by the three-wave sigmoid model. b Illustrates the distribution of the goodness of fit in 30 provinces in China´s mainland. c Shows the scatter plot of the index for multiple waves and the ratio of the cumulative number of imported infected cases from abroad with all infected cases in each province
Fig. 2
Fig. 2
Time series of COVID-19 infected cases in 28 selected provinces of China. Each panel represents one provincial administrative unit for the multiple waves of the epidemic. The horizontal axis in each panel denotes the xth day after 1 January 2020. The content in each panel is the same as Fig. 1a
Fig. 3
Fig. 3
Relationship between the recurrent outbreaks of COVID-19 and relaxation of government policies. The top panel a shows the epidemic in Argentina with low extent of relaxation of the stringency index, which has weak recurrent outbreak strength. The bottom panel a shows the epidemic in South Africa with high extent of relaxation on the stringency index, which has strong recurrent outbreak strength. The horizontal axis in this panel denotes the xth day after 1 January 2020. The left vertical axis in this panel is the cumulative number of infected cases (black dots). The blue line is the fitting curve by the one-wave sigmoid model; the green line is the fitting curve by the two-wave sigmoid model; the red line is the fitting curve by the three-wave sigmoid model. The gray curve shows the time series of stringency index corresponding to the right vertical axis; b illustrates the distribution of the goodness of fit by the model in 44 countries around world. c Shows the scatter plot of recurrent outbreak index and relaxation of government measures (stringency index) for 44 countries
Fig. 4
Fig. 4
Time series of COVID-19 infected cases with policy indices in 44 countries. Each panel represents one country for the multiple waves of the epidemic and indices of government response. The content in each panel is the same as Fig. 3a
Fig. 5
Fig. 5
Simulation of the recurrent outbreak of COVID-19. a Is the model structure of the SEIDR model. Individuals are divided into the following five classes (susceptible (S), exposed (E), infectious (I), dead (D) and recovered (R) population). b Shows the simulated time series of the cumulative infected case in a different weight of oversea imported (different color) setting WC and WTemp is 0. c Shows the T(t) in a different weight of oversea imported (different color). d Is the scatter plot of the weight of oversea imported (WT) and recurrent outbreak index. e Shows the simulated time series of the cumulative infected case in a different extent of inconsistent policies (different color) setting WT and WTemp is 0. f Shows the C(t) in a different extent of inconsistent policies (different color). g Is the scatter plot of relaxation of government policy and the recurrent outbreak index. h Shows the simulated time series of the cumulative infected cases in a different extent of inconsistent policies (different color) setting WT and WC is 0. i Shows the Temp(t) in a different extent of variations (different color). j Is the scatter plot of temperature index and the recurrent outbreak index. (Color figure online)
Fig. 6
Fig. 6
Recurrent outbreak index and stringency index are strongly correlated with the recurrent consumer confidence index. a Shows the scatter plot between recurrent outbreaks of COVID-19 and recurrent consumer confidence. b Shows the scatter plot between relaxation of stringency index and recurrent consumer confidence. c Shows the scatter plot between change of consumer confidence index and change of GDP index in the first three quarters

Similar articles

Cited by

References

    1. Huang C, Wang Y, Li X, Ren L, Zhao J, Hu Y, Zhang L, Fan G, Xu J, Gu X, Cheng Z, Yu T, Xia J, Wei Y, Wu W, Xie X, Yin W, Li H, Liu M, Xiao Y, Gao H, Guo L, Xie J, Wang G, Jiang R, Gao Z, Jin Q, Wang J, Cao B. Clinical features of patients infected with 2019 novel coronavirus in Wuhan, China. Lancet. 2020;395:497–506. doi: 10.1016/S0140-6736(20)30183-5. - DOI - PMC - PubMed
    1. Li Q, Guan X, Wu P, Wang X, Zhou L, Tong Y, Ren R, Leung KSM, Lau EHY, Wong JY, Xing X, Xiang N, Wu Y, Li C, Chen Q, Li D, Liu T, Zhao J, Liu M, Tu W, Chen C, Jin L, Yang R, Wang Q, Zhou S, Wang R, Liu H, Luo Y, Liu Y, Shao G, Li H, Tao Z, Yang Y, Deng Z, Liu B, Ma Z, Zhang Y, Shi G, Lam TTY, Wu JT, Gao GF, Cowling BJ, Yang B, Leung GM, Feng Z. Early transmission dynamics in Wuhan, China, of novel coronavirus-infected pneumonia. N. Engl. J. Med. 2020;382:1199–1207. doi: 10.1056/NEJMoa2001316. - DOI - PMC - PubMed
    1. Wang H, Wang Z, Dong Y, Chang R, Xu C, Yu X, Zhang S, Tsamlag L, Shang M, Huang J, Wang Y, Xu G, Shen T, Zhang X, Cai Y. Phase-adjusted estimation of the number of Coronavirus Disease 2019 cases in Wuhan, China. Cell Discov. 2020;6:4–11. doi: 10.1038/s41421-020-0148-0. - DOI - PMC - PubMed
    1. Wang D, Zhou M, Nie X, Qiu W, Yang M, Wang X, Xu T, Ye Z, Feng X, Xiao Y, Chen W. Epidemiological characteristics and transmission model of Corona virus disease 2019 in China. J. Infect. 2020;80:e25–e27. doi: 10.1016/j.jinf.2020.03.008. - DOI - PMC - PubMed
    1. Zhou P, Yang XL, Wang XG, Hu B, Zhang L, Zhang W, Si HR, Zhu Y, Li B, Huang CL, Chen HD, Chen J, Luo Y, Guo H, Jiang RD, Liu MQ, Chen Y, Shen XR, Wang X, Zheng XS, Zhao K, Chen QJ, Deng F, Liu LL, Yan B, Zhan FX, Wang YY, Xiao GF, Shi ZL. A pneumonia outbreak associated with a new coronavirus of probable bat origin. Nature. 2020;579:270–273. doi: 10.1038/s41586-020-2012-7. - DOI - PMC - PubMed

LinkOut - more resources