

The effect of consecutive ambient air pollution on the hospital admission from chronic obstructive pulmonary disease in the Chengdu region, China
- PMID: 33758631
- PMCID: PMC7971392
- DOI: 10.1007/s11869-021-00998-9
The effect of consecutive ambient air pollution on the hospital admission from chronic obstructive pulmonary disease in the Chengdu region, China
Abstract
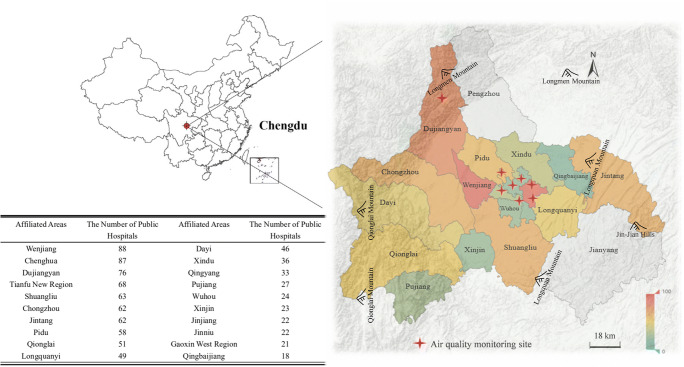
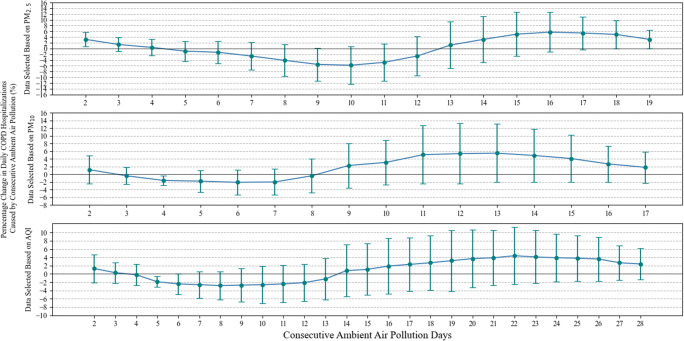
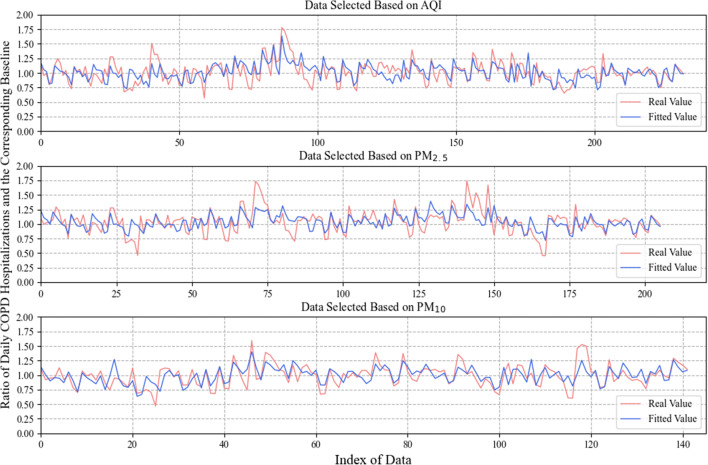
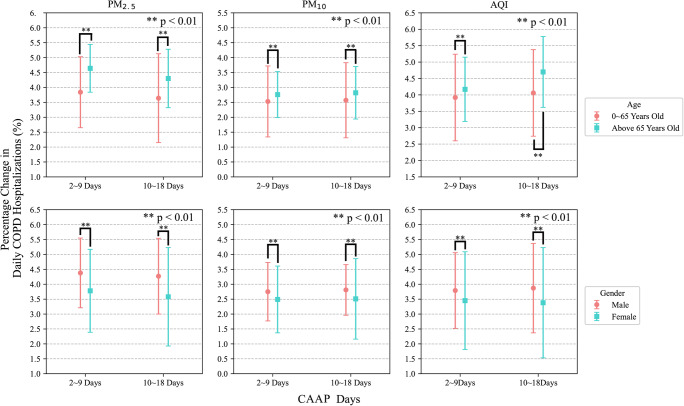
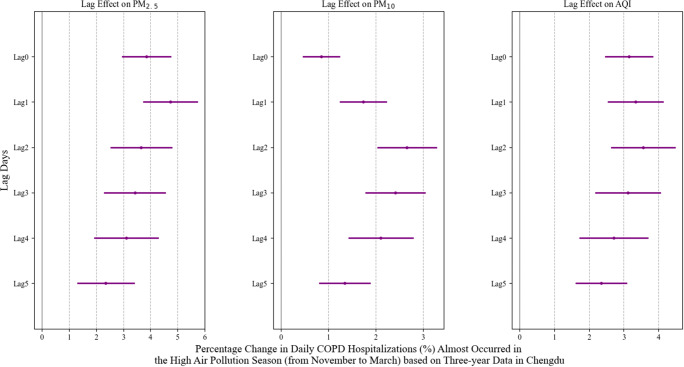
Hospitalisation risks for chronic obstructive pulmonary disease (COPD) have been attributed to ambient air pollution worldwide. However, a rise in COPD hospitalisations may indicate a considerable increase in fatality rate in public health. The current study focuses on the association between consecutive ambient air pollution (CAAP) and COPD hospitalisation to offer predictable early guidance towards estimates of COPD hospital admissions in the event of consecutive exposure to air pollution. Big data analytics were collected from 3-year time series recordings (from 2015 to 2017) of both air data and COPD hospitalisation data in the Chengdu region in China. Based on the combined effects of CAAP and unit increase in air pollutant concentrations, a quasi-Poisson regression model was established, which revealed the association between CAAP and estimated COPD admissions. The results show the dynamics and outbreaks in the variations in COPD admissions in response to CAAP. Cross-validation and mean squared error (MSE) are applied to validate the goodness of fit. In both short-term and long-term air pollution exposures, Z test outcomes show that the COPD hospitalisation risk is greater for men than for women; similarly, the occurrence of COPD hospital admissions in the group of elderly people (> 65 years old) is significantly larger than that in lower age groups. The time lag between the air quality and COPD hospitalisation is also investigated, and a peak of COPD hospitalisation risk is found to lag 2 days for air quality index (AQI) and PM10, and 1 day for PM2.5. The big data-based predictive paradigm would be a measure for the early detection of a public health event in post-COVID-19. The study findings can also provide guidance for COPD admissions in the event of consecutive exposure to air pollution in the Chengdu region.
Keywords: Air pollutant concentration; Big data analytics; Chronic obstructive pulmonary disease; Consecutive ambient air pollution; Hospital admission.
© The Author(s), under exclusive licence to Springer Nature B.V. 2021.
Figures
Similar articles
-
Association Between Consecutive Ambient Air Pollution and Chronic Obstructive Pulmonary Disease Hospitalization: Time Series Study During 2015-2017 in Chengdu China.Annu Int Conf IEEE Eng Med Biol Soc. 2020 Jul;2020:5378-5381. doi: 10.1109/EMBC44109.2020.9176504. Annu Int Conf IEEE Eng Med Biol Soc. 2020. PMID: 33019197
-
Effects of short-term exposure to air pollution on hospital admissions of young children for acute lower respiratory infections in Ho Chi Minh City, Vietnam.Res Rep Health Eff Inst. 2012 Jun;(169):5-72; discussion 73-83. Res Rep Health Eff Inst. 2012. PMID: 22849236
-
Multicity study of air pollution and mortality in Latin America (the ESCALA study).Res Rep Health Eff Inst. 2012 Oct;(171):5-86. Res Rep Health Eff Inst. 2012. PMID: 23311234
-
COPD Patients as Vulnerable Subpopulation for Exposure to Ambient Air Pollution.Curr Environ Health Rep. 2018 Mar;5(1):70-76. doi: 10.1007/s40572-018-0178-z. Curr Environ Health Rep. 2018. PMID: 29383658 Review.
-
Impact of long-term exposure to ambient air pollution on the incidence of chronic obstructive pulmonary disease: A systematic review and meta-analysis.Environ Res. 2021 Mar;194:110703. doi: 10.1016/j.envres.2020.110703. Epub 2021 Jan 6. Environ Res. 2021. PMID: 33417909
Cited by
-
Mortality and morbidity of asthma and chronic obstructive pulmonary disease associated with ambient environment in metropolitans in Taiwan.PLoS One. 2021 Jul 6;16(7):e0253814. doi: 10.1371/journal.pone.0253814. eCollection 2021. PLoS One. 2021. PMID: 34228742 Free PMC article.
References
-
- Bai K-J, Chuang K-J, Chen J-K, Tsai C-Y, Yang Y-L, Chang C-C, Chen TT, Lee CN, Feng PH, Chen KY, Lee KY, Su CL, Ho SC, Wu SM, Chuang HC. Alterations by air pollution in inflammation and metals in pleural effusion of pneumonia patients. Int J Environ Res Public Health. 2019;16(5):705. doi: 10.3390/ijerph16050705. - DOI - PMC - PubMed
LinkOut - more resources
Full Text Sources
Other Literature Sources